You’re probably wondering:
“What is Price Action Trading?”
Price action trading is a methodology that relies on historical prices (open, high, low, and close) to help you make better trading decisions.
Unlike indicators, fundamentals, or algorithms… price action tells you what the market is doing — and not what you think it should do.
Now, this isn’t the Holy Grail. But, if you devote time to learning price action trading, you’ll trade with cleaner charts, and can pinpoint your entries & exits with better precision.
That’s why I’ve written 2873 words in today’s post, teaching you the secrets of Price Action Trading.
Here’s what you’ll discover…
- The truth about Support and Resistance nobody tells you
- Market behaviour secrets: How the market really moves…
- The secret to reading Candlestick Patterns — How to time your trading entries with deadly accuracy
- Candlestick patterns cheat sheet: How to understand any candlestick pattern without memorizing a single one
- The M.A.E Trading Formula (A simple Price Action Trading system anyone can learn)
Are you ready?
Then let’s get started…
This is an extensive post and I would encourage you to download the PDF file below, so you can reference it in future.
The truth about Support and Resistance nobody tells you
First, let’s define what’s Support and Resistance so we’re all on the same page.
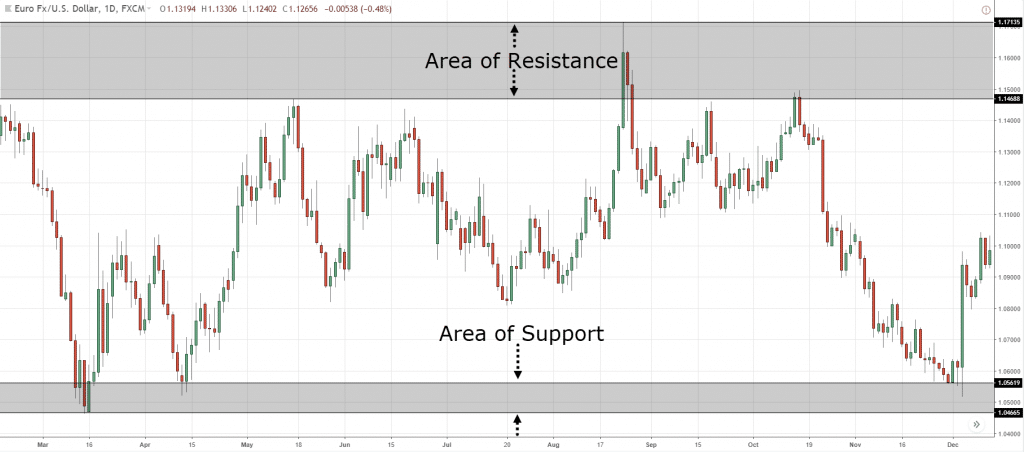
Support – A horizontal area on your chart where you can expect buyers to push the price higher.
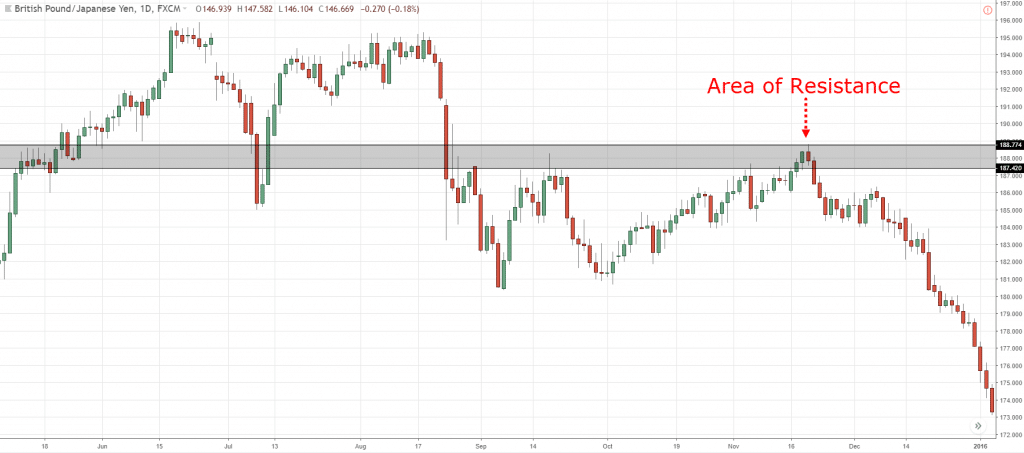
Resistance – A horizontal area on your chart where you can expect sellers to push the price lower.
Here are a few examples…
Support and Resistance on EUR/USD Daily:
Support on (USD/CAD):
Resistance on (GBP/JPY):
Also:
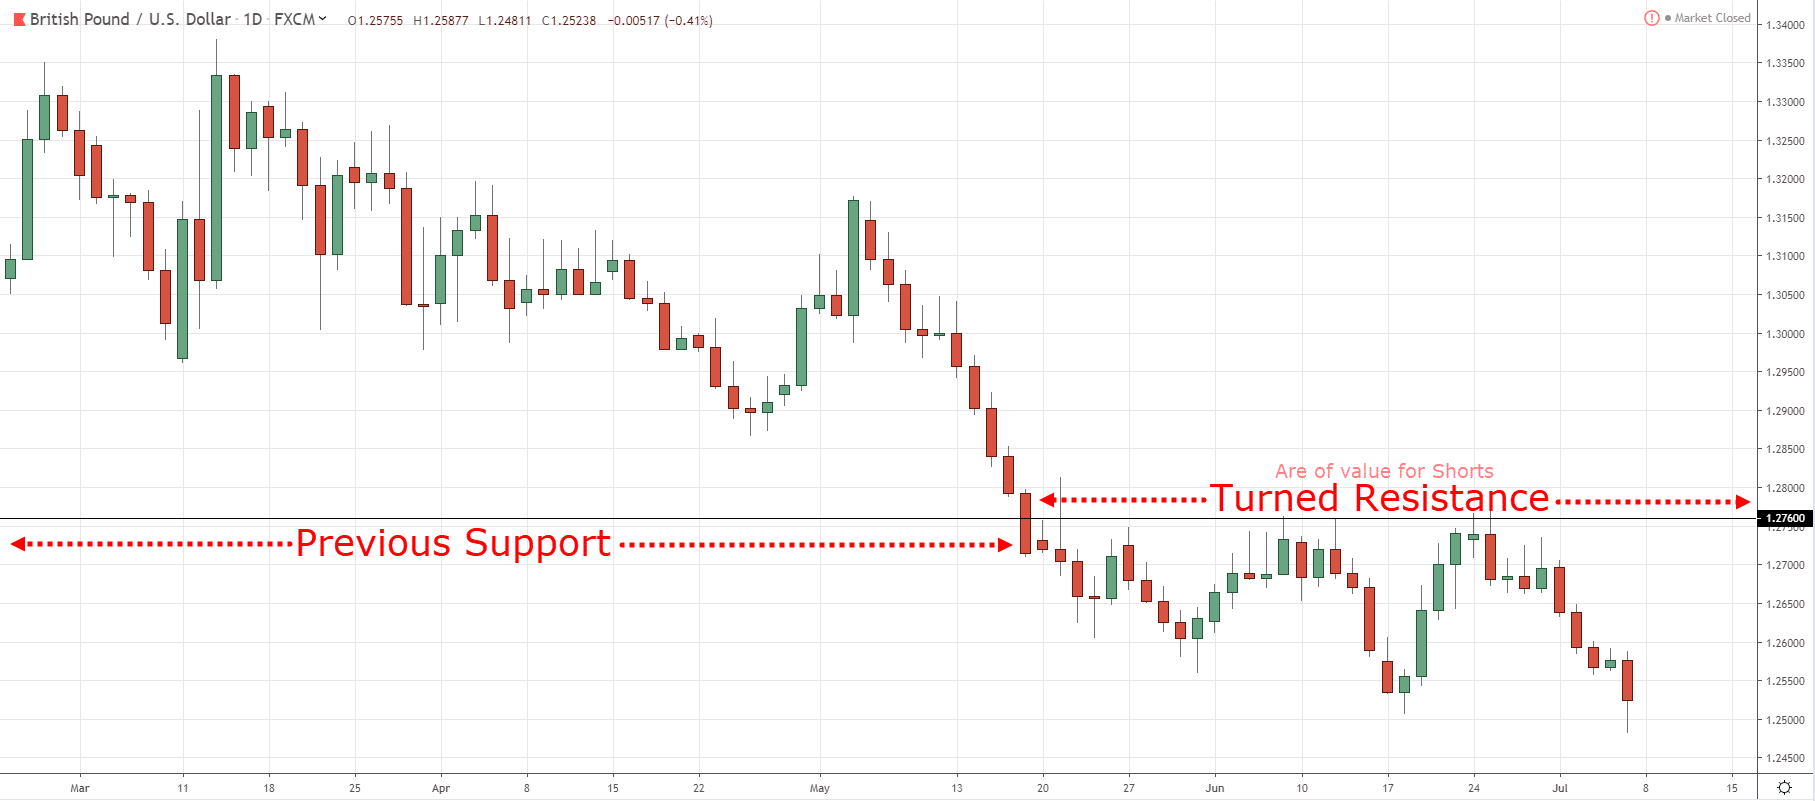
Support and Resistance can swop roles.
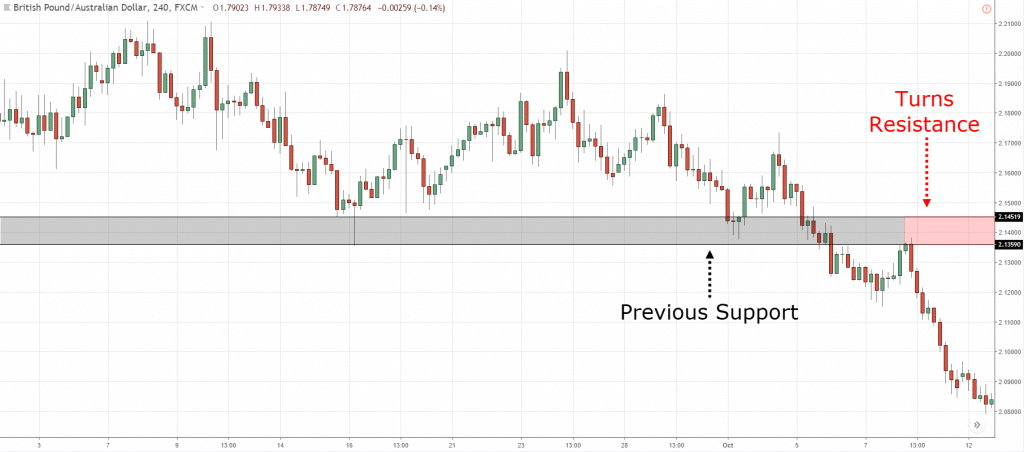
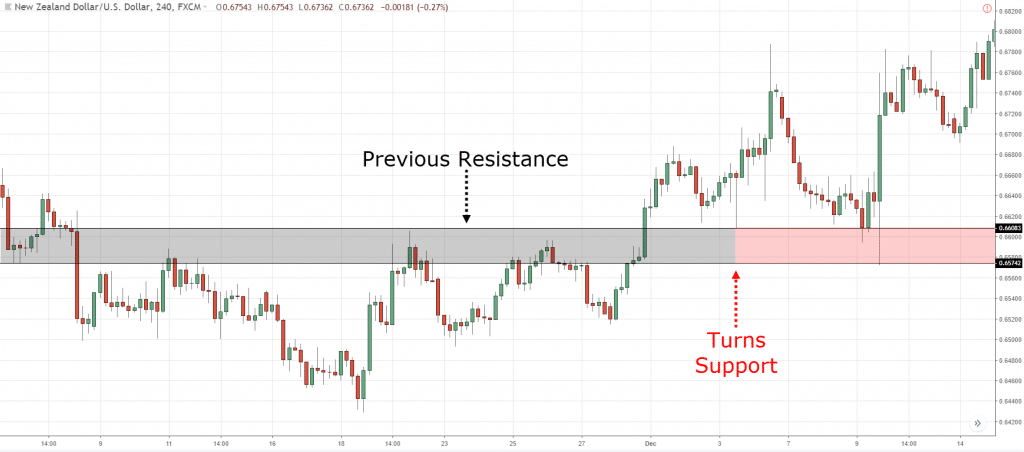
This means when Support breaks it can become Resistance. And when Resistance breaks it can become Support.
An example…
Previous Support turns Resistance on (GBP/AUD):
Previous Resistances turns Support on (NZD/USD):
But why does it happen?
Because when the price breaks Support, traders who are long are losing money and in the “red’.
So, when the price rallies back to Support, this group of traders can now get out of their losing trade at breakeven — and that induce selling pressure.
And that’s not all because traders who missed the breakout will want to short the markets which increase the selling pressure.
And that’s why when Support breaks it tends to become Resistance.
Make sense?
Now you’re probably wondering…
“But how do I draw Support and Resistance on my charts?”
That’s a good question.
So, here are the guidelines I use…
- Zoom out your charts (at least 200 bars for me)
- Draw the most obvious levels (if you need to second guess, then it’s not an important level)
- Adjust your levels to get the most number of “touches” (it can be body or wick)
Now, if you want a full training on how to draw Support and Resistance, then check out this video below…
Next…
Dynamic Support & Resistance
According to Classical Technical Analysis, Support and Resistance are horizontal areas on your chart.
This is useful when the market is in a range or weak trend.
But in strong trend markets, it won’t work well and that’s where you need to rely on dynamic Support and Resistance.
What the heck is dynamic?
It means Support and Resistance “move along” with the price instead of being static.
For example:
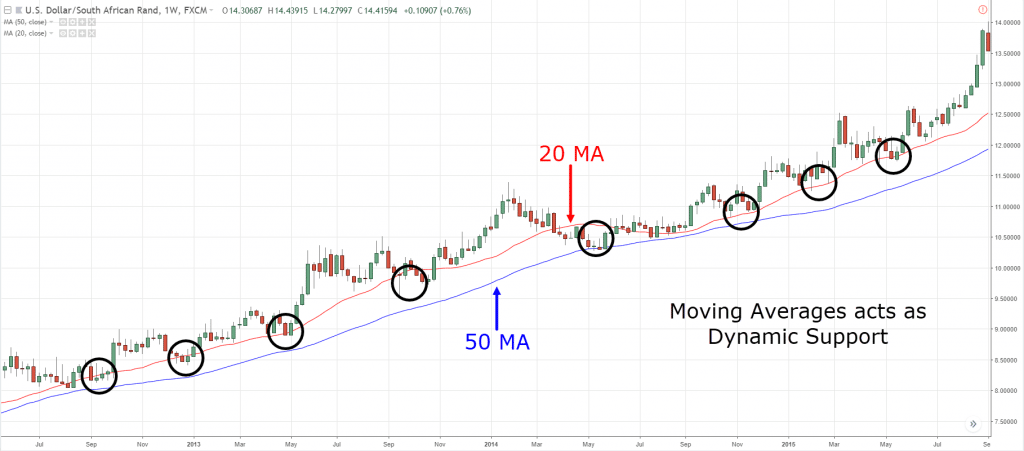
The 20-period Moving Average can act as dynamic Support in strong trending market…
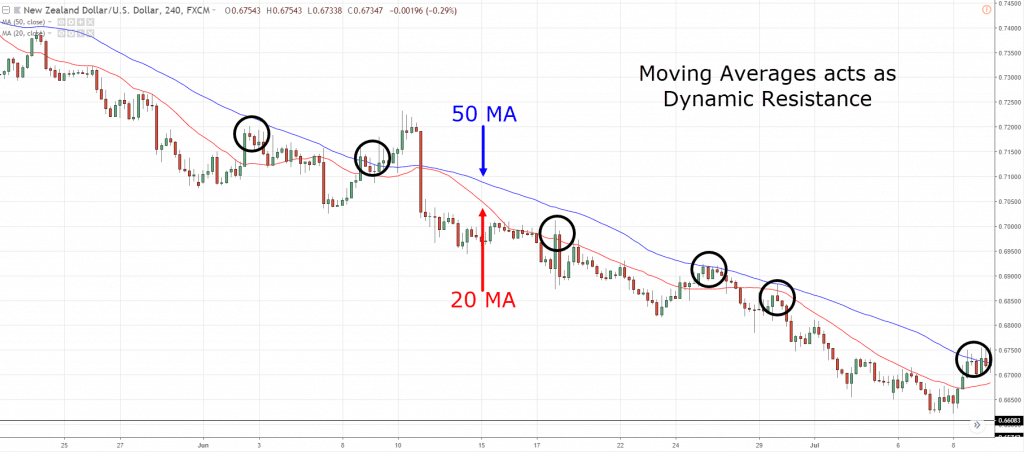
Or the 50-period Moving Average can act as dynamic Resistance in a healthy trend…
Pro Tip:
Dynamic Support & Resistance can also be in the form of Trendline or Trend Channel.
Market behaviour secrets: How the market really moves…
Here’s the deal:
The markets are always changing (I’m sure you’d realize this by now).
It can in an uptrend, downtrend, range, low volatility, high volatility, etc.
But, if you take a step back and look at the big picture, you’d realize the market tends to be in 1 of 4 stages…
- Accumulation
- Advancing
- Distribution
- Declining
I’ll explain…
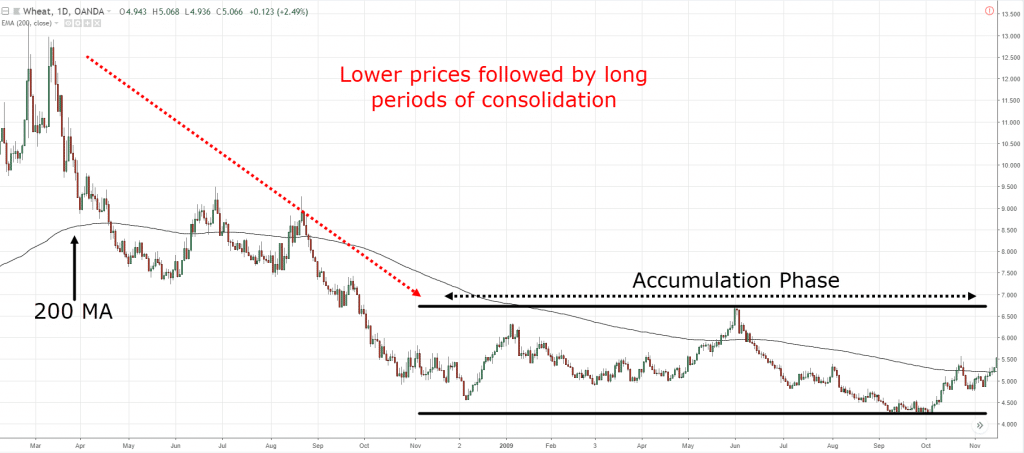
Stage #1: The Accumulation Stage
The Accumulation stage occurs after a decline in price, and it looks like a range market in a downtrend.
Here are the things to look for:
- Occurs after the price have fallen over the last 5 months or more (on Daily timeframe)
- It looks like a range market with obvious Support and Resistance areas — in a downtrend
- The 200-day Moving Average is flattening out
- The price whips back and forth around the 200-day Moving Average
Here’s an example…
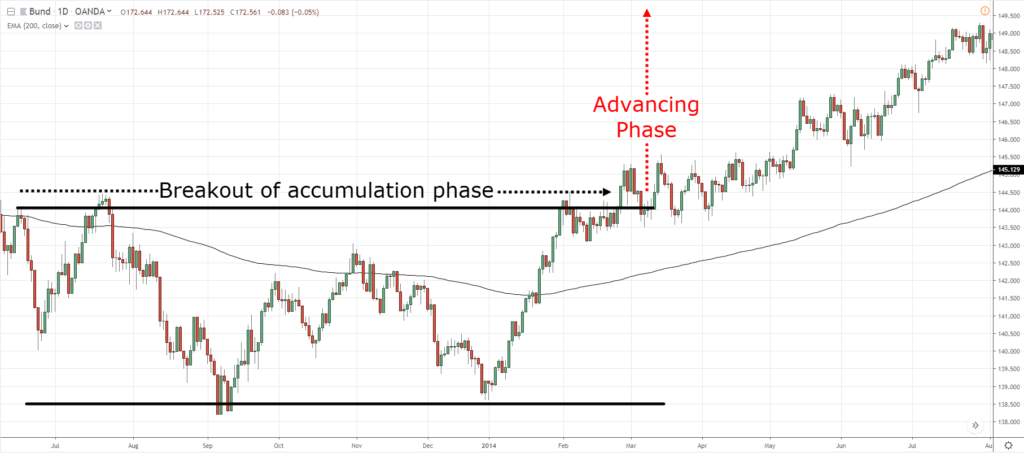
Stage #2: The Advancing Stage
The Advancing Stage is an uptrend with a series of higher highs and lows.
Here are the things to look for:
- Occurs after the price breaks out of Resistance in an Accumulation stage
- You see a series of higher highs and lows
- The price is above the 200-day Moving Average
- The 200-day Moving Average is starting to point higher
Here’s what I mean…
Now here’s the thing…
No market goes up forever. It eventually gets “tired” and that’s where it enters stage 3…
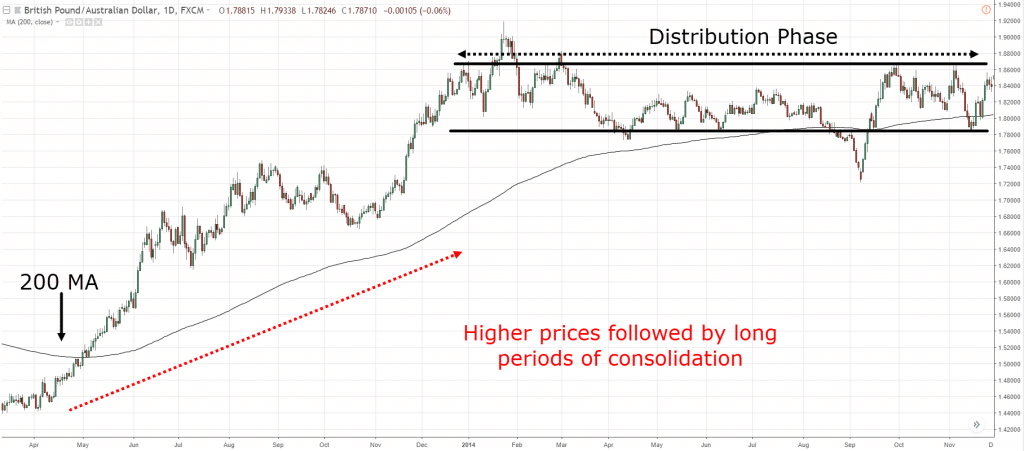
Stage #3: The Distribution Stage
The Distribution stage occurs after a rise in price, and it looks like a range market in an uptrend.
Here are the things to look for:
- Occurs after the price have risen over the last 5 months or more (on Daily timeframe)
- It looks like a range market with obvious Support and Resistance areas — in an uptrend
- The 200-day Moving Average is flattening out
- The price whips back and forth around the 200-day Moving Average
It looks something like this…
At this point, the market is still in equilibrium with both buyers and sellers on equal footing.
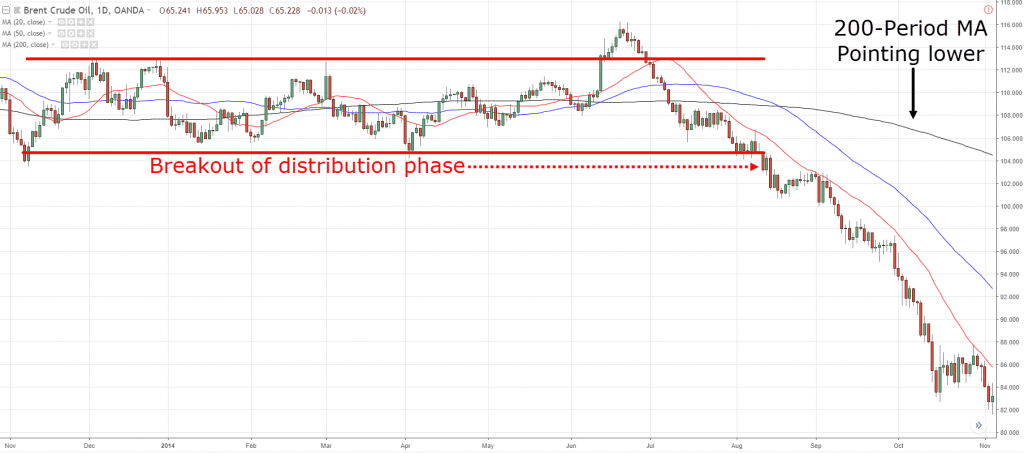
However, the tide is turned if the price breaks below Support and that’s where we enter the final stage…
Stage #4: The Declining Stage
The Declining Stage is a downtrend with a series of lower highs and lows.
Here are the things to look for:
- Occurs after the price breaks out of Support in a Distribution stage
- You see a series of lower highs and lows
- The price is below the 200-day Moving Average
- The 200-day Moving Average is starting to point lower
An example…
And if you have any trouble trying to identify the direction of the trend, then go watch this training…
Now you might be thinking…
“What’s the point of learning the 4 stages of the market?”
Here’s the thing:
If you can recognize the current stage of the market, then you can adopt the appropriate Forex price action strategy or trading strategy to trade it.
Here’s how…
If the market is in an Advancing stage, then you want to be a buyer (not a seller).
This means you can look to buy breakouts or pullbacks.
Or…
If the market is in a Distribution stage, then you know there’s a huge potential downside if the price breaks below Support.
This means you can look to short the breakdown of Support or wait for the breakdown to occur, then sell on the pullback.
Now once you understand the 4 stages of the market, then you’ll know which Price Action Trading strategies to use in a given market condition — and you’ll never be “lost” again.
The secret to reading Candlestick Patterns — How to time your trading entries with deadly accuracy
At this point:
You’ve learned the big picture of Price Action Trading.
You know where to enter your trades (Support and Resistance) and what you should do in different market conditions (the 4 stages of the market).
But there’s still one part of the puzzle missing, and that’s when to enter a trade.
So, that’s where candlestick patterns come into play.
Let’s dive in…
What is a candlestick pattern and how does it work?
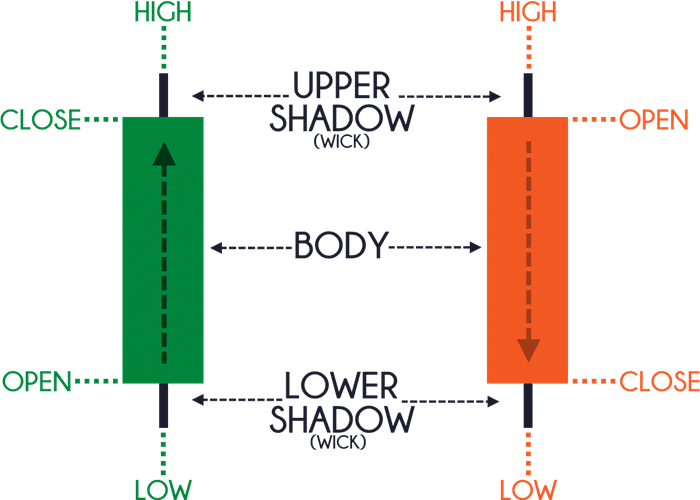
A candlestick pattern has 4 data points:
Open – The opening price
High – The highest price over a fixed time period
Low – The lowest price over a fixed time period
Close – The closing price
Here’s what I mean:
For a Bullish candle, the open is always below the close.
And for a Bearish candle, the open is always above the close.
Next, you’ll learn a few powerful candlestick patterns to help you better time your entries…
- Hammer
- Shooting Star
- Bullish Engulfing Pattern
- Bearish Engulfing Pattern
I’ll explain…
Hammer
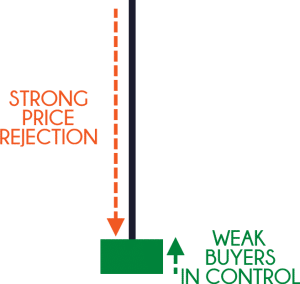
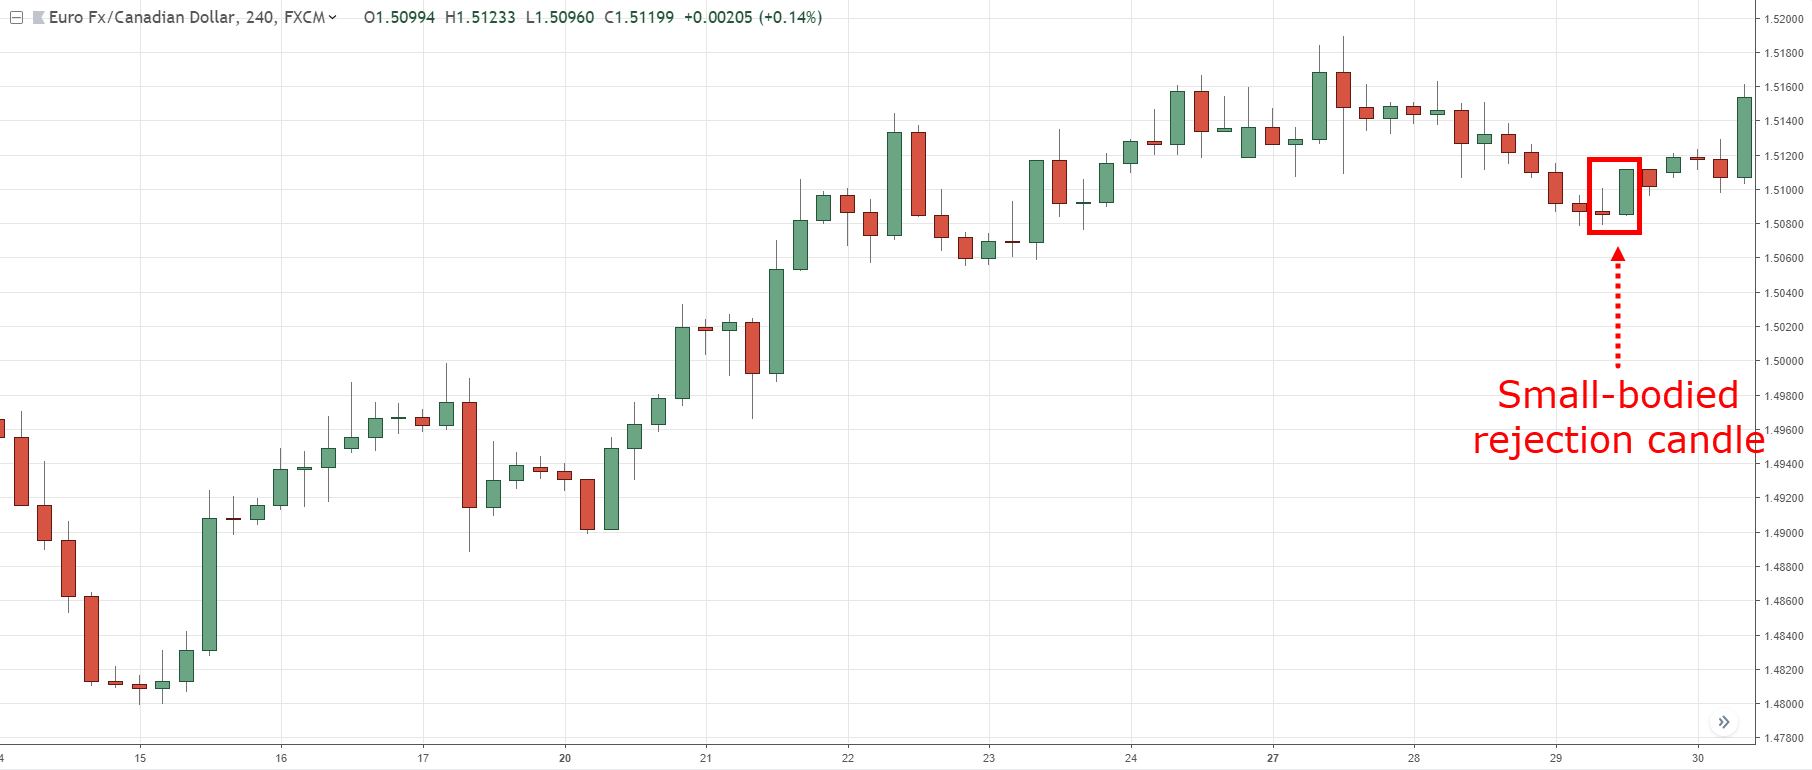
A Hammer is a (1- candle) bullish reversal pattern that forms after a decline in price.
Here’s how to recognize it:
- Little to no upper shadow
- The price closes at the top ¼ of the range
- The lower shadow is about 2 or 3 times the length of the body
And this is what a Hammer means…
- When the market opens, the sellers took control and pushed price lower
- At the selling climax, huge buying pressure stepped in and pushed price higher
- The buying pressure is so strong that it closed above the opening price
In short, a hammer is a bullish reversal candlestick pattern that shows rejection of lower prices.
Now, just because you see a Hammer doesn’t mean the trend will reverse immediately.
You’ll need more “confirmation” to increase the odds of the trade working out and I’ll cover that in details later.
Moving on…
Bullish Engulfing Pattern
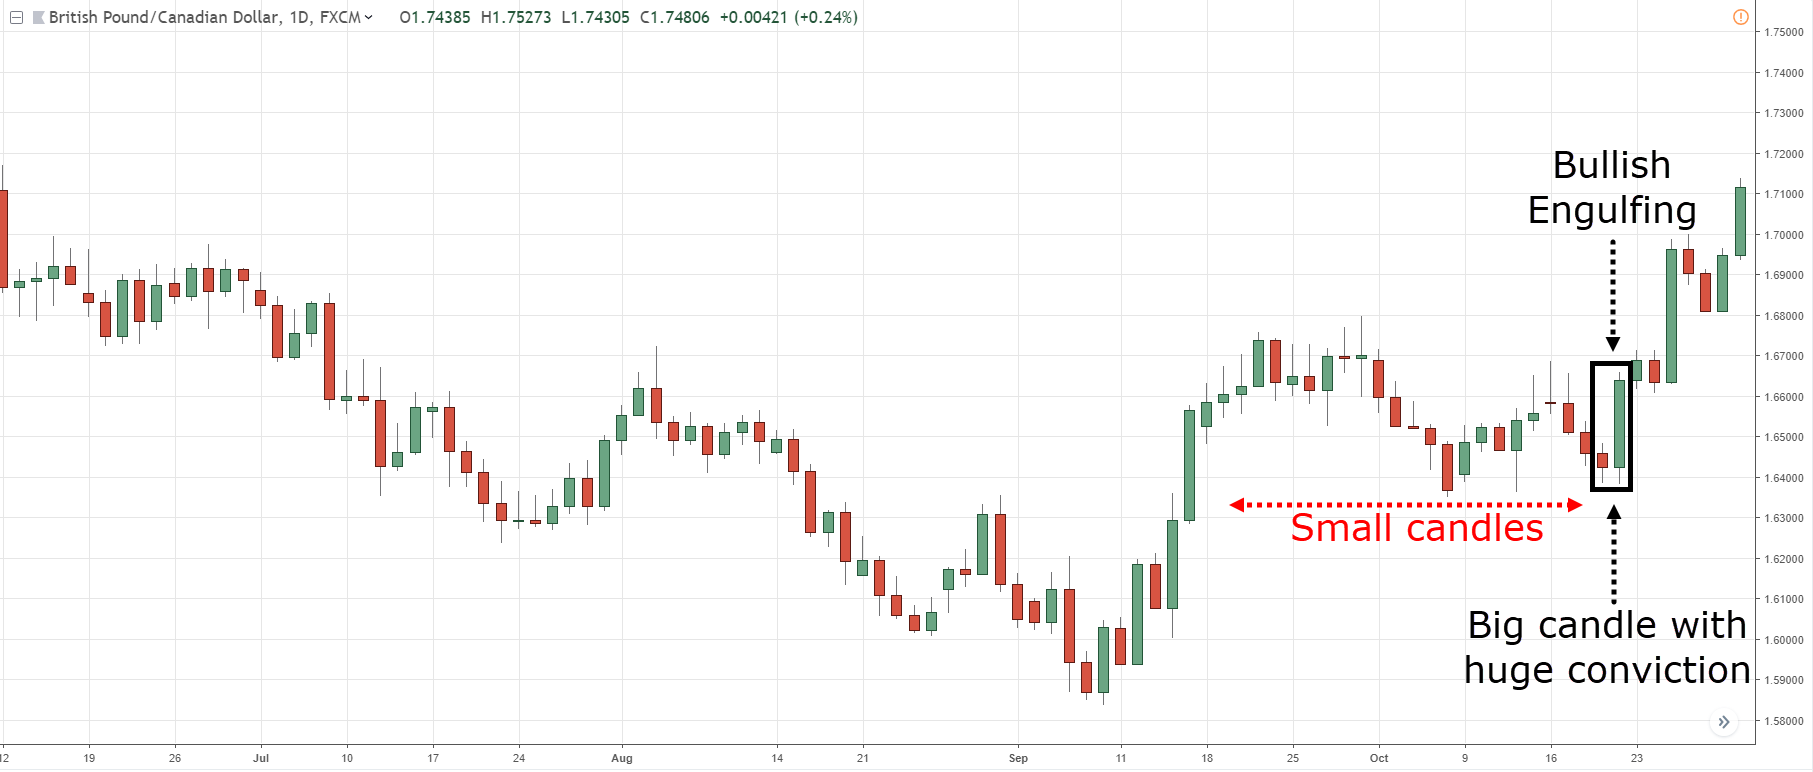
A Bullish Engulfing Pattern is a (2-candle) bullish reversal candlestick pattern that forms after a decline in price.
Here’s how to recognize it:
- The first candle has a bearish close
- The body of the second candle completely “covers” the body first candle (without taking into consideration the shadow)
- The second candle closes bullish
And this is what a Bullish Engulfing Pattern means…
- On the first candle, the sellers are in control as they closed lower for the period
- On the second candle, strong buying pressure stepped in and closed above the previous candle’s high — which tells you the buyers have won the battle for now
In essence, a Bullish Engulfing Pattern tells you the buyers have overwhelmed the sellers and are now in control.
And lastly, a Hammer is usually a Bullish Engulfing Pattern on the lower timeframe because of the way candlesticks are formed on multiple timeframes.
Here’s what I mean:
Make sense?
Shooting Star
A Shooting Star is a (1- candle) bearish reversal pattern that forms after an advanced in price.
(The opposite of a Shooting Star is Hammer.)
Here’s how to recognize it:
- Little to no lower shadow
- The price closes at the bottom ¼ of the range
- The upper shadow is about 2 or 3 times the length of the body
And this is what a Shooting Star means…
- When the market opens, the buyers took control and pushed price higher
- At the buying climax, huge selling pressure stepped in and pushed price lower
- The selling pressure is so strong that it closed below the opening price
In short, a Shooting Star is a bearish reversal candlestick pattern that shows rejection of higher prices.
And one last one…
Bearish Engulfing Pattern
A Bearish Engulfing Pattern is a (2-candle) bearish reversal candlestick pattern that forms after an advanced in price.
Here’s how to recognize it:
- The first candle has a bullish close
- The body of the second candle completely “covers” the body first candle (without taking into consideration the shadow)
- The second candle closes bearish
And this is what a Bearish Engulfing Pattern means…
- On the first candle, the buyers are in control as they closed higher for the period
- On the second candle, strong selling pressure stepped in and closed below the previous candle’s low — which tells you the sellers have won the battle for now
In essence, a Bearish Engulfing Pattern tells you the sellers have overwhelmed the buyers and are now in control.
Now…
What you’ve just learned are some of the most powerful reversal candlestick patterns.
But, they are not the only ones out there.
In fact, there are many variations that it’s impossible to cover all in one blog post.
But the good news is, you don’t need to memorize candlestick patterns to understand what the market is telling you.
Here’s how…
Candlestick patterns cheat sheet: How to understand any candlestick pattern without memorizing a single one
This is important, so pay attention…
#1: Trending Move
You’re probably wondering:
“What is a Trending Move?”
A Trending Move is the “longer” leg of the trend.
If the candles are large (in an uptrend), it signals strength as the buyers are in control.
If the candles are small, it signals weakness as the buyers are exhausted.
An example of a Trending Move:
#2: Retracement Move
A Retracement Move is the “shorter” leg of the trend.
If the candles are large, it signals the counter-trend pressure is increasing.
If the candles are small, it’s a healthy pullback and the trend is likely to resume itself.
An example of a Retracement Move:
#3: Swing Points
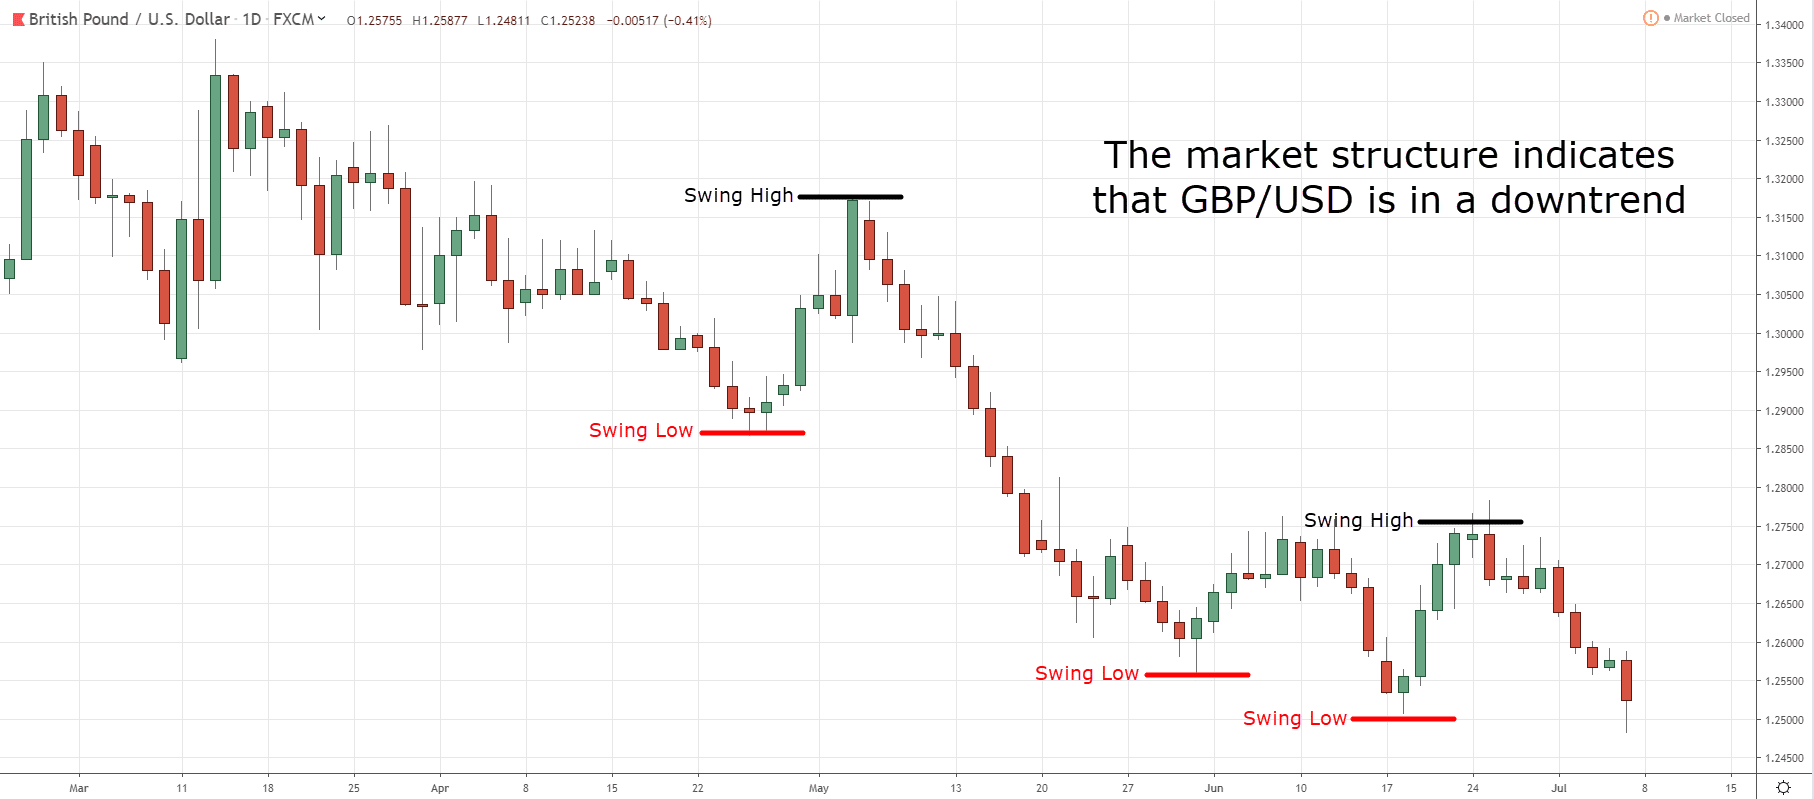
Swing Points refer to swing highs and lows — obvious “points” on the chart where the price reverses from.
Here’s an example:
This is important because it lets you know whether the market is in an uptrend, downtrend, or range.
As a guideline:
If the swing highs/lows move higher, then the market is in an uptrend
If the swing highs/lows move lower, then the market is in a downtrend
If the swing highs/lows are not moving higher or lower, then the market is in a range
Now if you want to see the discover the secrets to chart patterns, then click here to find out.
Next…
To understand any candlestick patterns, you only need to know 2 things…
- Where did the price close relative to the range?
- What’s the size of the pattern relative to the other candlestick patterns?
Let me explain…
1. Where did the price close relative to the range?
This question lets you know who’s in control momentarily.
Look at this candlestick pattern…
Let me ask you…
Who’s in control?
Well, the price closed the near highs of the range which tells you the buyers are in control.
Now, look at this candlestick pattern…
Who’s in control?
Although it’s a bullish candle the sellers are actually the ones in control.
Why?
Because the price closed near the lows of the range and it shows you rejection of higher prices.
So remember, if you want to know who’s in control, ask yourself…
Where did the price close relative to the range?
Next…
2. What’s the size of the pattern relative to the other candlestick patterns?
This question lets you know if there’s any strength (or conviction) behind the move.
What you want to do is compare the size of the current candle to the earlier candles.
If the current candle is much larger (like 2 times or more), it tells you there’s strength behind the move.
Here’s an example…
And if there’s no strength behind the move, the size of the current candle is about the same size as the earlier ones.
An example…
Does it make sense?
Great!
Now you have what it takes to read any candlestick pattern without memorizing a single one.
The M.A.E Trading Formula (A simple Price Action Trading system anyone can learn) or Price Action Trading Forex...
At this point:
You’ve learned the essentials of Price Action Trading (Support & Resistance, Market Structure and Candlestick Patterns).
Now, let’s use this knowledge to find high probability trading setups — consistently and profitably.
Introducing to you, The M.A.E Trading Formula, a proprietary trading technique I’ve developed to help traders get results, fast.
Here’s how it works…
- Market structure
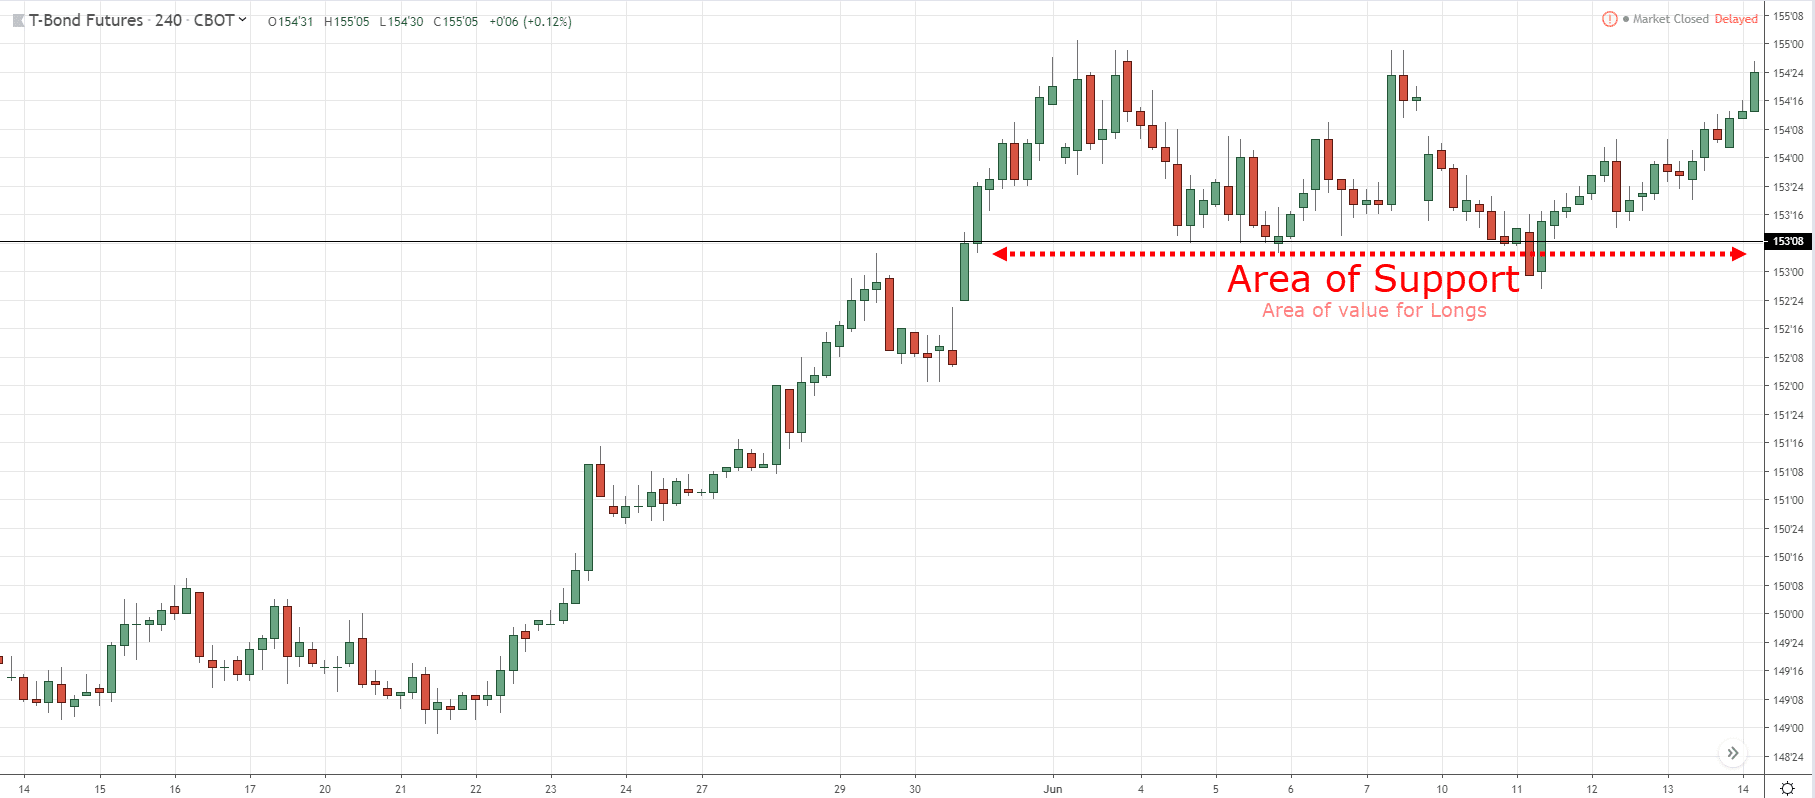
- Area of value
- Entry trigger
I’ll explain…
#1: Market structure
Now, I know it can be daunting to be looking at a blank chart.
Because you don’t know what to do.
Should you buy, sell, or stay out?
That’s why the first thing to do is identify the market structure as it tells you what to do.
So ask yourself:
“Is the market in an uptrend, downtrend, or range?”
(In other words, identify the current stage of the market.)
Once you can identify the market structure, then you’ll know trade along the path of least resistance.
For example:
If the market is in an uptrend, you look to buy only.
If the market is in a downtrend, you look to sell only.
If the market is in a range, you can buy and sell.
Next…
#2: Area of value
Now, identifying the market structure alone isn’t enough.
Because you also need to know where to enter your trade.
Now you’re wondering:
“There are so many places to enter a trade. Which one should I choose?”
Well, you want to trade from an area of value so you can buy low and sell high.
For example:
- Support and Resistance
- Respected Moving Average
- Trendline
Next…
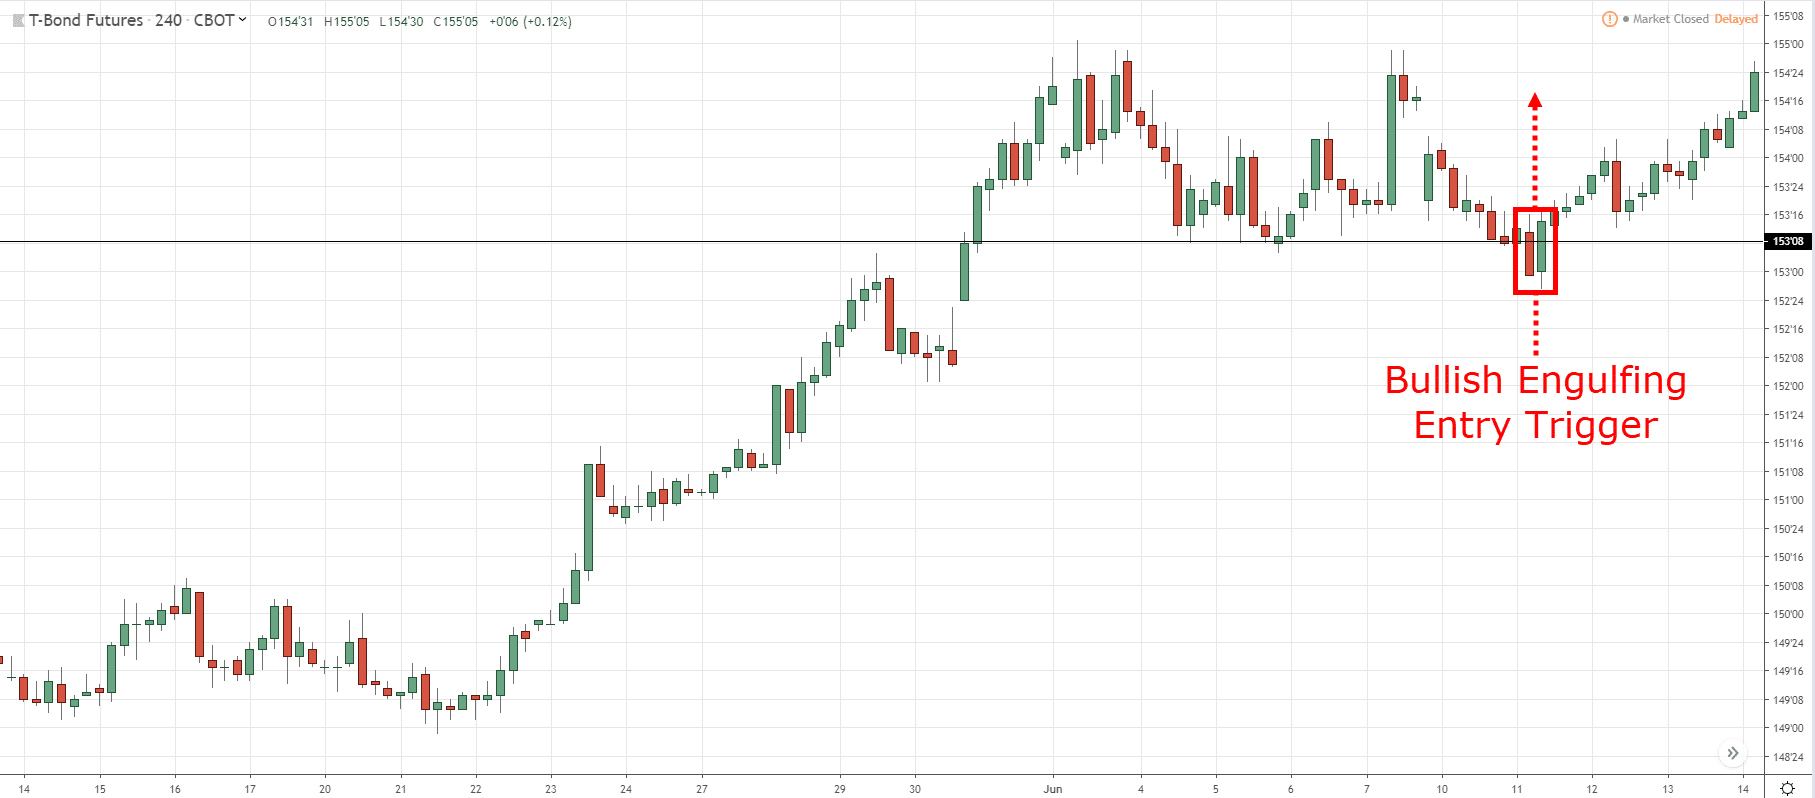
#3: Entry trigger
At this point:
You know what to do (identify market structure) and where to enter (area of value).
Now the final part of the equation is to know when to enter.
Personally, I like to enter when the market has shown signals of reversal — thus confirming my bias.
This can be in the form of reversal price patterns like:
- Hammer
- Shooting Star
- Bullish Engulfing Pattern
- Bearish Engulfing pattern
Let me share with you a few examples of The M.A.E Formula in action…
GBP/USD Daily: Identify the market structure
GBP/USD Daily: Wait for the price to reach an area of value
GBP/USD Daily: Enter on a valid entry trigger
Another example…
T-Bond 4-hour: Identify the market structure
T-Bond 4-hour: Wait for the price to approach an area of value
T-Bond 4-hour: Enter on a valid entry trigger
Can you see how everything fits together now?
So, what’s next?
You’ve just learned what price action trading is all about, and how you can use it and to get a “feel” for the markets including price action trading with Forex.
If you learn for instance, a Forex price action strategy well, it will improve your entries, exits and trade management.
Now… it’s time to put these techniques into practice.
The first step?
Click on the link below and download The Ultimate Guide to Price Action Trading.
You’ll get a beautiful PDF file that contains trading strategies and techniques I’ve shared with you (and additional content that I’ve no space to write here).







Aspiring traders and traders who want to be successful in trading, this information shared will make you consistence gains. This is better than what other coaches sell. Read this section and practice that’s all yu need to trade price action. Thank this man for sharing it for FREE. Well detailed price action trading. This is the same way I trade and have been for many years and it works in any market, it’s a skill for life trust me
Hi Joe,
Thank you for your kind words, I really appreciate it.
Glad to hear it’s been working well for you my friend.
Rayner
Thank You for such a clear easy reading and it is free who needs a mentor paying hundreds or even thousands of dollars. You are really a very generous Person Rayners
Have a ggod day and plenty of Pips
Aldo
Hi Aldo,
Thank you for your kind words, I’m glad to help.
Don’t hesitate to let me know if there’s anything, I’ll be glad to help.
Rayner
Hi Rayner,
This is one of your best posts so far, it will help both beginners and remind experienced traders.
Hey Ashley,
Thanks for dropping by, appreciate your feedback 🙂
Rayner
Hi Sir
thanks for completeness of great trading guideline
very much clear and easy to absorb.
Life good feel good
Enjoy n cheers
Hello Ramli,
You’re welcome, glad you found it useful.
Rayner
A very clear, simple and detailed explanation… if only this article was available when I first started trading! :-
Hey Jai,
Well, it’s better late than never, right?
Don’t hesitate to let me know if there’s anything, I’ll be glad to help.
Rayner
Hi Rayner,
Great Price action stuff for all level of traders. Thank you for this post.
Hi Ranjith,
Thank you for your feedback.
I hope to hear more from you in the near future.
Rayner
I have been trying to download the ultimate guide to price action I have put in my email many times and still it was not sent to me.
Hey Phelisa
Please drop me an email and I’ll send it over.
Hello Rayner , I really enjoy your lessons and have to admit that they have made me a better trader, however could you make a video on how to trade Nasdaq. There is lots of people talking about it
I’ll look into it, cheers.
Definitely one of your best posts Rayner. Lots of food for thought.
I have been trading for a couple of years but have only been following you for a few months. You talk a lot of sense and I love your direct upbeat attitude.
Like several of the other comments here I would also like to say a big thanks for the time and effort you put into your posts and videos.
Hello Houmous,
You’re welcome. I’m really glad it resonates with you.
Don’t hesitate to let me know if you’ve got any questions, I’ll be glad to help.
Rayner
I always enjoy reading your articles. As a beginner in trading i get confused a lot of times, but you have a way of making things clear and down to earth. For me it’s very valuable what you share and i thank you for that.
Hi Cornelis,
Thank you for your feedback. I’m glad you found it useful.
Don’t hesitate to let me know if you’ve got any questions, I’ll be glad to help.
Rayner
Hello!
I am new to the market and after three weeks of daily consistent losses, I came by this website and now I feel pretty confident about the next week
Thank you for the information you provide
Hi Taimur,
I’m glad it made a difference for you.
Keep me updated on how you’re doing, I’ll be glad to help.
Rayner
Great post Rayner and I really like the PDF guide. That’s a great way of being able to easily resource the information in this post. I really found the part on volatility expansion and contraction interesting. It’s something I often look for myself when studying the charts.
I don’t actually use candles myself, only a HLC bar, but… If I see the closes clustering in a tight range there’s a good chance there will be a good break one way or the other. So it gives you a good heads up on what’s coming.
Many thanks for some great insights there that I hadn’t seen before. That’s the beauty of trading the markets. Even after having done it for over 20 years myself there is still always something new to learn.
Many thanks!!
Hi Peter,
Thank you for your feedback. I’m glad it’s of use to you.
I agree, there’s always something to learn each time from the markets.
Hope the course is going well on your side, my friend 🙂
Rayner
Words fail to describe how thankful I am. Keep it up Rayner, really appreciating the free nuggets you been giving. Ever since I tried your strategy in Nov 2015. My losses were well, little compared to all the account I blowed up before. This is probably the longest time my real account have ever withstand! Although I am at -9% I am optimistic that by following all the principles of trend following, I am waiting patiently for that day just like how your trade with USDJPY.
Anyway just asking, during a high-impact news (like yesterday FOMC) about stops. Do you modify your stops? or leave it as it is? Also, what is your counter measure for events like the interest rates? Would love to hear about that. Thanks once again.
Hi Othniel,
I’m really glad to hear it’s starting to work out for you. Keep up the positivity on your side!
For high impact news, I usually would be on the sides as I’ll get few setups during this period.
But if I’m already in a trade, I’ll leave the stop loss at its original intention.
I don’t have any countermeasures as the stop loss is in place. So it’s either I get stopped out, or price moves really in my favor.
Rayner
hi bro.if im trading 1h timeframe my higher timeframe will b 4h n can b daily ?
Hi Rayner,
Thank you for your time and effort to share your trading experiences. Your info & books are free.
I have attended paid courses but were not as informative as yours. I am lucky to find your blog.
You are doing a very kind act. Rejoice !
Cheers !
david.S
Hey David,
Thank you for your feedback, I’m really glad to hear that!
Don’t hesitate to let me know if you’ve got any questions, I’ll be glad to help.
Rayner
Dear Rayner,
What I have to write here after all above me… just wish you a blessing always on your side 🙂
Shlomi
Hey Shlomi,
Thank you for your constant support. Truly appreciate it buddy!
Rayner
Hi Rayner
I regularly watch your weekly videos which are highly educative. This guide is excellent and of great value. I have a small query. When we use inside bar strategy as mentioned on page 52 of your pdf book, you said we should place sell stop order below the previous bar. My question: should we place this order below the “low” of previous bar or below the “close” of previous bar?
Your clarification will be greatly appreciated..
Thanks a lot
Hi RDP,
I was referring to the low of the bar.
Hope that clears up 🙂
Rayner
Hello Rayner,
I have read your law of averages concept. It was interesting.
Could you please let me know as a fulltime trader, how many currency pairs( scrips) we will be looking for and how many trades will be taken on a monthly basis. AS you said, one edge / strategy needs time to work. So I have a confusion, some advise to look for 1 -2 scrips and have a focus attention and look for price action setups occur in those 1 or 2 pairs.
But for law of averages to work, we need more pairs and look for these price action patterns. Pls clarify?
Hi Deepak,
This depends on your trading approach.
For day traders, they could focus on a few pairs and have plenty of trading setups by adopting different trading strategies for different market conditions.
For position traders, we will look at more markets and get more trading setups.
Rayner
hi Raynor,
why the hell r u being so generous….in our country poeople even if they a price for this knowledge r given same chicken shit they gave 20 yrs ago….GOD BLESS YOU..
Hi Dev,
Thanks for stopping by.
My way of giving back is sharing my trading knowledge to the world.
Rayner
Really awesome and beautiful peace of work, thanks a lot
Awesome to hear that Faisal, cheers
I have just come across your site and BANG! …I get it. But putting it into practice will be a different thing. Definitely a good base to start from though. Let’s hope this can stop my bleeding money from my account!
I shall come back for more 🙂
Thank you!
Hey GW
Glad to have you on board!
Halo Reyner. Thank you for all the concentrated effort you put in for us. I appreciate it sincerely. Best regards. Harry West ( South Africa)
Hi Hermanus,
Thank you for reaching out. I’m glad to be of help 🙂
Hi, Rayner you are KING
Cheers Thami
Dr Radnor
what a fantastic article
alot of effort
thank you my friend
mark
Cheers Mark
I have been blowing my account for quite some time now, but with this kind of information shared by the man i wish to call CAPTAIN, im feeling confident for the first time in my trading carreer…thanks Rayner, you are indeed a man I will recommend to my fellow countrymen as trading is something new in my country- Lesotho.
I appreciate it bud!
this is very informative one mate thanks
cheers George
I’m glad that i found this on the net,It was so hard at first but still trying to learn and i believe this kinda tuts would bring me shine after a couple of lost.Thank You Ray..
I’m happy to hear that, Eddie!
Ray,I was a bit confusing about the SNR,In the area of support/resistance for example should i place the line at the closing price of the candle or its wick?And about the ‘pin bar’,If the candle turns to be a bear which is RED but it form a bullish pin bar,does it still count as a bullish pin bar?same goes to bearish.
Thank You
Hey Eddie
For SR, I try to draw it to get as many touches as possible (and that includes, body and wicks).
As for pinbar, you should pay attention to the wick relative to the body. The color of it doesn’t matter as much.
Hi ray!
I thank you for your responds,It was greatly i have learn a lot of things from your blog.About the SR,wasn’t that makes u confused if too many lines u have place in the chart?Well i will train again to make my trades goes perfect with the demo.But one thing more that i am confusing about the PRICE ACTION,i don’t really understand.Is it about the movement of the price where its heading?up and down?long wicks?rejection?Is that what all about the price action?
Thanks again.
Hey Eddie
There’s a lot of information about price action out there. But to me, price action is reading the market structure (whether it’s trending, range and etc), identify SR areas, having a valid entry trigger to enter the trade, and knowing how to manage the trade.
Thank you Rayner for your boundless generosity – you’re a true hero and ”Superman” in every sense of the word!
I appreciate the kind words, Angela 🙂
Hi Rayner,
I have spents thousands of Pounds on trading education and I have been trading for about a year, I was not making any progress then I decided to take a break and educate my self I would like to express my gratitude for sharing your trading strategies…..it is easy to understand it is straight forward not complicated ……real price action……You are a great inspiration to many novice traders….Thank you
Hey Gabe
I’m glad to hear that!
Don’t hesitate to let me know if you’ve got any questions, I’ll be glad to help.
thanks a lot Rayner for such a great post i would believe anyone who follows what you write will be profitable trader u surely are a superman
I appreciate the kind words, Hardman!
Hello Rayner,
It is really a nice Technical Analysis Website and more than that the way you explain the things is really awesome. Keep it Up Buddy.
You are a “SUPERMAN” same as you wear the T-shirt.
Thank you, Shailesh. I appreciate it!
Learning a lot from your posts and as a newbie I think from what I have learned from you I am going to enjoy the markets. Thank Teo for the priceless information you are just giving away. So are making a killing from useless strategies but you are just taking everyone on board for free. My you be blessed and continue to share your valuable knowledge with us. Trading is still in its in my country Zim such that you rarely find mentors, and thank for being one to many of us .
You’re welcome, Edzai.
Glad to be of help!
Can’t we say that a failed false breakout is a breakout ?
Yup you can, but why complicate matters.
High quality content as the majority of your posts! Thank you very much for taking the time to share your skills and help others.
The pleasure is mine bud!
Nice and in-depth walk-through, you covered a lot here! 🙂
I’m happy to hear that!
Learned a lot from this post. Please continue to give free content. Thank you very much 🙂
You are a blessing , sir Rayner! Thank you so much! Best regards from here in the Philippines.
You’re welcome!
Hi Rayner,
Thank you for your generous sharing! It is going to take me a while to absorb all the golden nuggets here. How can we tell if the consolidation after a price move up is accumulation or distribution? Is there any way to tell before the price break down or break out?
Thanks!
Hey Kareen
There’s no way to tell for sure that’s why you have stops in place.
cheers
Hi Rayner,
I am following your website from last 20 days or so..Must say your style of imparting the knowledge has been very useful for me. I could learn a lot from your videos.
I want to know whether one need to keep the overall market in mind before getting long or short in a Stock.
For Eg:- Expecting Overall Nifty/Sensex to be bullish tomm. I have 2 stocks Vedanta & ICICI Bank which looks bearish to me. Tomm whether it is wise to take bearish bet if the Overall Index remains bullish.
Request Clarity.
Regards
Nasir
Yes, that’s a good technique to follow the bias from the main index.
mr. rayner, thank you for your insightful and great knowledge that you share to the many newbie trader like me, i have been blow out my account many times and still studying price action, and i come across your website. the candlestick pattern is eye opener for me, thanm you sir
Welcome Rio!
Looks like this scammer forgot to take your name of your work before directly copy and pasting as his own
https://www.campforex.com/wp-content/uploads/2018/04/edited_The-ultimate-guide-to-price-action-trading-1-ilovepdf-compressed.pdf
Hah, seems like it.
thank you rayner for the wonderful blog youve made. its very helpful to me.
You’re welcome!
Truly big help for us trader. Thank you Mr. Rayner for sharing your technical knowhow.
You’re one of the few people in the world of trading that really inspire fellow traders.
A mark of a true unselfish educator and trader. Cheers.
Thank you, Albert.
Thank you Rayner for this wonderful and educational post! Very helpful!
Awesome to hear that!
Thanks
cheers
Thank you Rayner this was a brilliant lesson on Price Action trading and I am most grateful to you.
Thank you very much for sush a detail illustrations provide by you. I have learn good strategy to make profits and reduce losses. Thanks again.
Awesome to hear that, Dipvan!
Hi! Rayner,
It’s really nice knowing someone like you sharing such a very detailed info regarding trading.
Really appreciate this one!! Thank you very much!!
The pleasure is mine, Adiang.
Cheers
Ryner
I am learning so much from you and its very helpfull thank you so much
You’re welcome!
Hii
Rayner
You are a great teacher
Where i am from people will charge us 1000$ for less information.
Sir you are a god sender .
Can you teach us about events sir
What kind of events, you mean news?
Dear Ray, I’ve been wondering why you decided to make your academy free (no fee)? The curriculum contents worth thousands of dollars and yet you gave them all out for FREE. Just to let you know that you are the BEST of your kinds !!! God bless you, Rayner…Indeed you’re saving the world..LOVE FROM NIGERIA.TOYIN
You’re welcome, Toyin!
Just doing my part to give back to this amazing world. cheers.
nice my teacher. thank you
Cheers
Rayner, please I face difficulties downloading the book. When I entered my email and click on the*send me the book now* it takes me to same page. Please help me out.
Drop me an email and I’ll send it over.
Which broker do you
I don’t publicly discuss brokers because in this day and age, we have no idea what goes on behind the scenes.
If you want a recommendation, drop me an email me and we can discuss it.
hy Rayner
Thank you very much for your knowledge…
You’re welcome!
Hey Rayner, thanks for all your posts all great usefull material without nonsens! I’m trading for 5 years now also trendfollower with stocks and option strategies . You usually talk about trading on trends , but what do you do when the market changes from trending to a non-directional type of market? I personally have a hard time trading these markets , do you have a take on this or perhaps a suggestion? Thanks a lot!!
Hey Pieter
I ride out the drawdown.
Alternatively, you can also trade strategies with no correlation to trend following to smoothen out your equity curve.
Thanks a lot Rayner you are really a blessing to me your trading lessons have improved my understanding in trade thanks a lot once again may God bless you
Awesome to hear that, Frank!
Thanks,very good to newbie in forex like me,i always read your web…
Cheers
Very2….helpfull to me as newbie in forex,i like trading no indicator just look at price moving…trend..pinbar…inside and others…thanks master ray…i always read your web.
Thank you for your interest, Rasyid!
Good day rayner..I’m very grateful for your support and help in making us a better trader. I truly appreciate it. Keep up the work .
My pleasure!
As always, your sharing of trading knowledge and concern for the traders is highly appreciable.Yours is simplfied price action course for all levels.Your way of presentation is within the reach of any type of trader.God bless for your gift to us.
Thank you for your kind words!
I have read few books and seen quite a few videos..But I must confess that None has Enlightened me with trading knowledge as U Rayner….StayBlessed✋
Nice article though i cant rely on price action alone.. Can you please write an article about rsi trading…advance one like divergence trading…also how can i know that trend is about to reverse so as i can exit my position or enter..
thanks Rayner
Hey Rayner, do these guidelines apply in a bear market or bull market?
The concepts can be applied the same.
Rayner you are the best teacher
Cheers
Its valuable , thanks for your knowledge sharing and kindness.
You’re welcome!
Very insightful and resourceful content, thanks
My pleasure!
Rayner thanks for taking your time to put something great like this , Im a newbie in trading US Stock , based on your own opinion, what time frame would you suggest, is it daily or 4 hr and so on , thanks in anticipation
You can look at the daily timeframe for starters.
Rayner this methodology is almost the same with gapping system pls put more light to explain about different b/w gab and this ur method Thanks
Hi Rayner. Thank you very much for sharing your knowledge, skills and talent in trading.. I am just in about a year in trading forex and still learning new strategies and techniques to say that i am progressing.
I would like to ask a few questions and I hope you do not mind answering and hopefully you can give more insights and advise.
1. I notice in your examples you use 1day chart. So if for example i look for area of value/true S&R, this would cover almost two yrs. atleast in how far I get data..
What could be the significance or strong probability to look further back if we are trading daily chart compared to trade in H1/ H4 or lower TF?
2. If i am not mistaken you prefer to trade as swing trader rather than in lower TF. If that is the case atleast on average how many trades do you take in a month? Is trading in lower TF not that profitable or shall i say not giving much risk reward ratio?
3. How often and what particular time of the day do you recommend to trade if you want to get more positive result?
Again thank you for your time and i look forward or your response.. God bless.
Thank u Rayner,u are the best teacher ever,u really changed my life.
The best article for price action strategies i have come across.Thanks.
My pleasure!
Very nice article bro, appreciate all your efforts you take to make all understand how market works with beautiful examples and wonderful explanation, great work bro.
God Bless You & Give You All That You Deserve. Lots of Love-Peter From India
Cheers Peter
Thank you Rayner for very informative article. I am learning a lot from you. You are the only trader that I understand when explaining about trading strategies. I am very glad that I bumped into your YouTube channel. More and more blessings to you.
Cheers Joan
Hi.Rayner. I am grateful to your forex education expo. I have been a subscriber to your YouTube videos and I have gained a lot from it. I noticed for sometime that I have been trading on demo,as I make money I have been losing as well.what could be the problem?
Hi Rayner,
Im glad to find your web today, Im looking for Price Action Trading Strategy to improve my knowledge and sharpen my analyzing on chart.
Well, finally i find a good mentor, that is You. it is not because you give it FREE to us but what you have posted in this web and youtube channel is very value and helping me so much to understand the strategy.
Wishing you always health and success.
Regards,
Junaidy – Batam
Glad to hear that, Junaidy!
And thank you for your kind words 🙂
Rayner, you the best, i read many of your note and they are very good. However, I want to know if you are in Whatsap so that you can share your signals with us as well. Atleast one trade in a week is enough for me.
rayner is just the boss!
I’m a beginner, which strategy can I start with.
Thanks for sharing knowledge, nice explanation!!
You’re welcome!
Great explanation with systematic flow of information to make the reader feel the logic of every step coming after another in a harmony of knowledge stream. Thanks Rayner.
You’re welcome!
Thank you Rayner Teo, you are a great teacher and supporter of beginners of trading community. It is a great self less service. God bless you. Wish you a very happy new year 2020. Maruthi
Thank you, Maruthi. And same to you!
I’m short of words..this is just amazing..You are heavenly sent!!!keep it up and thank u
Thank you, Panashe!
Ryan,you are great man,God bless you.
Cheers
why you did not mention anything about the volume of trades, and the impact on the trade. I have no doubt there is cue of traders waiting to buy and sell, they are the ones the move the market up or down.
So so helpful but I am still waiting for my email.
Great lesson! Thanks a lot!
My pleasure!
I am enjoying your valued experiences in trading
Cheers
Why the Free book is not dowenlode sir??
You can download easily.
how much time i must hold a trade.
and please tell me about MEA strategy in more detail with example.
i already follow you on youtube if there is video please give link.
thanks
Brilliant analysis!!! You have provided foundation for action. Appreciate.
You’re most welcome!
Thanks Rayner,it’s very helpfull..
GBU..from Indonesia
Hi Rasyid,
Thank you!
Thank you so much
Hi Nguyen,
You are most welcome!
Thank you sir!!!! We appreciate all the free material and it has really improved my price action trading 🙂
Hi Kevin,
You are most welcome!
Rayner I really appreciate your openness to teach us the babies what price action is all about and how to apply it but my question is must I use all this strategy all the time to be a successful trade or can just one work for me , because too many strategy and methodology get one confuse ,please which price action strategy and methodology is ok to use than all those
Hi Roland,
You need to find an edge to what works for you!
Check out this post…
https://www.tradingwithrayner.com/profitable-trader/
hello Rayner!
Your guide helps me a lot in learning price action, how simply u made this guide bro, anyone can learn it very easily,
many paid coaches out here but I think they can’t teach us in a very simple & practical way like yours.
Your are true mentor Rayner! Thanks alot
Your student Sanjeev from india
Lots of Love bro.
Hi Sanjeev,
I’m so glad to hear that!
Thank you!
Sir I thank you so much for this great eye opening lecture on price action.
Help me on how to read my atr indicator.
May grace to You Sir.
Hi Atodo,
It’s my pleasure…
Cheers.
You good sir. I have been understanding forexmarket through you . Thanks
Hi Umeh,
I’m so glad to hear that!
Cheers.
This is such valuable information for anybody who wishes to become a successful trader and without paying a cent. Thank you so much, Rayner.
Hi George,
Thank you!
Hello Rayner, Thank you for all the resources, it is helping me become a better trader, I didnt get the PDF, Plz can you send to my email… xerozbaba@gmail.com
Hi Fammie,
You can check your email
Cheers
Valuable content about price action trading withoutcharging any fee and provided free great sir
Hi Mallikarjun,
You are most welcome!
please send me the book
mah2018@gmail.com
Hi Mo,
Check your email.
Cheers.
Thank you bro you are the best
The best.. Tks sir
You are welcome Mhosni.
Thanks rayner sir…
Please send me the book >>
sakxal@hotmail.com
Excellant presentation.Thanks.
You are welcome, Ranjan!
[…] Click here […]
Basic but useful, especially as I’m not succeeding
Thank you for giving your knowledge, Master. Let me take the teaching .. price action Let’s try trading first. I wish you happiness. Get richer in Forex trading
You are most welcome!
Good
You are welcome, Prabhakaran!
send me this book on
vipulpatil.vp.156@gmail.com
[…] The Price Action Trading Strategy Guide […]
Great book…….help àlot
Thank you, Macaulay!
I found you at first on youtube after I got back into my worst trading experience.
And these few days , I always think about myself :
why I trade so fking bad ?
why other can be trader and trades it as life and being better ?
And I so thanksful what Rayner you share that resolve or confirm my doubt being solved.. !
Hi, Codinlover!
You’re very welcome. Rayner is really glad to be of help.
If you wanna learn more, you can follow us on our youtube so you will be updated on our posts that might help you in the future.
Here is our link: http://www.youtube.com/user/tradingwithrayner
Cheers!
Hey Ray,
The content is very usefull. . . . . These are the real laws of any market. Thanks for it mate. . . .
Cheers
Sharad Paraskar
Hey there, Sharad!
Glad you find Rayner’s Blog useful!
Cheers!
hi Rayner, have watched a couple of your YT videos – thanks for creating such great content! may i ask how i can download The Ultimate Guide to Price Action Trading? i don’t see any download button/link. thanks in advance!
Hey there, Jc!
Please Email us at support@tradingwithrayner.com so I can send you the Ultimate Guide to Price Action Trading.
Cheers!
Thanks for this great work
You are most welcome, Taiwo!
I appreciate the learning very much
Great to hear that, Christinah.
Cheers!
After watching your video on YouTube a few years ago I knew I’ve met a pro, and I’ve watched it over and again.
This piece I browsed up in google got me engrossed again only to discover it’s the same guy. Many thanks.
Chidike, Nigeria.
You are most welcome, Chidike!
This is really nice and timeless. I just learned this strategy from you this year. Amazing content! By the way, do you provide any tips or strategy to trade in a range market, Rayner? Thanks a lot!
Hi, Chaichan!
Glad to hear that! Check out the article below on how to trade sideways market:
https://www.tradingwithrayner.com/trading-sideways/
Hope this helps!
Thanks to trading with Rayner .com since when I discovered he my trading experience has change and I can get more win trades than loss trades.
Happy to hear that, Andem!
More wins to come.
Cheers!
Thank you, Rayner for writting up this wonderful trading guide on price action. I have learned alot from it and now I feel I am in position to put into action what I have learned from this guide. Thank you for your time and effort.
Happy to hear that, Iso!
Hi:
I’ve got the book. 3/4ths of the way read. I can’t get access to the “bonus” sections. Link doesn’t work and it’s not in the “junk “email”.
Please advise
Hi, Bill!
Jarin here from Tradingwithrayner Support Team.
Please contact us at support@tradingwithrayner.com so we can assist you with it. Thanks!
Cheers!