Here’s the thing:
There are many ways to read a chart.
You can use Japanese Candlestick Patterns, Renko, Bar, Line, Heikin Ashi, Point & Figure, and etc.
You’re probably wondering:
“Which one should I use?”
Well…
If you ask me, the most popular approach especially to candlestick trading is…
Candlestick Patterns.
Why?
Because it’s easy to learn — and it works.
That’s why I’ve created this monster guide to teach you everything you need to know to learning all candlestick patterns (and how to trade it like a pro).
Here’s what you’ll learn:
- What is a candlestick pattern and how to read it correctly
- Bullish reversal candlestick patterns
- How to find high probability bullish reversal setups
- Bearish reversal candlestick patterns
- How to find high probability bearish reversal setups
- Indecision candlestick patterns
- Trend continuation candlestick patterns
- How to find high probability trend continuation setups
- Candlestick cheat sheet: How to understand any candlestick pattern without memorizing a single one
Now…
This is an extensive guide on candlestick patterns (with 3781 words).
So, take your time to digest the materials and come back to it whenever you need a refresher.
Now let’s begin!
What is a candlestick pattern?
Japanese candlestick patterns originated from a Japanese rice trader called, Munehisa Homma during the 1700s.
Almost 300 years later:
It was introduced to the western world by Steve Nison, in his book called, Japanese Candlestick Charting Techniques.
Now, it’s likely the original ideas have been modified which now results in the candlestick patterns you use today.
Anyway, that’s the brief history behind all candlestick patterns you see.
Moving on…
Let’s learn how to read a candlestick chart…
So, how do you read a Japanese candlestick chart?
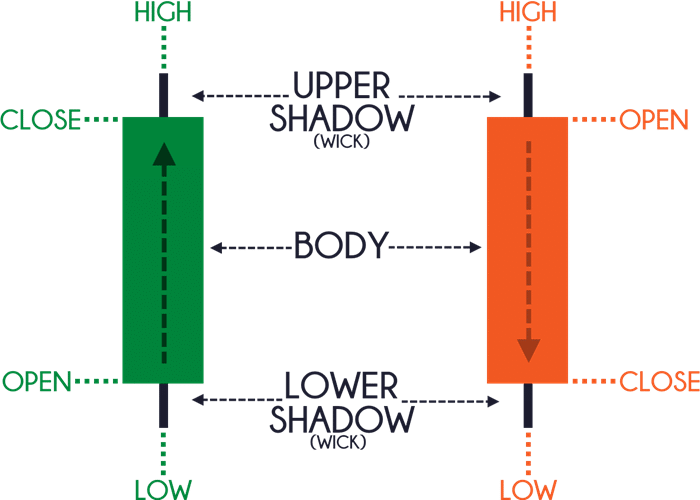
Now, every candlestick pattern has 4 data points:
Open – The opening price
High – The highest price over a fixed time period
Low – The lowest price over a fixed time period
Close – The closing price
Here’s what I mean:
Remember…
For Bullish candlestick patterns, the open is always BELOW the close.
For Bearish candlestick patterns, the open is always ABOVE the close.
Bullish reversal candlestick patterns
Bullish reversal candlestick patterns signify that buyers are momentarily in control.
However, it doesn’t mean you should go long immediately when you spot such a pattern because it doesn’t offer you an “edge” in the markets.
Instead, you want to combine candlestick patterns with other tools so you can find a high probability trading setup (more on that later).
For now, these are 5 bullish reversal candlestick patterns you should know:
- Hammer
- Bullish Engulfing Pattern
- Piercing Pattern
- Tweezer Bottom
- Morning Star
Let me explain…
Hammer
A Hammer is a (1- candle) bullish reversal pattern that forms after a decline in price.
Here’s how to recognize it:
- Little to no upper shadow
- The price closes at the top ¼ of the range
- The lower shadow is about 2 or 3 times the length of the body
And this is what a Hammer means…
- When the market opens, the sellers took control and pushed price lower
- At the selling climax, huge buying pressure stepped in and pushed price higher
- The buying pressure is so strong that it closed above the opening price
In short, a hammer is a bullish reversal candlestick pattern that shows rejection of lower prices.
Now, just because you see a Hammer doesn’t mean the trend will reverse immediately.
You’ll need more “confirmation” to increase the odds of the trade working out and I’ll cover that in details later.
Moving on…
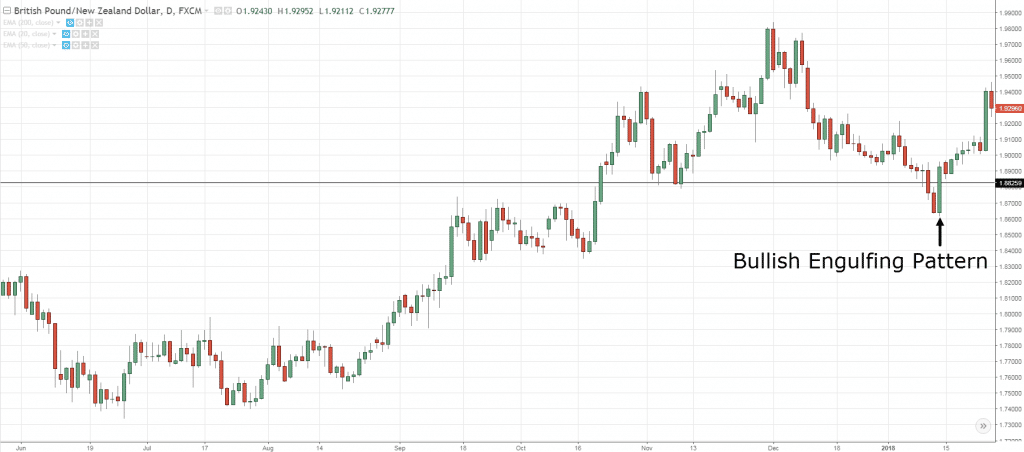
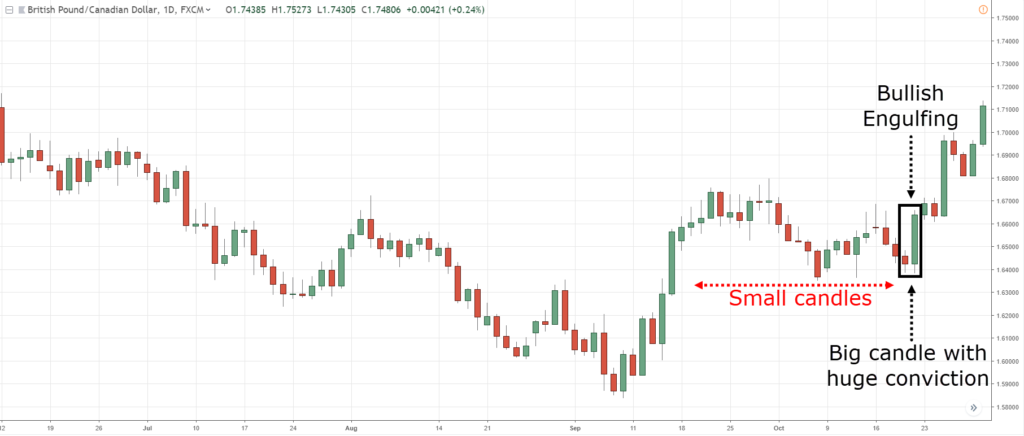
Bullish Engulfing Pattern
A Bullish Engulfing Pattern is a (2-candle) bullish reversal candlestick pattern that forms after a decline in price.
Here’s how to recognize it:
- The first candle has a bearish close
- The body of the second candle completely “covers” the body first candle (without taking into consideration the shadow)
- The second candle closes bullish
And this is what a Bullish Engulfing Pattern means…
- On the first candle, the sellers are in control as they closed lower for the period
- On the second candle, strong buying pressure stepped in and closed above the previous candle’s high — which tells you the buyers have won the battle for now
In essence, a Bullish Engulfing Pattern tells you the buyers have overwhelmed the sellers and are now in control.
And lastly, a Hammer is usually a Bullish Engulfing Pattern on the lower timeframe because of the way candlesticks are formed on multiple timeframes.
This is pretty much one of the many bullish candlestick patterns you'll learn into today's guide.
If you’re not sure how it works, then go watch this video below…
Next…
Piercing Pattern
A Piercing Pattern is a (2-candle) reversal candlestick pattern that forms after a decline in price.
Unlike the Bullish Engulfing Pattern which closes above the previous open, the Piercing Pattern closes within the body of the previous candle.
Thus in terms of strength, the Piercing Pattern isn’t as strong as the Bullish Engulfing pattern.
Here’s how to recognize it:
- The first candle has a bearish close
- The body of the second candle closes beyond the halfway mark of the first candle
- The second candle closes bullish
And this is what a Piercing Pattern means…
- On the first candle, the sellers are in control as they closed lower for the period
- On the second candle, buying pressure stepped in and it closed bullishly (more than 50% of the previous body) — which tells you there are buying pressure around
So, this is one of the bullish candlestick patterns that are less-known, yet can be effective if used properly.
Next…
Tweezer Bottom
When I mean Tweezer, I don’t mean the tool you use to pick your nose hair (although it sure looks like it). Instead…
A Tweezer Bottom is a (2-candle) reversal candlestick pattern that occurs after a decline in price.
Here’s how to recognize it:
- The first candle shows rejection of lower prices
- The second candle re-tests the low of the previous candle and closes higher
And this is what a Tweezer Bottom means…
- On the first candle, the sellers pushed price lower and were met with some buying pressure
- On the second candle, the sellers again tried to push price lower but failed, and was finally overwhelmed by strong buying pressure
In short, a Tweezer Bottom tells you the market has difficulty trading lower (after two attempts) and it’s likely to head higher.
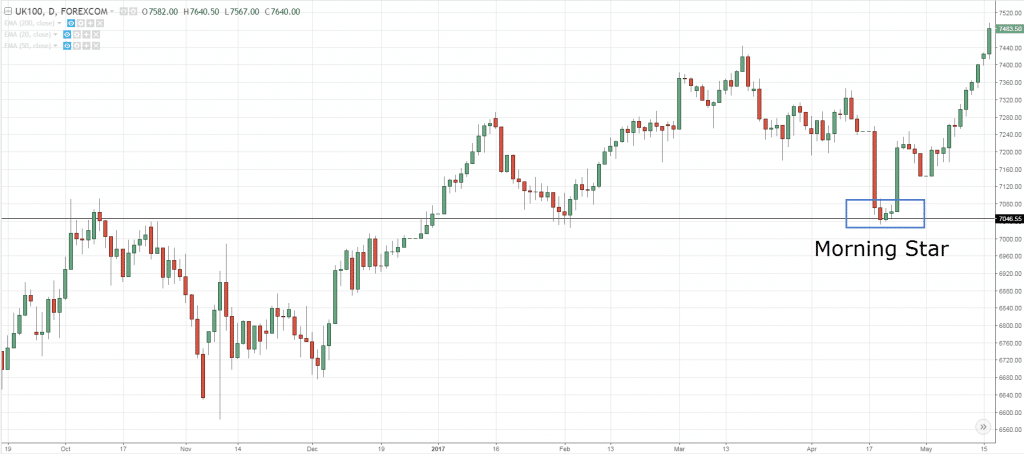
Morning Star
A Morning Star is a (3-candle) bullish reversal candlestick pattern that forms after a decline in price.
Here’s how to recognize it:
- The first candle has a bearish close
- The second candle has a small range
- The third candle closes aggressively higher (more than 50% of the first candle)
And this is what a Morning Star means…
- On the first candle shows, the sellers are in control as the price closes lower
- On the second candle, there is indecision in the markets as both the selling and buying pressure are in equilibrium (that’s why the range of the candle is small)
- On the third candle, the buyers won the battle and the price closes higher
In short, a Morning Star tells you the sellers are exhausted and the buyers are momentarily in control.
Moving on…
How to find high probability bullish reversal setups
Great!
You’ve learned the different bullish reversal candlestick patterns.
Now, let’s take it a step further and learn how to identify high probability trading setups with it.
Recall:
You don’t want to trade any candlestick patterns in isolation because it doesn’t offer an “edge” in the markets.
So here’s how you do it…
- If the market is trending higher, then wait for a pullback towards Support
- If the price makes a pullback towards Support, then wait for a bullish reversal candlestick pattern
- If there’s a bullish reversal candlestick pattern, then make sure the size of it is larger than the earlier candles (signalling strong rejection)
Here are a few cherry-picked examples:
Morning Star:
Bullish Engulfing Pattern:
Bullish Engulfing Pattern:
Note: There will be losing trades as well and this is not the “holy grail”.
Now, let’s move on…
Bearish reversal candlestick patterns
Bearish reversal candlestick patterns signify that sellers are momentarily in control.
Likewise, it doesn’t mean you should go short immediately when you spot such a pattern because it doesn’t offer you an “edge” in the markets.
Instead, you want to combine candlestick patterns with other tools so you can find a high probability trading setup.
For now, these are 5 bearish reversal candlestick patterns you should know:
- Shooting Star
- Bearish Engulfing Pattern
- Dark Cloud Cover
- Tweezer Top
- Evening Star
Let me explain…
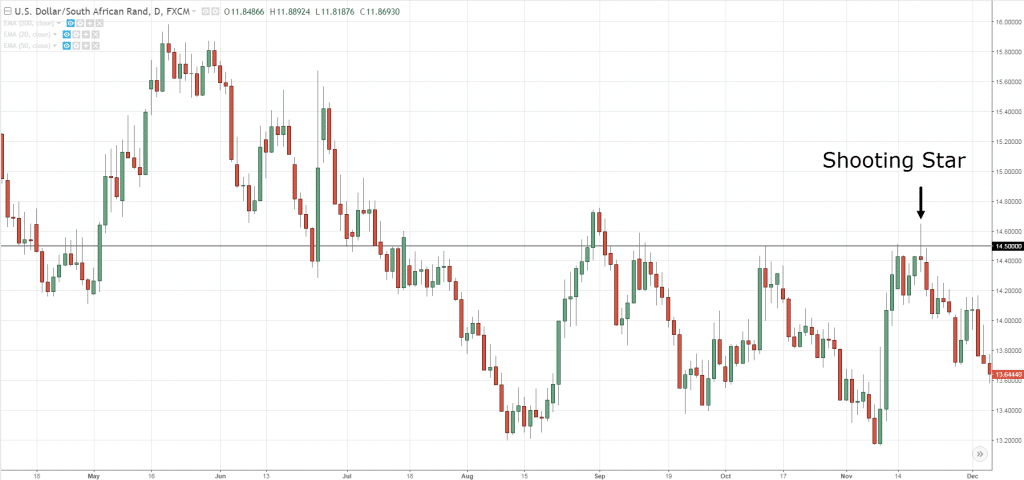
Shooting Star
A Shooting Star is a (1- candle) bearish reversal pattern that forms after an advanced in price.
Here’s how to recognize it:
- Little to no lower shadow
- The price closes at the bottom ¼ of the range
- The upper shadow is about 2 or 3 times the length of the body
And this is what a Shooting Star means…
- When the market opens, the buyers took control and pushed price higher
- At the buying climax, huge selling pressure stepped in and pushed price lower
- The selling pressure is so strong that it closed below the opening price
In short, a Shooting Star is a bearish reversal candlestick pattern that shows rejection of higher prices.
It's probably the most famous bearish candlestick patterns out there.
Now, just because you see a Shooting Star doesn’t mean the trend will reverse immediately.
You’ll need more “confirmation” to increase the odds of the trade working out and I’ll cover that in details later.
Moving on…
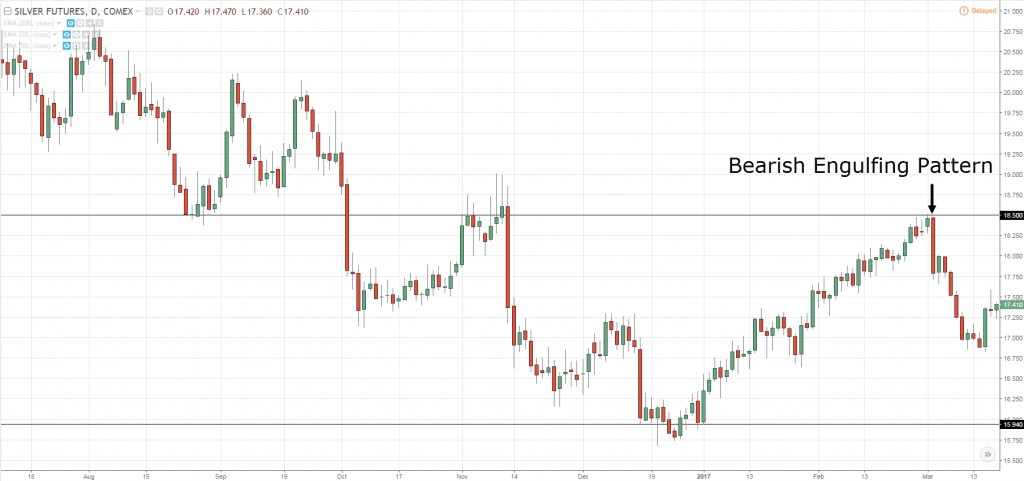
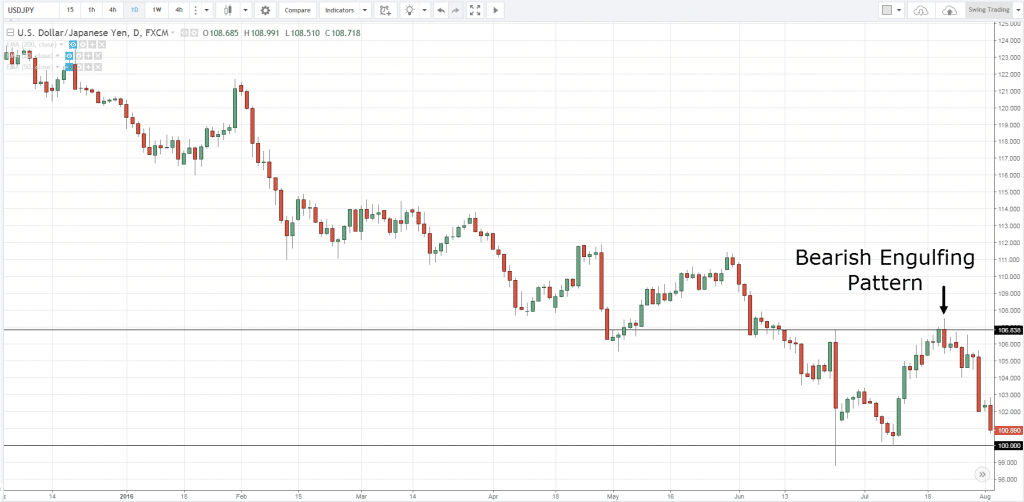
Bearish Engulfing Pattern
A Bearish Engulfing Pattern is a (2-candle) bearish reversal candlestick pattern that forms after an advanced in price.
Here’s how to recognize it:
- The first candle has a bullish close
- The body of the second candle completely “covers” the body first candle (without taking into consideration the shadow)
- The second candle closes bearish
And this is what a Bearish Engulfing Pattern means:
- On the first candle, the buyers are in control as they closed higher for the period
- On the second candle, strong selling pressure stepped in and closed below the previous candle’s low — which tells you the sellers have won the battle for now
In essence, a Bearish Engulfing Pattern tells you the sellers have overwhelmed the buyers and are now in control.
Dark Cloud Cover
A Dark Cloud Cover is a (2-candle) reversal candlestick pattern that forms after an advanced in price.
Unlike the Bearish Engulfing Pattern which closes below the previous open, the Dark Cloud Cover closes within the body of the previous candle.
Thus in terms of strength, the Dark Cloud Cover isn’t as strong as the Bearish Engulfing pattern.
Here’s how to recognize it:
- The first candle has a bullish close
- The body of the second candle closes beyond the halfway mark of the first candle
- The second candle closes bearish
And this is what a Dark Cloud Cover means…
- On the first candle, the buyers are in control as they closed higher for the period
- On the second candle, selling pressure stepped in and it closed bearishly (more than 50% of the previous body) — which tells you there are selling pressure around
Again, similar to the piercing pattern...
A dark cloud cover isn't the most popular bearish candlestick patterns out there, but can be effective when used properly (which we will discuss later).
Next…
Tweezer Top
A Tweezer Top is a (2-candle) reversal candlestick pattern that occurs after an advanced in price.
Here’s how to recognize it:
- The first candle shows rejection of higher prices
- The second candle re-tests the high of the previous candle and closes lower
And this is what a Tweezer Top means…
- On the first candle, the buyers pushed the price higher and were met with some selling pressure
- On the second candle, the buyers again tried to push the price higher but failed, and was finally overwhelmed by strong selling pressure
In short, a Tweezer Top tells you the market has difficulty trading higher (after two attempts) and it’s likely to head lower.
Evening Star
An Evening Star is a (3-candle) bearish reversal candlestick pattern that forms after an advanced in price.
Here’s how to recognize it:
- The first candle has a bullish close
- The second candle has a small range
- The third candle closes aggressively lower (more than 50% of the first candle)
And this is what an Evening Star means…
- On the first candle, it shows the buyers are in control as the price closes higher
- On the second candle, there is indecision in the markets as both the selling and buying pressure are in equilibrium (that’s why the range of the candle is small)
- On the third candle, the sellers won the battle and the price closes lower
In short, an Evening Star tells you the buyers are exhausted and the sellers are momentarily in control.
Moving on…
How to find high probability bearish reversal setups
Awesome!
You’ve just learned the different bearish reversal candlestick patterns.
Now, let’s take it a step further and learn how to identify high probability trading setups with it.
Here’s how you do it…
- If the market is trending lower, then wait for a pullback towards Resistance
- If the price pullback towards Resistance, then wait for a bearish reversal candlestick pattern
- If there’s a bearish reversal candlestick pattern, then make sure the size of it is larger than the earlier candles (signalling strong rejection)
- If there’s a strong price rejection, then go short on next candle’s open
- And vice versa for long setups
Here are a few cherry-picked examples:
Bearish Engulfing Pattern:
Bearish Engulfing Pattern:
Shooting Star:
Note: There will be losing trades as well and this is not the “holy grail”.
Indecision candlestick patterns
Indecision candlestick patterns signify that both buying and selling pressure is in equilibrium.
And these are 2 indecision candlestick patterns you should know:
- Spinning top
- Doji
Let me explain…
Spinning top
A spinning top is an indecision candlestick pattern that where both buying and selling pressure is fighting for control.
Here’s how to recognize it:
- The candle has long upper and lower shadow
- The candle has a small body
And here’s what a Spinning top means…
- When the market opens, both the buyers and sellers aggressively tried to gain control (which results in upper and lower shadows)
- At the end of the session, neither has gained the upper hand (which results in a small body)
In short, a spinning top shows significant volatility in the market but with no clear winner.
And yes, it looks like the toy you played when you were young.
Moving on…
Doji
A Doji represents indecision in the markets as both buying and selling pressure are in equilibrium.
Here’s how to recognize it:
- The candle’s open and close are around the middle of the range
- The upper and lower shadows are short and about the same length
Although Doji is an indecision candlestick pattern, there are variations with different significance.
They are:
- Dragonfly Doji
- Gravestone Doji
I’ll explain…
1. Dragonfly Doji
Unlike a regular Doji which open and close near the middle of the range, the Dragonfly Doji open and close near the highs of the range with long lower shadow.
This tells you there is a rejection of lower prices as buying pressure stepped in and pushed the market higher towards the opening price.
2. Gravestone Doji
Unlike a regular Doji which open and close near the middle of the range, the Gravestone Doji closes open and close near the lows of the range with long upper shadow.
This tells you there is a rejection of higher prices as selling pressure stepped in and pushed the market lower towards the opening price.
Moving on…
Continuation candlestick patterns
Continuation candlestick patterns signify the market is likely to continue trading in the same direction.
And if you’re a trend trader, these candlestick patterns present some of the best trading opportunities out there.
So here are 4 continuation patterns you should know:
- Rising Three Method
- Falling Three Method
- Bullish Harami
- Bearish Harami
Let me explain…
Rising Three Method
The Rising Three Method is a bullish trend continuation pattern that signals the market is likely to continue trending higher.
Here’s how to recognize it:
- The first candle is a large bullish candle
- The second, third and fourth candle has a smaller range and body
- The fifth candle is a large-bodied candle that closes above the highs of the first candle
And here’s what a Rising Three Method means…
- On the first candle, it shows the buyers are in domination as they closed the session strongly
- On the second, third, and fourth candle, buyers are taking profits which led to a slight decline. However, it’s not a strong selloff as there are new buyers entering long at these prices
- On the fifth candle, the buyers regain control and pushed the price to new highs
Note: If you’re familiar with western charting, you’d realized the Bullish Flag and Rising Three Method pretty much mean the same thing.
Falling Three Method
The Falling Three Method is a bearish trend continuation pattern that signals the market is likely to continue trending lower.
Here’s how to recognize it:
- The first candle is a large bearish candle
- The second, third and fourth candle has a smaller range and body
- The fifth candle is a large-bodied candle that closes below the lows of the first candle
And here’s what a Falling Three Method means…
- On the first candle, it shows the sellers are in domination as they closed the session strongly lower
- On the second, third, and fourth candle, sellers are taking profits which led to a slight advanced. However, it’s not a strong rally as there are new sellers entering short at these prices
- On the fifth candle, the sellers regain control and pushed the price to new lows
Next…
Bullish Harami
Here’s the deal:
Most trading websites or books will tell you the Bullish Harami occurs after a decline in price.
But I can’t agree.
This is one of those things you must use common sense to filter out the BS out there.
Think about this:
A downtrend is created using the prices of the few hundred candlesticks.
Do you think it will reverse because a Bullish Harami is formed?
Unlikely.
Instead, the Bullish Harami works best as a continuation pattern in an uptrend.
It signals the buyers are “taking a break” and the price is likely to trade higher.
Moving on…
Here’s how you recognize a Bullish Harami:
- The first candle is bullish and larger than the second candle
- The second candle has a small body and range (it can be bullish or bearish)
And here’s what a Bullish Harami means…
- On the first candle, it shows strong buying pressure as the candle closes bullishly
- On the second candle, it shows indecision as both buying and selling pressure is similar (likely because of traders taking profits and new traders entering long positions)
Note: You can treat the Harami as an Inside Bar. They mean the same thing and can be traded in a similar context.
Bearish Harami
A bearish Harami works best as a continuation pattern in a downtrend.
It signals the sellers are “taking a break” and the price is likely to trade lower.
Here’s how you recognize a Bearish Harami:
- The first candle is bearish and larger than the second candle
- The second candle has a small body and range (it can be bullish or bearish)
And here’s what a Bearish Harami means…
- On the first candle, it shows strong selling pressure as the candle closes bearishly
- On the second candle, it shows indecision as both buying and selling pressure is similar (likely because of traders taking profits and new traders entering short positions)
Let’s move on…
How to find high probability trend continuation setups
So…
You’ve learned what are continuation candlestick patterns and how it looks like.
Now, I’ll teach you how to identify high probability trading setups with these patterns.
Here’s how to do it…
- If the market is in a range, then wait for it to breakout out of Resistance
- If the market breaks out of Resistance, then wait for it to form a continuation candlestick pattern (like Rising Three Method or Bullish Harami)
- If the market forms a continuation candlestick pattern, then go long on the break of the highs
- And vice versa for short setups
Here are a few cherry-picked examples:
A variation of the Falling Three Method on USD/ZAR:
Rising Three Method and Bullish Harami on EUR/USD:
This is powerful stuff, right?
Great!
Let’s move on…
Candlestick patterns cheat sheet: How to understand any candlestick pattern without memorizing a single one
You’re probably wondering:
“Gosh!”
“There are so many candlestick patterns. How do I remember all of them?”
Well, you don’t have to.
Because if you understand the 2 things I’m about to share with you, then you read any candlestick patterns like a pro (think of it like a candlestick pattern cheat sheet).
Here’s what you must know…
- Where did the price close relative to the range?
- What’s the size of the pattern relative to the other candlestick patterns?
Let me explain…
1. Where did the price close relative to the range?
This question lets you know who’s in control momentarily.
Look at this candlestick pattern…
Let me ask you…
Who’s in control?
Well, the price closed the near highs of the range which tells you the buyers are in control.
Now, look at this candlestick pattern…
Who’s in control?
Although it’s a bullish candle the sellers are actually the ones in control.
Why?
Because the price closed near the lows of the range and it shows you rejection of higher prices.
So remember, if you want to know who’s in control, ask yourself…
Where did the price close relative to the range?
Next…
2. What’s the size of the pattern relative to the other candlestick patterns?
This question lets you know if there’s any strength (or conviction) behind the move.
What you want to do is compare the size of the current candle to the earlier candles.
If the current candle is much larger (like 2 times or more), it tells you there’s strength behind the move.
Here’s an example…
And if there’s no strength behind the move, the size of the current candle is about the same size as the earlier ones.
An example…
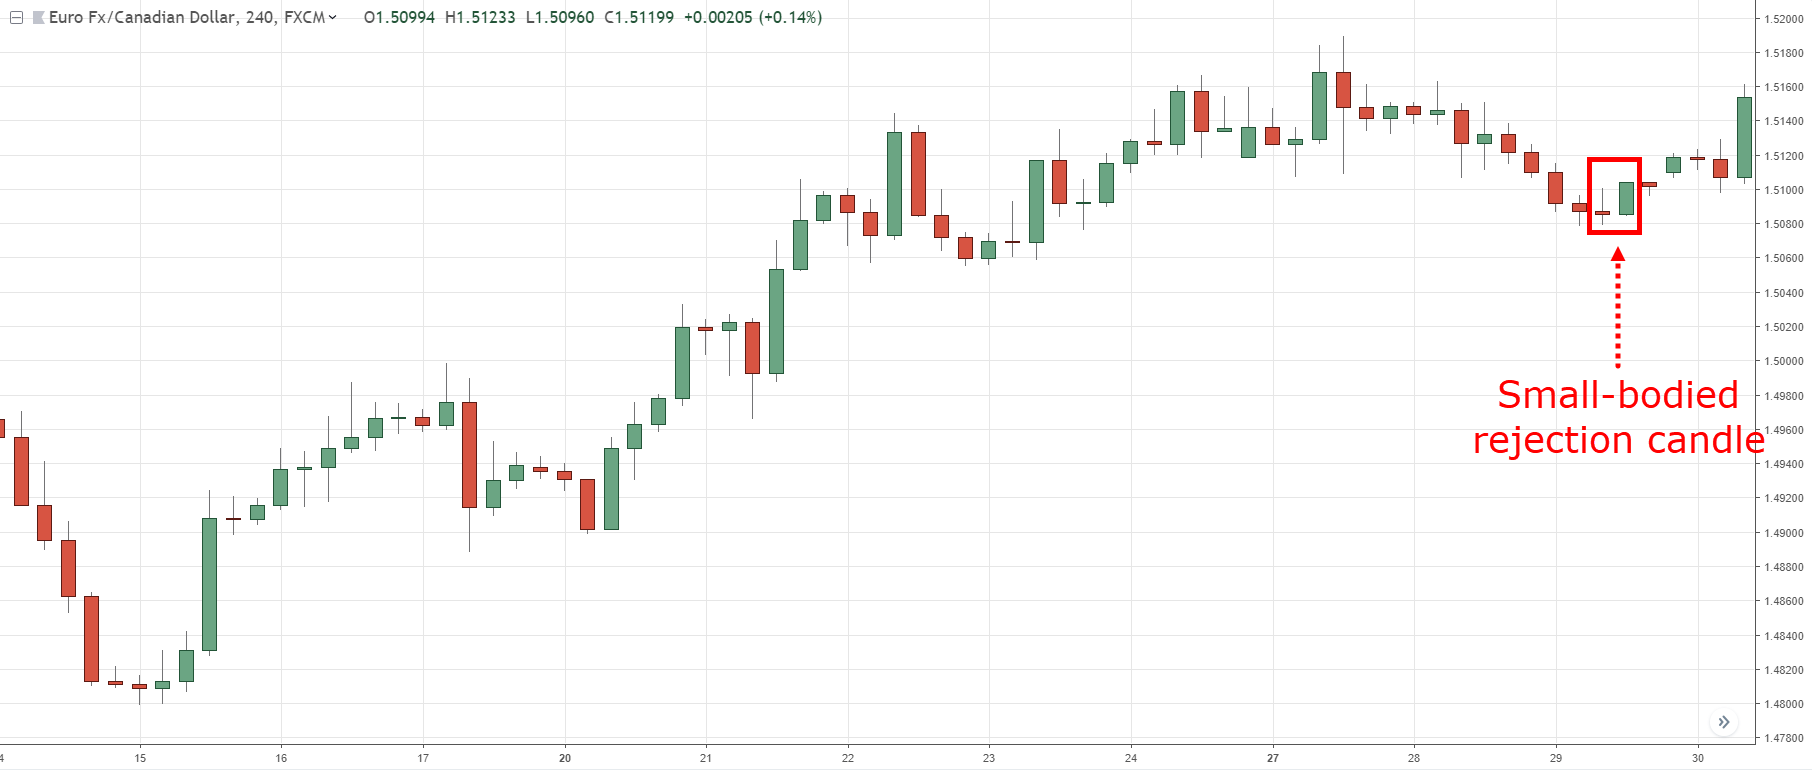
Does it make sense?
Great!
Now you have what it takes to read any candlestick pattern without memorizing a single one.
Bonus: How to read candlestick chart and “predict” market turning points with deadly accuracy
Here’s the thing:
The market doesn’t move in one straight line.
Instead, it goes…
Up and down, up and down, up and down, right? (Something like that)
And you can classify this “up and down” pattern into:
- Trending move
- Retracement move
This is important for candlestick trading, so let me explain…
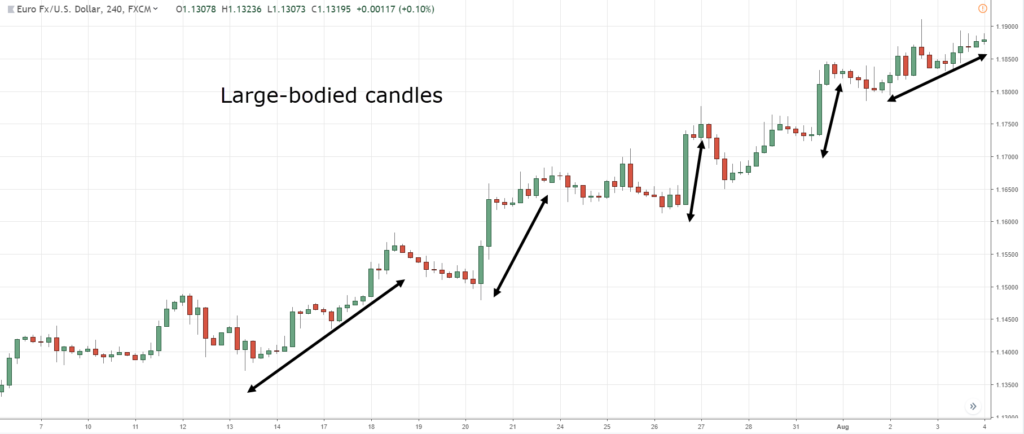
Trending move
A trending move is the “stronger” leg of the trend.
You’ll notice larger-bodied candles that move in the direction of the trend.
An example:
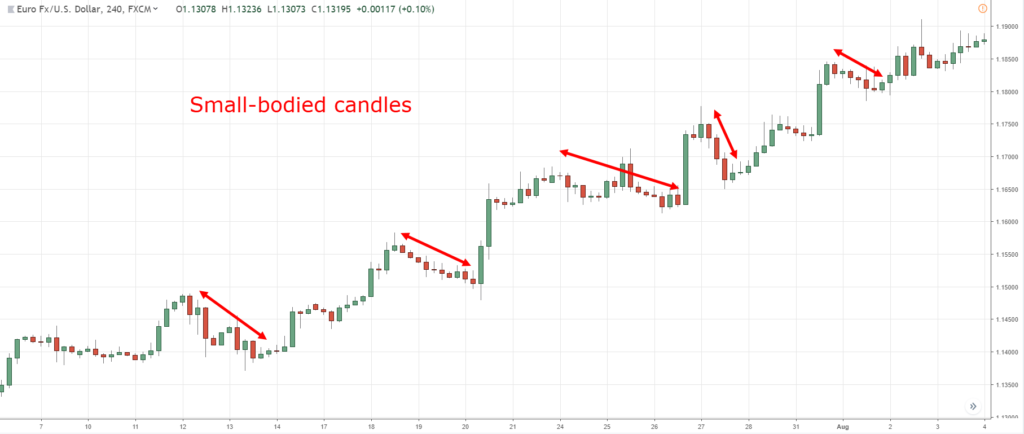
Retracement move
A retracement move is the “weaker leg of the trend.
You’ll notice small-bodied candles that move against the trend (otherwise known as counter-trend).
An example:
You might be wondering:
“Why is this important?”
Because in a healthy trend, you’ll expect to see a trending move followed by a retracement move.
But when the trend is getting weak, the retracement move no longer has small-bodied candles, but larger ones.
And when you combine this technique with market structure (like Support and Resistance, Trendline, etc.), you can pinpoint market turning points with deadly accuracy.
Let me give you an example…
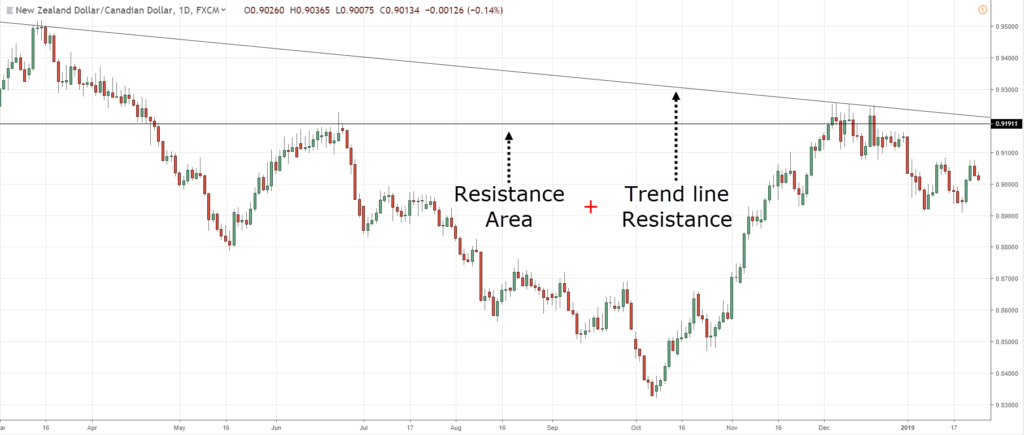
NZD/CAD Daily:
On the Daily timeframe, the price is at Resistance area and has a confluence of a downward Trendline.
The price could reverse lower so let’s look for a shorting opportunity on the lower timeframe…
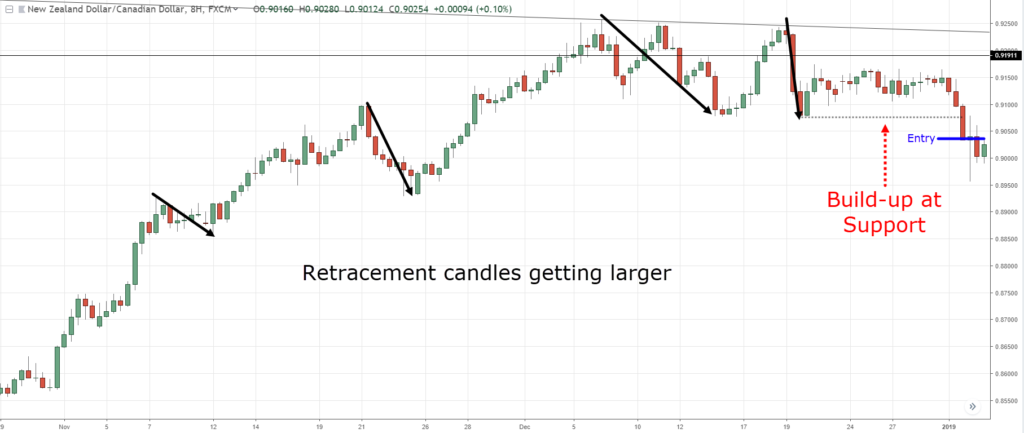
NZD/CAD 8-hour:
On the 8-hour timeframe, the selling pressure is coming in as you notice the candles of the retracement moves getting bigger (a sign of strength from the sellers).
Also, the buying pressure is getting weak as the candles of the trending move get smaller.
One possible entry technique is to go short when the price breaks and close below Support…
This is powerful stuff, right?
Frequently asked questions
#1: Is this guide applicable to all types of instruments or is it better suited to the Forex market?
The concepts in this guide can be applied to all markets with sufficient liquidity. This includes stocks, futures, bonds, etc.
#2: Are the candlestick patterns that you’ve mentioned earlier best suited for certain timeframes?
There’s no best timeframe to trade the candlestick patterns, it all boils down to your trading approach and the trading timeframe you’re on.
It doesn’t make sense to be looking at candlestick patterns on the daily timeframe if you’re a short-term trader entering your charts on the 15-minutes timeframe.
#3: Do you look at the news when you trade?
I don’t take into account news when I trade.
Because I believe all the news out there has already been expressed in the price of the market. And my trading strategy is developed ahead in time without accounting for news. If I were to follow the news instead of my trading strategy, then I’m no longer following my trading plan.
Look, if you don’t follow your trading plan and instead get affected by the news, then your actions are no longer consistent. And if you do not have a consistent set of actions, you’re not going to get a consistent set of results.
So, what’s next?
You’ve just learned that candlestick patterns give you an insight into the markets (like who’s in control, who’s losing, where did the price get rejected, and etc.).
However, you don’t want to trade candlestick patterns in isolation because they don’t offer an edge in the markets.
Instead, use them as tools to “confirm” your bias so it can help you better time your entries & exits.
Now… it’s time to put these techniques into practice.
The next step?
Click on the link below and download The Monster Guide to Candlestick Patterns.
You’ll get a beautiful PDF file that contains trading strategies and techniques that I’ve not shared in this post.









Hi Rayner,
Nice information and well explained, thanks! My questions:
1. Is this applicable to all types of instruments or is it better suited to forex/currency pairs?
2. Does this pattern spotting also apply to shorter market time frames i.e. daily candlesticks over a 1 month or 3 month period or is it best suited to a yearly view, like in your examples above?
Thanks,
Paul
Hey Paul
1. The concept can be applied to all markets with liquidity.
2. There’s no best timeframe to trade it, it boils down to your own trading style.
Thank you Rayner for sharing such a good information.
Excellent. It works with stock market equally. n I use it. I follow you regularly.
Hi Rayner, thanks for this information. As per my little experience it seems that the higher the timeframe is the higher and most valuable will be the probability of success and the profit.
Even thought thoses informations are more than available in internet, a monster guide (for me) would be a guide with all the potential entry and exit with the consequence in your trade depending on the money management, and thoses informations are difficult to find.
Of course the best way would be that the trader make it him(her)self.
I find that trading the candlestick pattern very valuable in daily timeframe (i do the mini s&p future), but the most difficult thing is where to place your stop, i am stuck with this rule as the movement between the close (or open) and high (or low) can wipe you out… and then you realize you still were right on your trade but still loss some money!
Thanks anyway for all your valuable advices.
You’re welcome, Zak.
Cheers
Awesome Rayner ! Thank you, Tracey
Welcome, Tracey!
Thanks Rayner learnt alot
I’m happy to hear that.
What is a good platform (brokerage ) should I do this on to begin with?
I don’t publicly discuss brokers because in this day and age, we have no idea what goes on behind the scenes.
If you want a recommendation, drop me an email me and we can discuss it.
Excellent explanation. Thanks
You’re welcome!
great brother your all lesson is very powerful GOD bless you
Cheers
Thanks Rayner. Learnt a lot from you. Most comprehensive explanation on candle stick patterns that I have ever read.
You’re welcome. Cheers
Hey you speak the truth and in plain English, appreciate you…
Thanks Rayner you make it so easy to understand.
Awesome to hear that!
You’re a great teacher Rayner !
Have read quite a lot on candlesticks pattern . I got even more confused .
But with this well explained guide in the simplest format , I got all the tools I need to read the markets for better understanding .
I am a binary option trader . Have never traded forex in my life .
However everything have learnt from you i applied to my way of trading and ever since have become a consistent trader .
Can’t thank you enough , sharing your knowledge for free .
Bless you .
You’re welcome, Lateef.
I’m happy to hear that!
thanks Rayner very good teacher .
You’re welcome!
Thanks ray
Welcome Narry!
It was truly informative. I studied the candlestick lesson sometimes back but this was like being in another class yet not studying something new, but refreshing in a spectacular way. Keep up the good work and keep being blessed.
Awesome to hear that!
Wow!
Thank you Rayner for sharing your thoughts unselfishly.
The pleasure is mine.
Thank you for the explicit explanations
I’m happy to help!
Can’t get enough of senyor Rayner lessons, awesome as always.
GOD Bless you!
Thank you Daryll!
Great stuff!
Thank you, Rayner!
You’re welcome, Drew!
thank you Rayner
You are a great influencer man
I appreciate it, Aron.
Hello Rayner,
Thanks for the explanation. I just want to clarify regarding this
“For a Bullish candle, the open is always BELOW the close.”
“For a Bearish candle, the open is always ABOVE the close.”
I assumed that the Green candle is the bullish and Red is the bearish. Isn’t it that the bullish candle open is always ABOVE the close? and Bearish candle, the open is always BELOW the close?
Yes, that’s right.
Another one is the explanation in the “Evening Star” you’ve mentioned there “Morning Star” instead of evening star. 🙂
Sorry for noticing a lot here, I’m just paying attention to every detail that you put in here.
Hey Cheekbones
Sorry, but could you point out where the error was made?
Thanks!
An Evening Star is a (3-candle) bearish reversal candlestick pattern that forms after an advanced in price.
Here’s how to recognize it:
The first candle has a bullish close
The second candle has a small range
The third candle closes aggressively lower (more than 50% of the first candle)
And this is what a Morning Star means… <— Here 🙂
Anyway, this is not a big deal. Thanks for responding by the way, you're blog is awesome!
Ah thank you for pointing out my mistake, cheers
Thanks for simple and detail explanation Rayner. Very helpful. L
You’re welcome!
Thank you Reyner !!!
You’re welcome!
Thanks Rayner for comprehensive candlestick patterns.
The pleasure is mine 🙂
Awesome and simple explanation. When is weekly update coming…. Waiting eagerly.
Hey Neeraj
Please refer and subscribe to my Youtube channel. I always publish there.
Can I have this guide
I don’t have a PDF on it.
Excellent explanation Rayner. Thank you so much for explaining this in a very simple and effective way.
Thank you, Anil.
Thanks Rayner . U r doing a great job . U r writing and presentation style is very easy to understand .
Thank you, I appreciate it.
Hi Mr. Rayner,
Thank you for your clear and solid explanation.
If I try to visualize the tweezer bottom, does it looks like double bottom pattern in lower timeframe ?
Yes, something like that. cheers
if only l had read this long ago…Thanks for a first class easy to overstand explainations on this matter.
You’re welcome!
Hi Rayner. Thank you soooo much for the explanation.
Question : Do you also look into news when you trade or you just focus on price action and trend following?
Thank you 🙂
I ignore the news. Price action and trend is all I need.
Well explained master, easy understanding, thank you
The pleasure is mine, Rajesh.
Hey you’re great knowledge,, thank-you teach me awesome sir
cheers
Incomplete candles forms, I wanted to go deeper but here are just the main one, i was looking for something deeper understanding, every website has same candlesticks patterns.. ….
When we follow price action and trend following, no need to bither about news right?
I don’t.
Thank rainer! Excelent!
Cheers
I am a huge fan of u sir…
Cheers Prince
Well explained…always ready to learn from ur post.Thanks
Cheers
Hey Rayner, Do you use a stop loss on every trade?
Yup!
This is great. Thank you so much for the knowledge.
You’re welcome!
I learned a lot from you thanks a lot from the philippines
You’re welcome, Gerlan!
This is great explanation more thanks to you for your love and concern about us
My pleasure, Mike.
Hi Rayner, Thank you for this excellent blog on candlestick patterns.
I have a question on “Strong price rejection VS weak bullish close:” , where candle has long upper wick {indicating upside rejection} and small green body with little or no lower wick.
Some call this as ‘Inverted hammer’ and if this occurs in downtrend, it may be considered as bullish reversal sign, as in downtrend, buyers have stepped in. Though buyers couldn’t sustain high price and eventually price drops, they say that buyers stepping in downtrend is time to be watchful and cautious on downtrend/ holding shorts.
Do you buy this statement? Would like to hear your views on this. Many thanks.
I never look at candlestick patterns in isolation.
It’s always relative to what the market is doing, whether in an uptrend, downtrend, near market structure, and etc.
Very easy and great teachings
Thank you, Vaidehi!
Very good teaching sir.
Thank you!
Very educative notes and easy to understand. Thank you very much.
You’re welcome!
Thanks, Rayner,
The information is awesome.
You’re welcome!
Thank you Rayner. information simple and well explained. God bless.
You’re welcome!
Thanks very much Rayner! I have learned a great deal from your articles and videos. The greatest part is that you unselfishly give them out free, meaning you want others to succeed and attain financial freedom. Thanks once again. Had I found your work earlier, my trading skills would have been much better. Now that I’ve found your work, I’m a great fan. Stay blessed sir.
It’s never too late.
I’m glad to be of help, cheers!
Sir have enjoyed mist of your video on YouTube and on this site.want to learn more from u
Feel free to explore around the website, cheers.
Thanks
Cheers
That is good explaination Rayner, thanks u
My pleasure!
I have never traded, not even demo. Yet I believe strongly that what you are teaching will make any serious person a successful trader. God bless.
Cheers
Thank you sooo much for making it clear,,!
You’re welcome, Bostone!
Hey Rayner,
How do you apply this for binary options trading Strategy?
I don’t trade binary.
Hello Rayner,
Can you download the Monster guide to candlestick patterns like the the one i just downloaded for price action trading?
You might be able to download it here… https://t.me/tradingwithrayner
It’ll be available as long as we are below 10,000 members.
Good work
Thanks!
Nice knowledge sharing
Thanks a lot Rayner
My pleasure, Hardik!
Rayner Teo, your teachings have made me realise that trading needs planning, short term and long term.
Proper preparation set ups.
Yes, definitely!
Without planning it’s gambling.
Thank you Rayner, very good explanation of the candles.
Cheers Alex!
As clear as water explanation. Awesome. Keep it up Rayner.
I will, Ely!
Thanks so much for this! Amazing work and keep it up!
You’re welcome, Leo!
It an excellent way of understanding the candlestick you have guided us very many thanks master….. Manoj
My pleasure, Manoj!
Hi Reyner! I am a beginner, I want to learn and understand more how to read candlesticks accurately. You have the precise and accurate presentation of candlesticks pattern, can I get a downloadable copy of the “Monster Guide to Candlesticks Pattern”? Thank you.
Nicely explained, thanks
My pleasure!
Hi Rayner…oh my gosh…you are the best. Why?…I have read so many trading articles that left me confused, misguided and even more confused.
When I discovered you I tried getting my hands on everything you said and have written and have been blown away. You explain everything that is so easy to comprehend and give new traders like myself the ability and confidence to move forward to succeed on this journey.
Thank you, you have opened my eyes the way nobody has.
Your perpetual learning Student.
D.D.W
I’m glad to be of help, DDW!
Rayner,
You are worth it… um new in the industry of Forex but now um no longer new… You are intuitive. SUPER
Cheers Jakes!
Great stuff, you can’t find this anywhere apart from experienced traders. thanks for sharing.
You’re welcome, Francis!
Hey Rayner, thank you for sharing your knowledge, skills and experience with us✌️
I just have one question though, how do we filter out stocks or markets? I mean based on volatility or market capitalization or is there any other tools or techniques to filter potential stocks or markets?
It depends on your trading strategy.
If you want to trade breakouts then it makes sense to filter for 52-week high.
If you want to trade pullback, then a 10-day low might make sense.
And etc.
Thanks so much Rayner,,,,, have gain alot on monster guide to candlestick patterns.
A quick question…. can these strategies be used for Crypto trading as well? It seems to me that they are very very useful
The concepts can be applied the same.
Very good
Thank you
Great stuff Rayner.
You are a very good teacher, you make it so easy to understand.
God bless
Cheers Jan
A downtrend is created using the prices of the few hundred candlesticks.
Do you think it will reverse because a Bullish Harami is formed?
But a trend can change cause a hammer or any other trend reversal candlestick formed?
Sure it can, anything is possible.
But what are the odds?
Very experienced explanations. Thank you. Rayner
You’re welcome!
Thank you Rayner! This is awesome!
Cheers
Hi Rayner. I have been following you for short but I am believing in myself now with all your presentation a have come across. I wish you are here so I can assure you your works would make an impact on my always losser trades. Thank you soo much and never get weak arms.
Cheers bud
mind blowing
cheers
Wow it really is a monster guide indeed , thanks for the info.
My pleasure!
Very excited and thankful to follow Rayner
very nice ..!!
cheers
Nice information Rayner
Thank you, Manoj!
The little ( because i am taller :), awsome , smart RANER = SUPERRAYNER.
Wonderful article, Let’s Make a new one named ( Trending Supported by MO to confirm Entry, Exit Points).
Cheers
Cheers Jeff
nice explaination
Cheers
fine
Hi Rayner, this is good stuff. Very clear and informative. I learnt a lots from you.
Awesome!
Detailed explanation….Thanks sir keep it up…best of luck
Thank you Suresh!
really a good one. am actually a beginner still practising with a demo account… and with this ill put them into practice Rayner Teo
Awesome! Let me know how it works out for you.
You are a blessing from above. Carry on we are with you
I will, thank you!
Amazing Rayner!!! Thanks a lot!
My pleasure!
Informative piece,i love it.
Glad to hear that!
Hi Rayner
Well explained, I am your fan thank you for your help
You’re welcome!
Super sir , really effectively… thanks sir
Cheers
Thank you Rayner,you are Exlent knowledge sharing.Thanks lot.
My pleasure!
Hi Rayner, I am really blessed with your teachings.
Thank you for your kind words!
thank you for putting the effort… great work
Cheers
Cheers. Kindly add me on your Facebook page
Is good good. Yummy yummy. You is a best one. You is true ninja man. You do big one in little one. You best one. Thanks you!
My pleasure!
Good job…
Cheers
Superb!!
Cheers
Thanks a lot,
its amazing and simple, I did loved,
and thanks for the free books,
i was wonder if you have recommendations for a good broker?
and we need some videos on screener
Grazie grazie grazie
Cheers
You are fantastic….and boom in candlestick….. I was only focused on MA without consider others like SR, pattern etc.. when I go through your notes i come to know with all the stuff from your end is really worth ful
Glad to help out!
I was wowed by your teachings very excellent and straight forward. I need clarity on the Continuation candlestick patterns “Rising and Falling Three Method” precisely, it was exact opposite of my previous knowledge i.e your explanations were directly opposite of what I learnt from JCP) Please help me out…..how do I strike the balance. I got stuck on how to apply it. Thanks
Test it out and verify it for yourself.
Thank you Rayner. I’m a complete beginner and I highly appreciate the very useful knowledge you are sharing to this community.
All the best to you and your family.
Thank you, Raymundo!
Hi Rayner
thank u for this nice information but i got confused with 20ma and 50ma dynanamic support and resistance and stochastic strategy i failed to know how it is applied
Good practical stufff
Thank you!
Im thankful to be a member of this wonderful team, and im ready to learn alot
There is no better explanation to candlesticks I have learnt like this one ….. Thanks Rayner
Awesome to hear that!
Great
Hi sir!
Can i use the candlestick patterns for 1 min time frame trades?
thank u for motivating us specially newbie like me
You’re most welcome!
Hi Rayner, Your information’s are meaningful.Thanks for effort.Just one small suggestion.. could you please check title & picture of Bullish Harami & Bearish Harami above…I think there is a typo mistake…
What’s the error, could you explain? cheers
Very good book , Thanks
Hey Hitesh,
Thank you!
Great explaining
Hi Alpha,
You are most welcome!
Good for those who wants to learn price action..
Hi Santham,
Thank you!
Cheers…
Hi Rayner,
I started following you today and within hours I’m beginning to spot so many pitfalls that I’d have headed if nobody pointed me in your direction. For the fact that you give them freely, I’m so so amazed. Thank you so much for the this.
If there’s any further guide that is equally concise for novice, I’ll very more appreciate too.
Thanks again.
Hi Wilfred,
I’m so glad to hear that!
Cheers…
Thanks Rayner, you’re one of the best Forex instructors I have ever come across. Stay blessed
Hi Kunle,
Thank you!
Thanx Rayner the candle sticks sizes is very important factor in trend retracement or pullback,very powerfull
Hi Xolani,
I’m glad to hear that!
Awesome
Hi Manish,
You are most welcome!
Beautiful ever since I subscribed am making profit. Back then I used to lose a lot of money.
Hi Sasha,
I’m glad to hear that…
Cheers.
Hey Rayner, thanks for the beautiful explanation. You are awesome. Pls also make a video on Intraday trading. It will be useful to everyone.
Thank you
Hi Puneet,
You are most welcome!
Cheers…
Thank you sir for your guide line it is exlent and is show your experience.
Clicked on your link, put details in, didn’t receive anything.
this is great stuff.
Thanks
You are a hero!
Thanks 🙂
This is still helping a newbie after it was initially posted almost 3 years ago. Thank you so much, Rayner!
Awesome, Bobs!
Most valuables information
Thank you, Yuvaraj!
[…] you’ll learn a few powerful candlestick patterns to help you better time your […]
Very very useful articles & YouTube videos as well ..excellent stuff…Thank you very much Sir..
You are welcome, Bramha!
Great job.thank you sir
You are welcome, Hai!
I follow your book’s
Awesome, Sudhakar!
Thanks Mr Teo for the lovely explanation. Have a query here. When i refer to morning star writeup above, it is talking about 3 candles but the chart example for the same has five bars. Similarly for “rising three”and ” falling three” write-up, it is talking about 5 candles, but their respective chart examples have multiple candles.
As a learner, how we should read these patterns ? As per write-ups or chart examples?
A clarity from your end would certainly help many beginners loke me. Thanks again.
Very nice
You are most welcome, Kyle!
I need the book monster candlestick
This should be helpful
Hey Ak,
support@tradingwithrayner.com
Cheers.
Hey Ak,
Click the link below and grab your copy.
https://www.tradingwithrayner.com/candlestick-pdf-guide/
Cheers.
Is it work for 30 min time frame boss?
You are truly a blessing in disguise.Simple and easy to underestand,holding back nothing and free.What more could i ask for.Thankyou
I’m glad to hear that, Mohammad!
Thanks for this. Been following you for a year already and you are one with the biggest help in my growth.
You’re welcome, Lenard!
Happy learning!
Thanks for this. I am getting confidence day by day after reading your price action book.
Glad we could help, Naresh!
Dude this is awesome content. Been reading quite a few of your articles. No bullshit, straight to the point, clear and concise, logical and no faffing. Thanks for producing such fresh clean content.
You’re most welcome, Zen!
We’re glad to know you find our material useful!
Cheers!
Hi Rayner.
Thank for sharing all your knowledge and trading experience, you are my first Guru when i started my trading journey. Love all your material and resources. Do u have a pdf with just the 10 profitable candle stick reversal patterns at support and resistance levels. 5 Most Profitable Candlestick Patterns. I know the concept of buyers and sellers, but i wanted just a pdf of the actual candle , so I can stick on my wall. I feel you the best PowerPoint illustrations. Hope I’m making sense. Thank you. from Ladybug. NZ
Hey, Geetz!
We’re happy to know you find our material very useful. For the free PDF book, you can download it on our website:
https://www.tradingwithrayner.com/
Hope that helps!
Thanks you for the knowledge shared.
This is profound, so fascinating, I liked it I wish to learn more from you.
Thank you, Bryan!
Follow us on Rayner’s verified accounts so you’ll get notified when we have new posts!
Cheers!
I love this
Thanks, Ojeyemi!
Hello please this book is it free?
Hey there, Sara!
Yes. The Monster Guide to Candlestick patterns PDF version is free. Email us at support@tradingwithrayner.com so we can send it to you.
Cheers!
Your teachings are so powerful Two thanks for the teachings.
You’re most welcome, Tshepiso!
Great teacher ,great knowledge love to read ur blogs , thank u sir lov from india
Glad you like reading it!
Cheers!
Hey Rayner,
Hope you’re well. Nice to meet you online, you’re educational materials are truly inspiring!
I’d like to know if I sign up to your trading system, “Ultimate Systems Trader” is there any money back guarantee if it’s not satisfactory after using it?
Also, what’s the difference between the UST and the UPAT?
Thank you!
Hi, Jay!
Please contact us at support@tradingwithrayner.com so we can assist you with this.
Thanks!
Thanks Raynier for the wonderful notes you’ve prepared on many aspects of technical analysis. Through them I’m gradually becoming a professional trader
We’re glad to hear that, Monty!
Thank you sir, I love your teachings
Happy to hear that, Mr Francis!
I love this book
Thanks, Joel!
This is great
Indeed!
Very very important!!
Yes, Indeed!