One of the most common questions I get from traders is this…
“Hey Rayner, how do I identify the direction of the forex trend?”
However, it’s not as simple as it seems — even if you use trend indicators.
For example:
The Daily chart is in an uptrend.
But when you go down to the hourly chart, it’s a downtrend.
And if you go down to the 5-minute chart, it’s chopping all over the place.
So what should you do?
Well, you’ll know the answer after reading this post because you’ll learn:
- The most important thing you need before identifying the direction of the trend
- How to use price action and identify the direction of the trend
- How to tell the direction of a trend without using candlestick chart
- How to use Moving Average to identify the strength of a trend
- How to use Trendlines the correct way
- How to use Channels to better time your entries & exits
- My personal method to identify and trade with the trend
Sounds good?
Then let’s begin…
This is the most important thing before you can identify the direction of the trend (and it’s not an indicator)
The forex trend is an illusion.
Yup.
You read me right. I said the trend is an illusion.
Why?
Because you can manipulate the trend and see what you want to believe in.
You might be wondering:
“How do you manipulate a trend?”
The answer is…
A trend is meaningless without knowing your timeframe.
Here’s the thing:
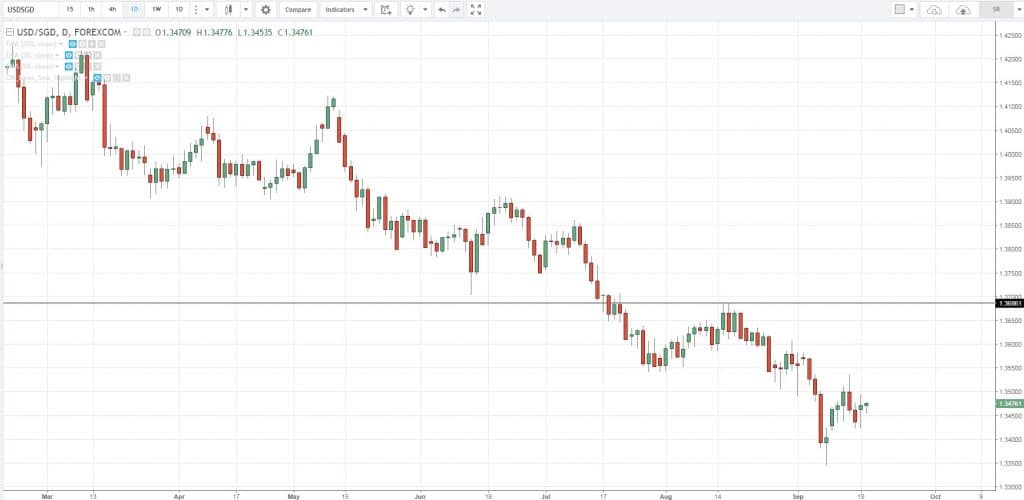
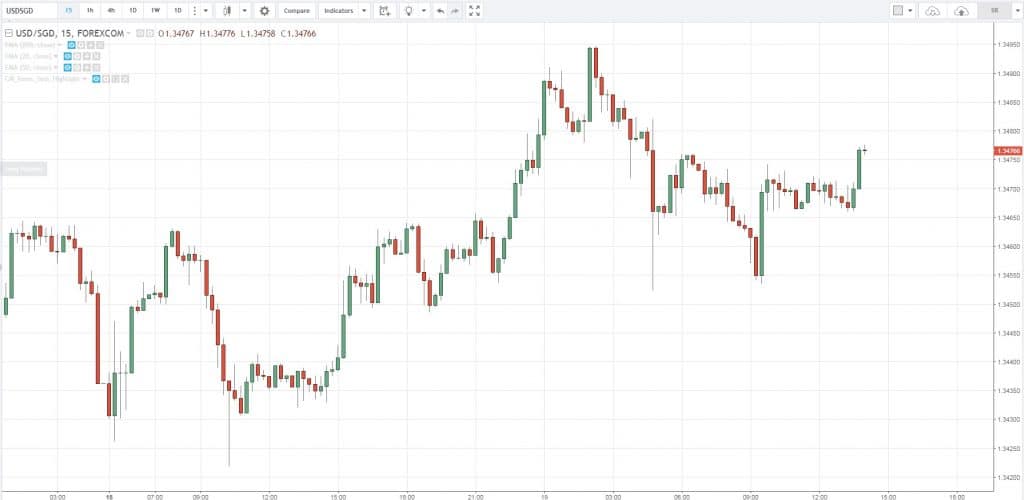
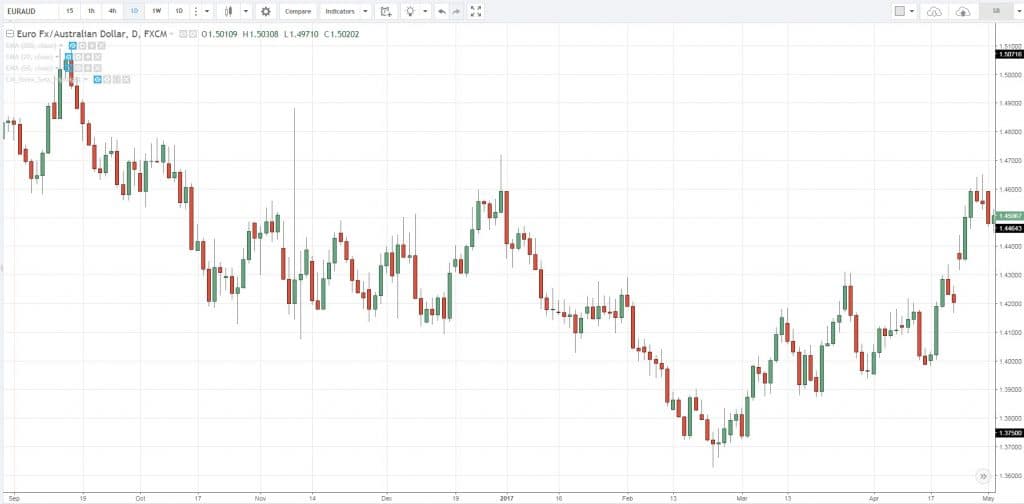
You can have two traders looking at the same market and one says it’s an uptrend, and the other, a downtrend — because they are looking at different timeframes.
Here’s what I mean:
Daily chart:
15minutes chart:
Get my point?
So…
Before you attempt to identify the direction of the forex trend, you must know your timeframe.
You’re probably wondering:
“So Rayner, which timeframe should I use?”
This depends on your trading approach, whether you’re a day trader, swing trader, or position trader.
But as a general guideline:
- Day traders are on the 30minutes timeframe and below
- Swing traders are on the 1 – 4-hour timeframe
- Position traders are on the 4-hour timeframe and above
Once you’ve defined your timeframe, focus on it 100% because the other timeframes are “noise” to your trading.
Next, let’s look at the 5 trend indicators that work…
Trend Indicators #1: How to use Price Action and identify the direction of the trend
Price action refers to reading market structure, momentum, and sentiment to identify trading opportunities.
It’s one of the most important things you can learn because it gives you a valuable insight of the market you’re trading (that may not be found on a forex trend indicator).
For example:
- Where will losing traders puke?
- Where are traders placing their stops?
- Where will new traders enter the market?
If you want to learn more, go read The Price Action Trading Strategy Guide.
Now that you’ve understood the importance of price action, let’s learn how to read it and identify the direction of the trend.
Here are 3 things to remember:
- An uptrend consists of higher highs and lows
- A downtrend consists of lower highs and lows
- A range is contained between the highs and lows
Here’s what I mean…
Uptrend:
Downtrend:
Range:
I’ll admit.
Sometimes it’s difficult to identify the direction of the trend based especially when the candlesticks are “flying” all over the place.
So in the next section, you’ll learn how to identify the direction of the trend without using candlestick charts.
Let’s move on…
Trend indicators #2: How to tell the direction of the trend without using a candlestick chart
Here’s the thing:
Candlestick charts can get messy if the wicks are long which makes it difficult to identify the trend (especially for new traders).
And a simple solution to it is…
Line chart.
You’re probably wondering:
“What is a line chart?”
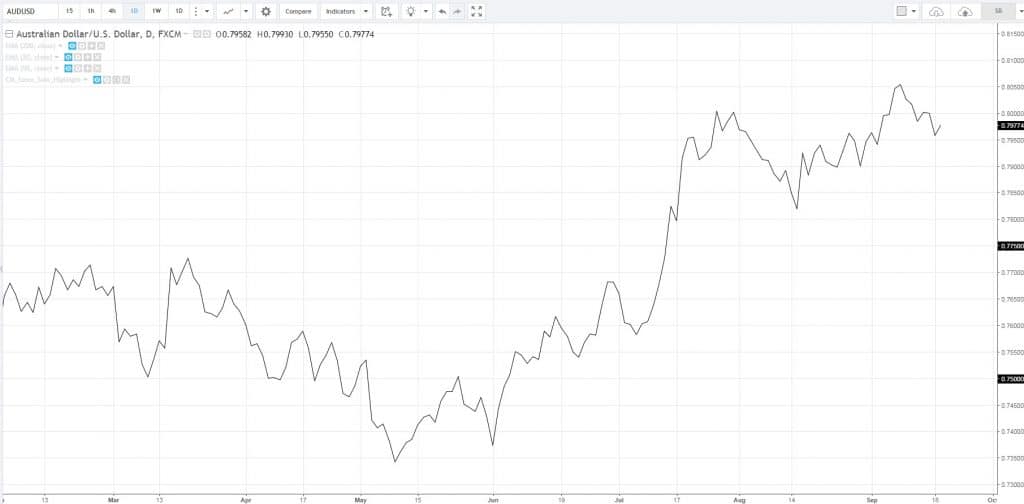
It shows the price on your chart by taking the price at the close and then connects the closing prices together via a line.
So, you’ll see a squiggly line on your chart which makes it easier to identify the trend.
Here’s what I mean…
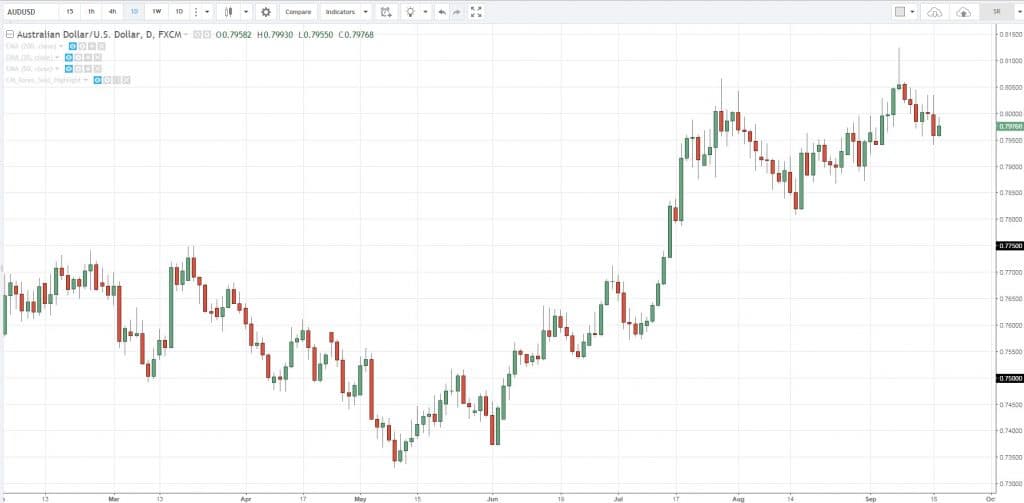
Candlestick chart:
Line chart:
See the difference?
And here’s how you can interpret line charts:
- If the line is pointing higher, it’s an uptrend
- If the line is pointing lower, it’s a downtrend
- If the line is flat, it’s a range
Simple stuff, right?
However…
You must know that line chart only considers the closing price. This means you won’t know what the high/low of the candle is — and this will hamper your trading decisions.
In my opinion, a line chart is useful to identify the direction of the trend. But for precise entries, exits and trade management, it’s best to stick with candlestick or bar charts.
Trend indicators #3: How to use moving average to identify the direction of the trend and the strength of it
The moving average is a trend indicator that “summarizes” past prices and is plotted as a line on your chart.
Yes, it’s a lagging indicator but…
…it doesn’t mean it’s useless because the moving average indicator can help you identify the direction of the trend — and the strength of it.
How to use moving average to identify the direction of the trend
Here’s a simple technique that works:
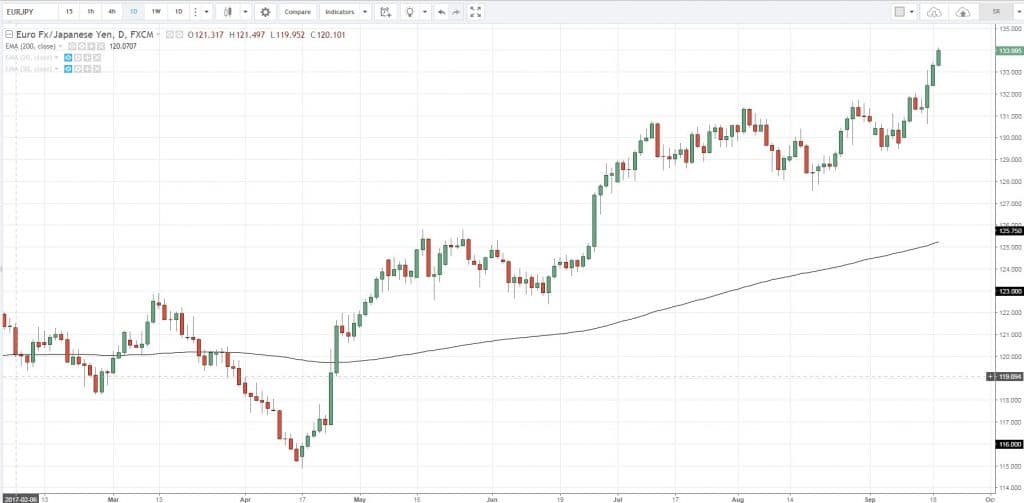
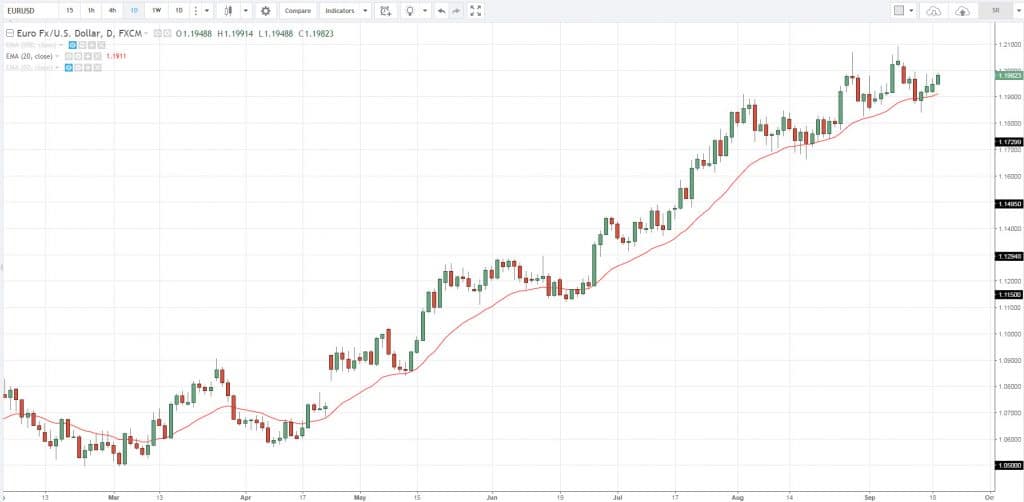
- If the price is above the 200MA, then it’s a long-term uptrend
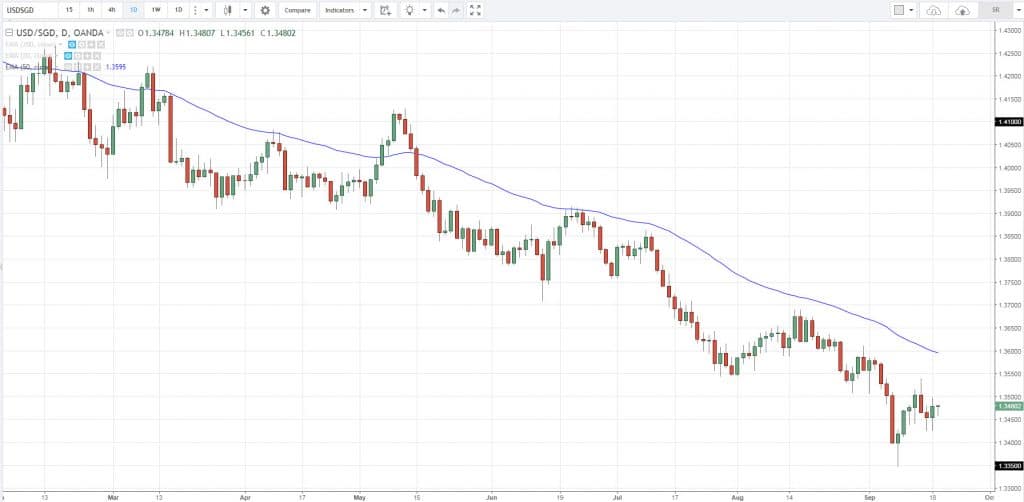
- If the price is below the 200MA, then it’s a long-term downtrend
An example:
How to use moving averages to identify the strength of the trend
Now…
Besides using the 200MA as a forex trend indicator, you can also use shorter-term moving averages to identify the strength of a trend.
Here’s how…
- In a strong trend, the price tends to stay above the 20MA
- In a healthy trend, the price tends to stay above the 50MA
A few examples…
Now:
Moving average works best in trending markets (whether it’s a strong, healthy, or weak trend).
But if the market is in a range, the moving average has little significance and it’s best to ignore it.
If you’re curious to discover my “secret” moving average trading strategy (that you can use), then check out this video…
Trend indicators #4: Trendlines
A Trendline is a tool you draw on your charts. It can help you identify the direction and the strength of a trend.
But before I get to it, you must learn how to draw trendlines the correct way.
How to draw trendlines like a pro
Here’s my 3-step technique:
- Look for at least 2 swing points (it could be a higher low or lower high)
- Connect the swing points using a trendline
- Get as many “touches” as possible on the trendline
An example:
Simple right?
How to identify a trend and the strength of it with trendlines
Here’s how to interpret the trend:
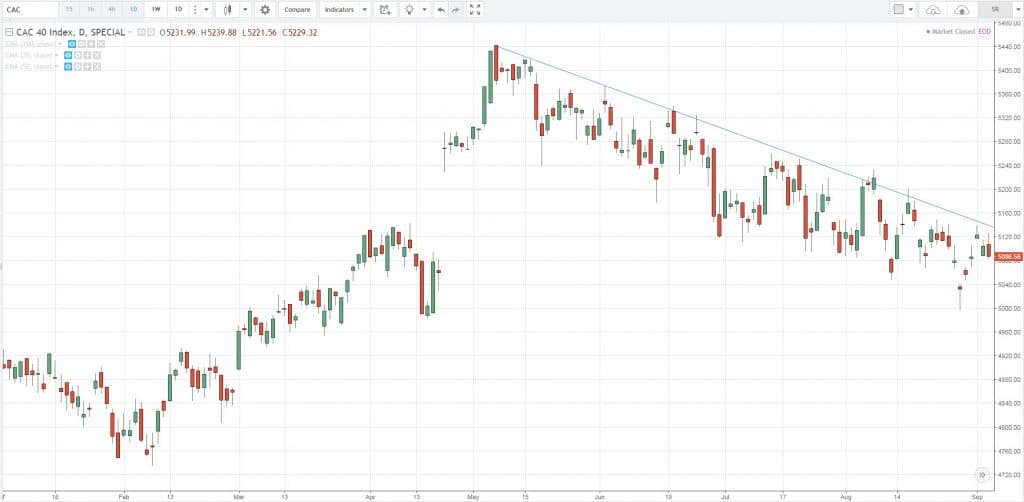
- If the trendline is pointing higher, it’s an uptrend
- If the trendline is pointing lower, it’s a downtrend
However…
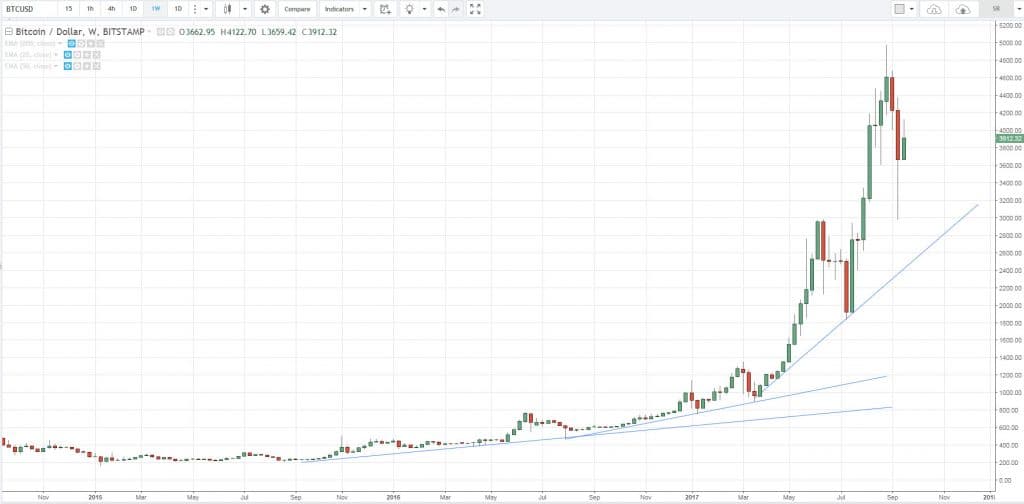
If you want to determine the strength of a trend, then pay attention to the angle of the trendline.
As a general rule:
- The steeper the trendline, the stronger the trend
- The flatter the trendline, the weaker the trend
Here’s what I mean:
Make sense?
Good.
Now you’ve gotten a glimpse of how to use trendlines to define a trend.
But if you want to discover my trendline trading strategy using proven techniques that work, then check out this video here…
Next…
Trend indicators #5: How to trade with Channels and find “sweet spot” for your entries & exits
In case you’re wondering:
“What’s a Channel?”
A Channel is a trend indicator that’s a variation of the Trendline.
The way you draw and interpret it is the same as Trendline.
The only difference is… Channel has an extra line that’s parallel to the Trendline.
Here’s an example:
As you can see…
The channel helps you identify where opposing pressure could come in. This means you can take profit ahead of time — before the price has a high probability of reversal.
Not sure what the trend is? This little-known technique will give you clarity
Here’s the thing:
If you look only at the water, you’ll miss the ocean.
If you look only at the trees, you’ll miss the forest.
If you look only at the current price, you’ll miss the long-term trend.
So what’s my point?
Stop being fixated on what the market is doing each and every moment.
Instead, zoom out your charts.
Yes.
Zoom out your charts and see the big picture.
Here’s what I mean:
Zoom in view:
Zoom out view:
See how much of a difference it makes when you’re looking at the big picture?
By zooming out, you become more effective at using forex and trend indicators alike.
A mistake made by many traders is they become so involved in trying to catch the minor market swings that they miss the major price moves. —Jack Schwager
My personal method: How to identify and trade with the trend
As I’ve shared with you earlier…
There are different ways to identify the trend and there’s no right or wrong or best approach.
But if you ask me, these are the 2 things I ask myself:
- What’s the long-term trend?
- What type of trend is this?
Let me explain…
1. What’s the long-term trend?
I’ll use the 200-period MA to define the long-term trend.
If the price is above it, the market is likely to be in a long-term uptrend and I want to have a long bias.
If the price is below it, the market is possibly in a long-term downtrend and I want to have a short bias.
Next…
2. What type of trend is this?
Here’s the deal:
Not all trends are created equal.
After many years of trading, I’ve realized most trends can be broken down into 1 of 3 categories…
- Strong trend
- Healthy trend
- Weak trend
Strong trend
A strong trend is when the price has little to no pullback and remains above the 20MA.
In such a scenario, the pullback may never come as the price keeps breaking higher. Thus, in strong trending markets, the best entry is usually breakout trades.
An example:
Healthy trend
A healthy trend is when the market has a healthy pullback and remains above the 50MA.
In such market conditions, it’s possible to trade the pullback. Possibly towards the 50MA or, previous Resistance turned Support (in an uptrend).
Here’s what I mean:
And lastly…
Weak trend
A weak trend is when the market has steep pullbacks but remains above the 200MA.
In such a scenario, you can trade from the 200MA or an area of Support (in an uptrend).
An example:
If you want to learn more about forex trend indicators, go read The Trend Trading Strategy Guide.
Frequently asked questions
#1: Which timeframe should I use to identify the trend?
The timeframe should be relevant to your trading:
- If you’re a day trader, then you’ll identify the trend on the lower timeframe like the 1-hour or 30-minutes timeframe.
- If you’re a swing or position trader, then you’ll identify the trend on the daily or the weekly timeframe.
#2: Do I have to adjust the moving average settings to suit different timeframes?
There are no best settings out there because it depends on the type of trend that the market is in.
If the market is in a:
- Strong trend, it will tend to respect the 20 MA
- Healthy trend, it will tend to respect the 50 MA
- Weak trend, it will tend to respect the 200 MA
Personally, I’ll use whichever of these 3 moving averages that the market is respecting more, for the timeframe I’m trading on.
If you want to discover more on moving averages, then check this out:
The Moving Average Trading Strategy Guide
Summary
Here’s what you’ve learned today:
- Why a trend is meaningless without looking at the timeframe behind it
- How to use price action and identify the direction of the trend
- How to identify a trend without using candlestick charts
- Forex trend indicators that easily tell you the direction of the trend using Moving Average
- How to draw Trendlines and identify the strength of a trend
- How to use Channels to better time your entries & exits
- My personal method to identify and trade with the trend
So, here’s a question for you…
How do you identify the direction of the trend?
Leave a comment below and let me know your thoughts…



Rayner, you explain everything in such a great way it’s so easy to understand.
Thank you and keep it coming.
Regards
Haydn Jones
I’m glad to be of help, Haydn.
cheers
In health trend you have mentioned if price stays above 50 MA then it’s healthy…but in the chart it’s below 50 MA. I am talking about from the section “what type of trend is this?”
That’s because it’s in a downtrend, not an uptrend.
Hhh yes
Great Job Man!! All that I have reading on ur pages are educative , Kudos to You Man.
Thanks, Ahmed!
What about the 200 MA.On wich time frame.If you use daily chart the 200 MA is above and when you use 5 minute is below?
Best regards
Davy
Reference it to your trading timeframe.
There’s no point looking at 200ma at every timeframe because there will be conflicting signals.
So 200ma is best for 4hr and 1day time frame?
Hey drew!
Rayner uses only the 200 MA to define the long-term trend. You can use 20 or 50 MA for that timeframe too!
Hope that helps!
thanks a lot, you have always been my hero.very helpful
you’re welcome bud!
Hey Rayner,
Thanks for explaining and showing us what is your strategy. I have started to employ a trading plan and with the EMA20, EMA50, EMA200 with my preferred timeframe, I felt that I am more in control in my trading with risk:reward ratio. Although none can get 100% winning ratio but the risk:reward ratio is a good risk management. Thanks for all the education.
You’re welcome, Kay.
Glad to hear that!
Tq so much…
cheers
Hello Rather,
Thank you for your explanatio, now a have a better understanding of Price Action.
I’m glad to hear that Diego.
best!
that is K.i.s.s eduation ï just like it thanks for polishing My bain.
Cheers
Hi Rayner,
Thanks for revision.
I learn and understand good method from you, which help me a lot during trading.
Great work…
I’m glad to be of help!
Hi Rayner,
Thank you very much for your time and explaining!
It’s easy to understand.
I think that it is much better for me to identify now.
It is wonderful and helpful!
Awesome to hear that Tran.
Don’t hesitate to let me know if there’s anything, I’ll be glad to help.
Hi Rayner
Thank you very much for helping us to become an independent traders, you always remain our mentor
Thank you for your kind words, Aliyu!
Excellent post Rayner! Thanks for sharing. I try not to use too many indicators in my trading (mostly focused on price action). But this list of ideas definitely helps confirm those trading signals that are worth paying attention to. Thanks again!
Thank you Jay. Glad to hear that!
Thank you Raynor. Real eye opener. keep posting.
I will, cheers
Hi Ray,
Very good learnings from this. You resolved my time related chart analysis ideas.
You’re welcome, Santosh.
Hi Rayner, thanks a lot for the article. Will implement some of the techniques into my own.
Though there’s still one thing bugging me. It’s all good knowing to use MAs only in trending markets. The question is how do you know you’re about to ‘get in’ and ‘get out’ of a ‘ranging market’ so you’ll know when to use it and when not?
I’m familiar with people using ADX and others but I often experience coming too late into the trend if I waited for their confirmations. I’m thinking may be there are tested indicators or oscillators (with their setups) of your choice that you could share to help us out with it?
Thanks in advance. Cheers.
Hey Rena
That’s a good question.
I rely on market structure to tell me that. For example, if the price breaks out of a long-term range… the market could be moving into a trending stage.
Thanks Rayner for your educational posts. I can see that you are using the 20&50MA trading the daily timeframe, if I am trading the hourly timeframes should I lower my MA or they work the same on each timeframes?
You can use the 20 & 50 ma across any timeframes.
It’s meant to identify a strong and healthy trend for the given timeframe you’re trading.
You made life simple. You are a blessing. Now I understand trend identification better than before using a combination of techniques explained here.
Thanks Rayner.
cheers bud
My demo trading is getting on pace so does the education level as I could perceive these easily and polish up my mindset and boost my confidence. Wish to take a moment to say a big THANK YOU not to mention you all the extra guidance through long-winded personal emails. It’s more than what money can buy. Great is your reward to help people in the disorganised trading world. May God bless your family!
I mean my long-winded lengthy wordy personal email has been still entertained by you as you took your time to reply which you don’t have to oblige yourself to do so.
You’re welcome, Lucas.
I’m glad to be of help!
Hi Rayner , thank you very much. It is very helpful for me. Even I saw bigger time frame’s trend. Everything is solved in shorter time frames as for me. I am trying to follow the trend on shorter time frames through using the 20 MA. When I decide about my entry and exit I realize the support and resistance areas. I want to learn to go with a trend till it ends.
Nice.
Let me know how it works out for you. cheers
Dear Rayner,
Thanks for great supporting us with giving more knowledge. As a new comer and loser this is very useful and it encourage us. Appropriate if you can train me from A as self learner I do not know where I should start..
This is a good place to start your trading journey
https://www.tradingwithrayner.com/academy/
Hello Rayner can u elaborate more on the transition of the market from range to trend identification using markert again the point of using line graph for trend identification is not well seeping into ma mind with good interpretation can u elaborate it more,
thanks in advance
I’m not sure what you’re asking…
Dear Rayner, is it better to just use the 20, 50 MA on the hourly because the 200 MA is to large to use on the hourly?
Rayner, I just want to say Thank You for taking the time out to help you are a God send.
May you be Bless
Hey William
There’s no best moving average out there.
I explain more here… https://www.tradingwithrayner.com/which-is-the-best-moving-average-to-trade-with/
Thanks again Rayner for the excellent post.
cheers Van
Thank you for the good article.
In your definition of price above 200 MA, it will be good to differentiate between the ones that are in a trend versus one that are ranging while still being above 200 MA.
Hi John
It’s not a foolproof thing and there will be times the market is in a range while above/below the 200ma.
But generally, it keeps you on the right side of the long-term trend.
Great article.
I am assuming that this is applicable to any timeframe (like trend in 60 mins) / any instrument?
What about stocks that has gaps?
Thanks
It works generally across the board.
For a day trader, how do you handle when one timeframe is in uptrend (say daily) and another in downtrend (say 60 mins).
Thank you for the nice post.
For day trader you need to decide which timeframe you’ll give more weight to.
Chances are, the 1-hour would be your higher timeframe to reference from.
The problem is we never know it’s a strong trend or weak trend in the early stage until it’s already developed and by that point we can see the degree of pullbacks to determine. So take losses is inevitable and it’s just part of the game
Yes, that’s right.
That’s why you need proper risk management to contain those losses.
Clear and easily understanding.
I will look forward to your further great content.
Thanks a lot.
……Johann.
you’re welcome, Johann!
thanks rayner for the posts they are very educative i realise everydae that there is still more to learn.may God bless you
You’re welcome, Hardman.
Hey Rayner,
This information was very much helpful. Keep up good work bro. And yes, can you try to write or make a video on RSI, MACD or any other which you find useful that would really help.
I’m glad to hear that, Karan.
I’ll look into it. cheers
Great thanks for improving my understanding.
1. Trading from the 4H chart, is it too restrictive to apply 65day EMA > 200day EMA as the bull for long only criteria. I would trigger my entry from the value zones in the 4H chart ?
2. Further, when in a strong trend (>20EMA in the 4H chart), support/resistance my remain the trigger for entry in the 4H chart. Is it acceptable to optimize the price move in 1H charts to trigger the entry?
-> Or is this the definition for the chaos you start this article with?
There isn’t a best moving average.
I explain more here… https://www.tradingwithrayner.com/which-is-the-best-moving-average-to-trade-with/
Thanks for explaining it so well 🙂 A great learning for life-long.
Cheers
Great content as always. Keep up the good work brother. Thanks
I will bud!
As a beginner, this is great stuff! Just a quick one, do u sell signals? Or better still, do u mentor beginners to make daily profits? Pls advice. I’m keen to know.
I don’t
Good and clear explanation. Will try it on my simulated account and practice. Thank you so much!
Cheers!
Very clearly explained in a simple and practical way. Thank you.
You’re welcome, Ollie.
Hey Rayner!
I use the trend-line angle tool defining strong healthy and weak trends, there’s one in MT4 but I think it’s best used in Trading View.
Strong Trend: 50 Degrees to 80 Degrees Trend-Line Angle
Healthy Trend: 30 Degrees to 49 Degrees Trend-Line Angle
Weak Trend: 10 Degrees to 29 Degrees Trend-Line Angle
The limitation of this is that the angles are skewed on lower timeframes and scale of chart, so some may have different results 🙂
Thank you for sharing, Jet!
Hi Rayner,
I think you misspelled a “Healthy” word. Please see one in bold.
Thank you for pointing out, Garry!
Hi Raynor,
Great information! I typically use 2 time-frames to get a better perspective of the market. Since I mostly use price action, I use the weekly for trend (Higher lows & lower highs) and a daily to find entries. But, I am interested in using EMA but I am not sure if I should place it on the weekly chart or the daily chart. I think the time-frame difference will cause in-accurate trend if I place on weekly and do entries on daily. Should I use smaller numbers on the EMA and if so, what do you think would be good numbers?
Your thoughts?
Why don’t you keep it simple and just define the trend using 1 timeframe?
I’m confuse. You said zoom out an see the whole picture but then you said to stick to 1 chart.
I read that we need to keep track with multiples chart instead of focusing on one. Cre to explain. ?
Here is what I mean.
https://www.babypips.com/learn/forex/why-trade-multiple-time-frames
Noob so I’m open to all ideas.
I’m sharing different techniques you can use.
You don’t have to use all but choose the one that makes the most sense for you.
Hey Rayner u do very noble work by sharing ur thoughts from time to time . It’s very very useful for recently joined trader. God bless you.
I don’t enter trade without 3 time frame analysis and start noting trend on each time frame. But not in as detailed understanding as u mentioned above. I will add up to my checklist now. Thanks tons
You’re welcome!
a million thanks ans may the tradewinds be with you
cheers bud
Knowledgeable
cheers
Hi sir,,,, it’s me Honnayya I m from India….. Really really hatsup sir…. What kind of techniques u have sir… Really I m very happy to see your all YouTube videos….. After watching your all videos… I m on profit…. No loss……
Awesome to hear that!
Great article, awesome
Thank you, I appreciate it!
Hey How Can I Download this PDF
The only way to get it is here… https://www.tradingwithrayner.com/pte/
By using HMA10 & HMA20
Thanks for sharing!
by stepping back and viewing the chart on 1D if there are higher highs and higher lows then it is uptrend and I need to trade with the trend. If there are lower highs and lows then it is downtrend.
Thanks for sharing, Michael.
Price action + moving avelage
Thanks for sharing!
The ultimate article which summarizes the key concepts in such an easy and amazing manner.
Hats off to you Rayner!!
Thank you!
Wow this is great stuff thanks, Mr Rayner I have learn a lot
Awesome to hear that, Michael!
Very nice sir
Thank you, SK!
Powerful
Thank you, Frank!
Draw a trendline,it is easier to see and can show strength from its gradient
Thanks for sharing, Sanjeev!
Thanks Rayner for being my friend and mentor without charges. I’ve really learnt a whole lot for free from you. Thanks once more
Cheers!
Thank you very much Rayner we believe in you
You’re welcome!
MIND BLOWING EXPLANATION OF TRENDS.. NICE JOB.. KEEP IT UP.. REALLY I GOT MY ALL ANSWERS BY READING THIS … GOD BLESS YOU
I’m glad to help, Jatin!
Hello Rayner,
I am using 15min timeframe for Intraday trading. But which timeframe is best for analyse the intraday stocks. Thanks in Advance.
There’s no best timeframe but generally it’s below the 1 hour timeframe.
I’d say 5 and 15mins are common ones.
Thank You …Rayner and also unexpected quality of content from your site… Cheers…
You’re welcome, Aravinth!
Very help for new trader like me that just know forex under 1years..thanks
My pleasure!
Thanks Rayner yu best teacher so far keep up your great work….
Thanks bud!
Any idea about MTPtrend software? is it useful?
I’ve never tried it.
Well, it’s so simple and precise. Keep it up.
Cheers
Am looking for a mentor sir.
Am new to this trend of forex trading.
How can i get into contact with you sir?
Thanks though for the good work
You can reach me via the contact button on the menu.
Dear Rayner
I have seen so many forex training videos in the last six months. I am a new comer to the world of forex.
Last week I am lucky to come across your website and seen a video on Trend finding using MA. Now only I know the power of Moving Average like MA 10, MA50 etc. Every words of you give confidence.
Now I decided to go through your study materials only .
Thank you your excellent free coaching.
Dr.R.Ponraj
Coimbatore Tamil Nadu India.
You’re welcome, Dr R!
you are the best. well explained
Cheers
So helpful and easy to learn. Thank you!
Awesome to hear that!
You’re a great mentor I’ve been having issue understanding the MA’s and I thought I would never know it , thank you for breaking it down for me I think this post was made for me thanks you so much I just finish writing and drawing things down in my note so I can always go back to it and read it when ever I’m lost thanks so much
You’re welcome!
thank you for your awesome work in this field…
My pleasure!
terima kasih Rayner, pelajaran anda mudah difahami
Thank you Rayner,
Well, i still need to ask though. The highers time frames will show an uptrend, meaning a buy, while lower time frames will show a down trend meaning a sell. If i opt to use the lower time frames which are showing a sell to make a trade, are these lower time frames going to eventually align themselves with the higher time frames?
So educating n interesting. Thank u Rayner
You’re welcome!
If the. Price is above the 200 Moving Average. Fantastic Work Rayner…
Cheers
Rayner am having problems with the MA entry… Am using EMA 20 and 50..but I still don’t get it… Is there any simpler way or method you can use to explain more about how I can use EMA 20 and EMA 50 to trade
Very informative n easy to understand…you keep rocking…Thank you for making our trading life simple
Cheers
Rayner,
Thanks for the simple yet very clear explanation.
Cheers
Bulern
My pleasure!
It’s really good!
U are an eye opener, tanks boss
Cheers bud
you’re simply the best man!
i think i should have my first kid called RAYNER !!
Honoured!
It is generally not an easy exercise to determine a trend, however, by zooming out you notice that a trend has been in existence for a long time. The big question how do you recognise it from the beginning?
Yes, there are clues as you have outlined above. Thanks
Thanks Rayner,
You explained it in simple and easy way to understand.
Cheers
Excellent explanation !!
Cheers
Price Action and Moving Average.
Rayner thanks,I identity the trend using various of method 1:price action(higher highs and lower lows)
2: 200 period MA and thank you for that
3 : trendlines
Thanks for sharing, Shaun!
Wow! Clear a lots of my doubts regarding trends and time frame in this article.
Cheers!
Sam
Cheers bud!
The explanation is very clear and quite understandable
Thank you!
Rayner, Is there an easy way of finding good healthy trending stocks, commodities, FOREX, or is trawling through charts the only way to identify them? I’m looking for EMA20, 50 & 200 Trends to get into and trade.
I manually scan through the charts. Haven’t come up with an automated way to do it.
But you can filter for stocks above 200 and 50MA to reduce the number of manual screenings.
To identify the direction of trend, we first of all look at longer time frame, switch to line chart to confirm, then go to our supposed shorter time frame, confirm the trend to be same with longer time, then apply MA 200 for confirm if the price is in confirmation by being above or below the MA.
We can also identify the direction of trend by drawing trend lines and channels.
Thank you for sharing, Augustine!
Thanks for your clear explanation on how to identify the direction of the trend. I now have a different perspective on the matter. I found the tips very useful.
Awesome to hear that!
Rayner thanks for ur valuable insights, you r one of the best professional trader I have ever follow. Thanks
Cheers Samson!
I have learnt a lot Rayner, God bless you and you Sir
Anytime!
My name is Gaurav and I from India. I have watched Ur many vedioes and find out Ur the best mentor in trading.
Glad to help!
Perfect presentation Thanks Rayner
You’re welcome!
Hello Rayner,
First off, thank you for all the free education you share on Forex trading. It has been of immense benefit to me and my friends who just started trading Forex a few months ago.
I have 2 questions.
1.Would you mind sharing your recommended settings for the 20, 50 and 200MAs..?
2. What’s your take on scalping.., do you have any advice / strategy for it..?
Many thanks.
.
Thought provoking narratives
Thank you reyner. You have opened my understanding about a number tricks in forex trading which I never knew before. I’m grateful for you taking the time to share. You are the best mentor in this business that I know of.
You’re most welcome, Ekene!
Rayner i can’t download the ultimate guide to profit bull and bear market please help me to get it
I always able to identify the trend and make a profit but always confuse when to close the deal, sometimes I missed the big strong trend and next time when I hold my deal which initially in profit, later end up with lost, Please help with any advice will improve my strategy, I always love to watch your videos and read the article.
Rayner, I am new to trading and really like what I see about you. I am looking for a mentor and wondering if you can help me?
Can payment be made via PayPal ?
Hey John,
Write through the support email…
support@tradingwithrayner.com
Thank you Rayener fir what you are doing…may God bless you and increase you
Hi Lorato,
Thank you!
all i can say is “thank you” and God bless you.
Hi Taiwo,
Thank you so much!
Thanks so much I always learn
Hi Prince,
You are welcome!
Thanks for sharing your story on the Forex market, it really inspired me.
Though am barely 3months into Forex trading and I’ve crashed my account like twice and would possible need help to improve my trading.
Hi Chima,
You are most welcome!
Hi Rayner, you are a great teacher, very simple to understand, your teachings has opened my eyes to more understanding in this business. May God bless you real good. Tumbs up.
Hi Euphemia,
Thank you very much…
Cheers.
i have been wiatching for 2 yrs , definitely yours videos, writes up are far superior and of highquality , than those of early days when you are relying more on indicators now explaining most of these things just with help of price, pls. make one videos on price and volume interplay… where we shud ignore volume and where nothing without volume….thx and kudos for such selfless and valuable service.
Hi Anil,
You are welcome!
As an intraday trader which moving average is the best to capture trend for intraday 50MA or 20 MA.
This is excellent material! Absolutely loved it!
Hi Charity,
I’m glad you appreciate it.
Cheers!
The explanation was awesome bro, thanks.
Hi Lloyd,
You are most welcome,
Cheers…
Very clear explanation and comprehensive.
Hi John,
Thank you!
Cheers.
Picked quite a bit out of that, thanks Rayner.
Hi JD,
It’s my pleasure.
Cheers.
Rayner, thanks a lot for the knowledge you share. Your way of teaching is excellent. You explain everything in a easiest way to understand. God bless you.
Hi Khudiram,
You are most welcome!
I am glad to be part of your telegram channel. You really explained the information that I’ve been looking for. Thank you very much
Hi Shadreck,
You are most welcome!
Following your teaching
Hi Agboola,
Thank you!
Nice one mr.
But how can I get all stuff in pdf?
Hi Rayner.
Thanks for this blog and videos. They were very educational.
I’m a complete newbie to trading though so it’s all still like greek to me,lol.
I watch your videos on youtube and I just joined your telegram.
I have a lot of questions but for now, I would like to know which MA indicator to set on my trading app?!. I’m seeing 50MA , 20MA ,200MA on your videos but I’m confused though. Which MA is better for trading then with respect to timeframe ??
Great Work Ray T.
I love this great Lecture. Its so educational and encouraging
And best of all very Corrective Nature of it all. I’m corrected on Trendlines and Channel drawings and Timeframes usage. Thanks alot.
And for the question above:
I use 200Ma and 50Ma alongside 20Ma but, I wasn’t sure of the right Timeframe until now.
Thanks alot
Josab
I’m so glad to hear that, Josab!
simply saying you are the best teacher ever i seen
Thank you, Nandhu!
Rayner, you are truly a gem and I appreciate you for giving out all of this knowledge. It has helped me become a more knowledgeable trader.
Thank you, Kat!
excellent.
what if the trade goes negative even if we enter a trade perfectly on POV,
Ramesh Santharam
Rayner Two is the Jesus of forex trading for, am a successful non gambling trader today because of his free educational videos and all. God bless you for making me who I am today.
Simple and straight to each point. Conclusion with a quick recap. Best article for trading, and thank you so much.
You are welcome, Kapil!
Hi Rayner
You mentioned 20MA, 50 and 200
Is it a simple MA or exponential?
Hey Vea,
You can use any of them.
Cheers.
Dear Rayner,
This your teaching is very clear and good, I have only read ‘how to identify a trend’ and it will help me in my trading.
I will give more commentvdhen I read the other parts.
Thank you, Joseph!
VERY INFORMATIVE
I AM FROM INDIA
Thank you, Vikash!
Though am still on demo trading, but your revelation on strategy is mind blowing. When i started I don’t understand what I was doing but now, I have better understanding. Thanks.
I’m so glad to hear that, Blessing!
Your Books Are Priceless. They Are to be cherished like gold. They contain Secrets worth millions. You are really a teacher. A good one at that. I will see you one day when the Vistas are clear enough.
Awesome, John!
This is great stuff. Really appreciate you taking time to publish posts like this.
I’m glad to hear that, YT!
Your all articles are very informative and easy to understand
Thank you, Dr!.
Great job, God bless you.
Thank you, Bellow!
Sir you are saying healthy trend what it basically means?
Hi, Tushar!
A healthy trend is when the market has a healthy pullback and remains above the 50MA.
Hope it helps. Cheers!
If trend looks upward in 1min; 5min; 15min; 30min; & 1hr and in another chart 30min significantly uptrend , what do i do place a buy position?, thanks.
Great explanation. Easy to understand. Thanks for sharing your knowledge…..
You’re welcome, Anil!
Happy learning!
great
Simple and easy to read
Thank you for this
You’re most welcome, Kenneth!
Loving it
Thanks, Ben!
Oh yes boss you good sir
How do you target the peak of a spike in price action?
Rayner, hello my friend, I’m a big fan of your Videos and going through this just made technical analysis very easy.Thank you
Hey there, Brian!
Jarin here from TradingwithRayner Support Team.
I am glad to know Rayner’s blog helped you in your technical analysis!
Cheers!
Hey hey my friend,
you know the way you explain it simple and clear, it easy to understand it.
thank you so so so much RAYNER
You are most welcome, Thanda!
Glad to help!
Cheers!
Thank u well explained trendline identification. I usually observe higher high and Lower low and also mov
That is good to hear, Srinivas!
Cheers!
To identify the trend , zoom out in respect to the type of trader you are and time frame you trade , check if prices are making higher high or lower highs more importantly you can use the line to identify the highs and lows
Great! Thanks for sharing your thoughts, Emilo!
These are very insightful lessons. Rayner Teo is a greatly generous trading teacher of this time.
Thanks for your kind words, Kazeem!
Thank you for everything and your time
You’re welcome, Zinzile!
I was really lost in the market still I find out about you boss keep doing the good work boss
Thanks, Aaron!
Insightful
Thanks, Dominic!