When it comes to Forex indicators, many traders are guilty of this deadly mistake…
They don’t know how Forex indicators really work.
And that’s a problem.
Why?
Because if you don’t know how a Forex indicator works, then you don’t know when is the right time to use it.
If you don’t know when is the right time to use it, then you won’t use it correctly.
If you don’t use it correctly, then you’ll lose money consistently.
Agree?
So before you use any Forex indicators or even determine the best indicators for forex, you must know the purpose of it.
So, what’s the purpose of it?
Well, Forex indicators are useful for 3 things…
1. Identify the market condition
You can find out if the market is in a trend, range, having a low/high volatility, etc.
And filter for market conditions you want to trade it (like trend trading).
2. Area of value
You can identify areas on your chart which offers favorable risk to reward.
These are areas of value that allows you to “buy low and sell high”.
3. Entries & Exits
You know the exact trigger which gets you in and out of your trades (without subjectivity).
Now you might be thinking…
“Why don’t you tell me which are the best trading indicators so I can ignore everything else?”
Here’s the thing…
There’s no such thing as best trading indicators because every indicator has different purposes.
It’s like asking which is the best car out there?
Well, it depends on what you’re looking for.
Speed?
Reliability?
Fuel efficiency?
You get my point.
Here’s an example…
If you want to ride a trend, then indicators like Moving Average and Donchian Channel are ideal for it.
Or if you want to trade breakouts in low volatility market conditions, then indicators like Average True Range and Bollinger Bands work well.
In other words, the best trading indicators are those that meet your trading needs.
Because the bottom line is that if you don’t know what aspects of your trading you want to improve (i.e. defining trends, entry triggers, and exits), then put the question of finding the best indicators for forex out of your system!
Does it make sense?
Then in the next section, you’ll discover the different types of Forex indicators that work and how you can apply it to your trading needs.
Let’s go!
Forex indicators that work #1: Moving Average (MA)
The Moving Average is an indicator that averages the price data, and it appears as a line on your chart.
But remember:
Before you trade any Forex indicators, you must know the purpose of it.
So… what’s the purpose of Moving Average?
Well, it can help you:
- Identify the area of value
- Time your exits
Let me explain…
How to use MA to identify an area of value
Let me ask you:
Have you ever looked at a chart where the price just keeps going higher without retracing to Support and Resistance?
And you wonder to yourself…
“How can I capture a piece of the move?”
Well, the secret is this…
Support and Resistance won’t work well in a strong trending market because the price hardly retrace.
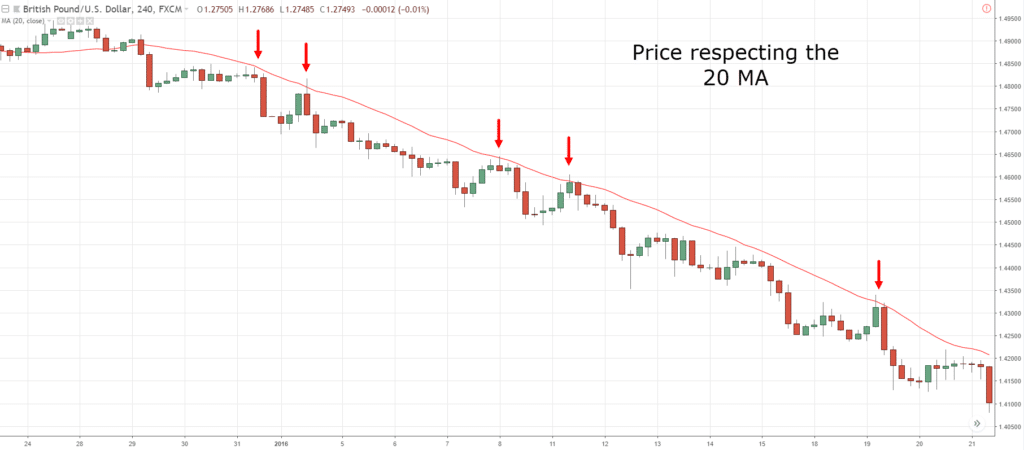
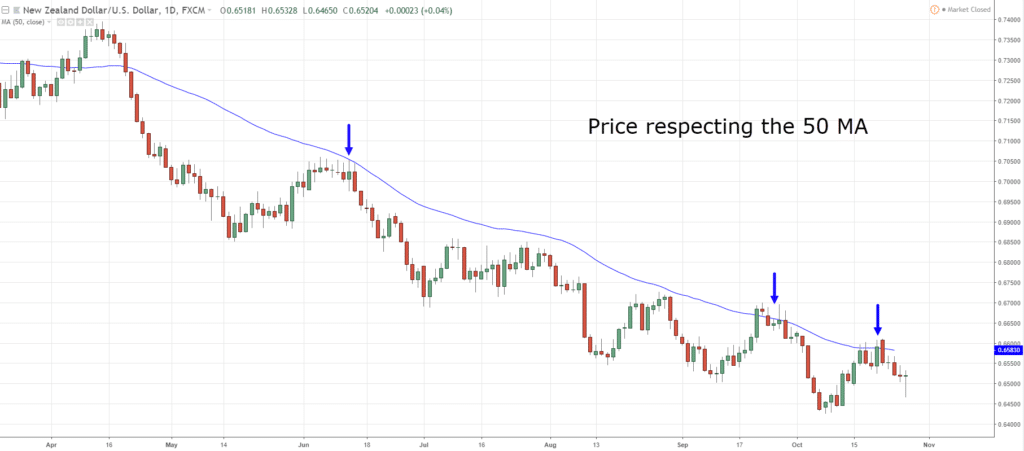
Instead, overlay a 20 MA (or 50MA) on your charts and you’ll see the magic.
Here’s what I mean…
EUR/USD Daily: The price respecting the 20MA over the last 6 months
Do you see it?
So here’s the lesson…
If you notice the price not “returning” to Support and Resistance area, try using the Moving Average to identify your area of value.
How to use MA to time your exits (and ride massive trends)
Finally, a Moving Average can help you ride massive trends.
Here’s how…
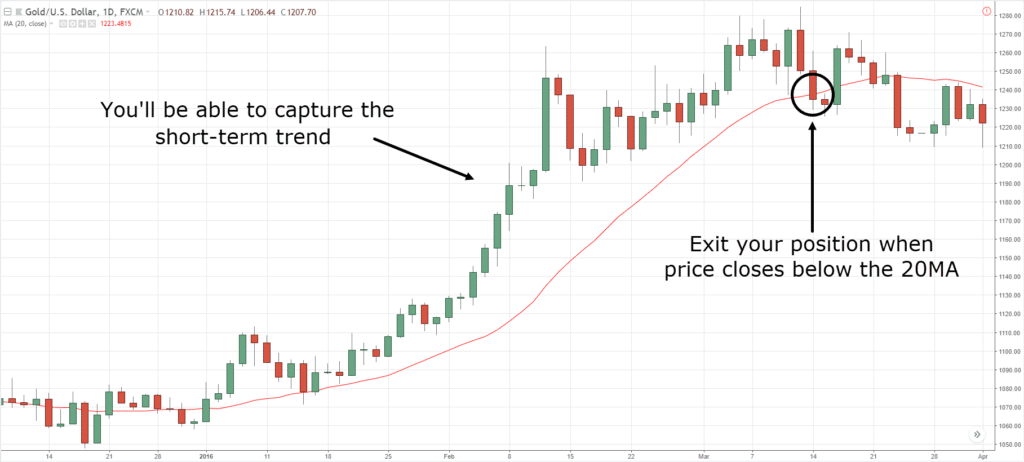
You hold on to your position as long as the price is above the Moving Average and exit only when it closes below it.
For example:
If you want to ride a short-term trend, you can trail your stop loss with the 20MA.
This means you’ll hold your position and exit the trade only when the price closes below the 20MA.
Here’s an example…
Pro Tip:
If you want to ride the medium-term trend, you can use the 50MA.
If you want to ride a long-term trend, you can use the 200MA.
Forex indicators that work #2: Average True Range (ATR)
The Average True Range is an indicator that measures volatility in the markets.
So if volatility is high, the ATR has a high value. And if volatility is low, the ATR has a low value.
But what’s the use of the ATR indicator?
Well, it can help you…
- Identify explosive breakouts about to occur
- Set a better stop loss
I’ll explain…
How to use ATR indicator to identify explosive breakouts about to occur
Here’s the thing:
The market moves in cycles, from a period of low volatility to high volatility and vice versa.
This means if the market has low volatility, then you can expect volatility to increase soon.
So, how do you use this knowledge to find explosive breakout trades before it occurs?
Here’s how…
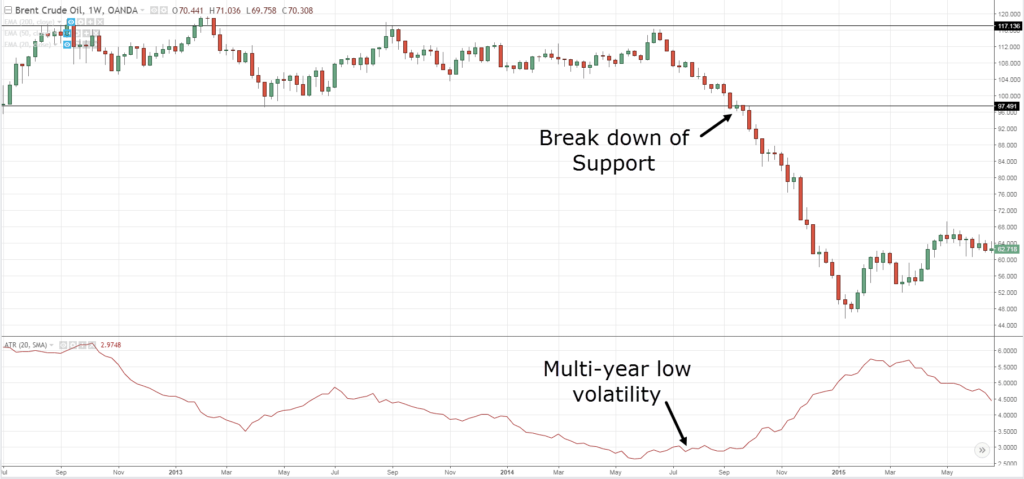
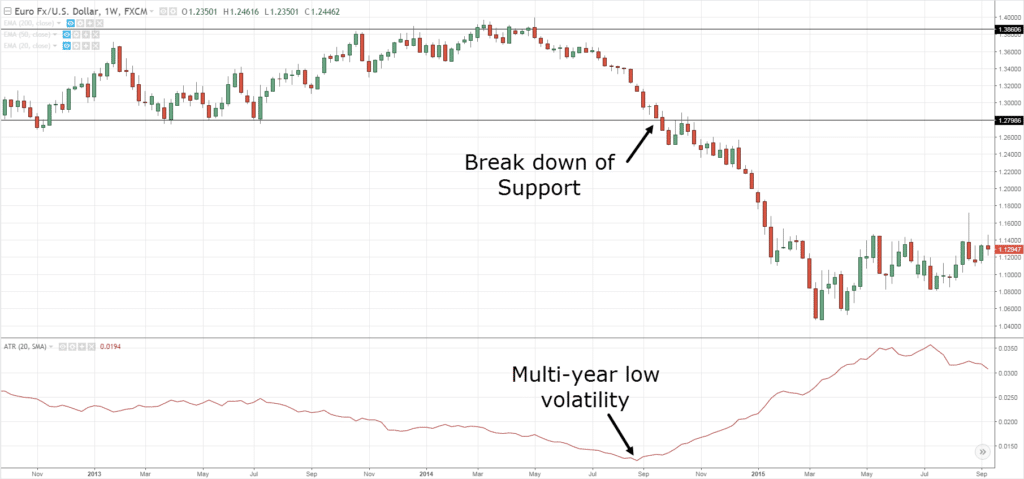
- Wait for volatility to reach multi-year lows (on the weekly timeframe)
- Identify the range during this time period
- Trade the break of the range
Here are a few examples:
Brent Crude Oil multi-year low volatility followed by a break of Support…
EUR/USD multi-year low volatility followed by a break of Support…
Do you notice how these explosive moves occur after a period of low volatility?
How to use ATR indicator to set a better stop loss
Let me ask you…
Do you always get stopped out of your trades only to watch the market reverse back in your favor?
It sucks.
But why does it happen?
Because your stop loss is at a level where everyone else puts their stop loss — which makes it easy to get stop hunted.
And where do traders usually put their stop loss?
Well, you don’t need to be an Einstein to guess it’s below Support and above Resistance, right?
So the secret is this:
Set your stop loss away from market structure (like Support and Resistance).
Here’s how…
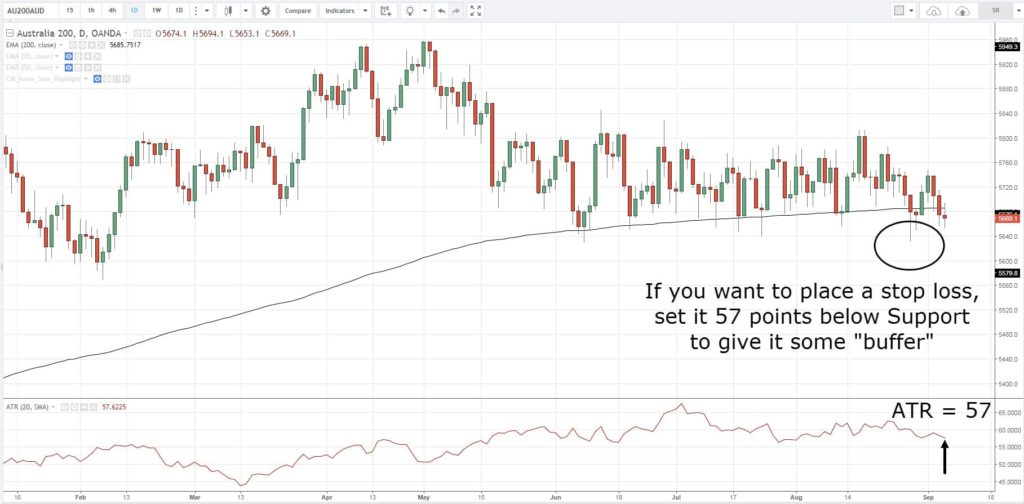
- Find out what’s the current ATR value
- Select a multiple of the ATR value
- Add that amount to nearest Support and Resistance level
So…
If you are long from Support and have a multiple of 1, then set your stop loss 1ATR below the lows of Support.
Or if you’re short from Resistance and have a multiple of 2 then set your stop loss 2ATR above the highs of Resistance.
An example:
Next…
Forex indicators that work #3: Donchian Channel
The Donchian Channel is a Trend Following indicator developed by Richard Donchian.
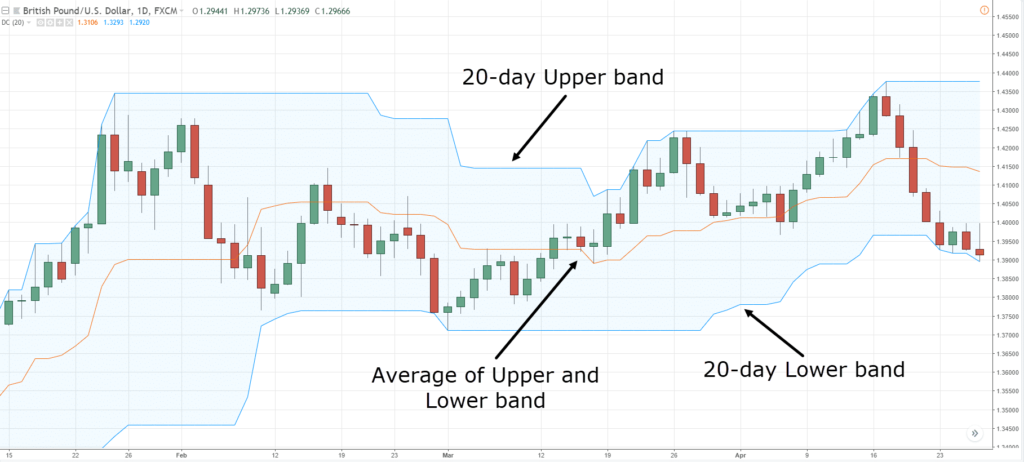
It has 3 parts to it:
- Upper band – the 20-day high
- Middle band – the average of the Upper and Lower band
- Lower band – the 20-day low
An example:
Now, you can use it to…
- Trade with the trend
- Act as an entry trigger
Let me show you how…
How to use the Donchian Channel to trade with the trend
Recall:
The middle band of the Donchian Channel is the average price of the Upper and Lower band.
This means you can use it as a trend filter to know whether you should be buying or selling.
Here’s how:
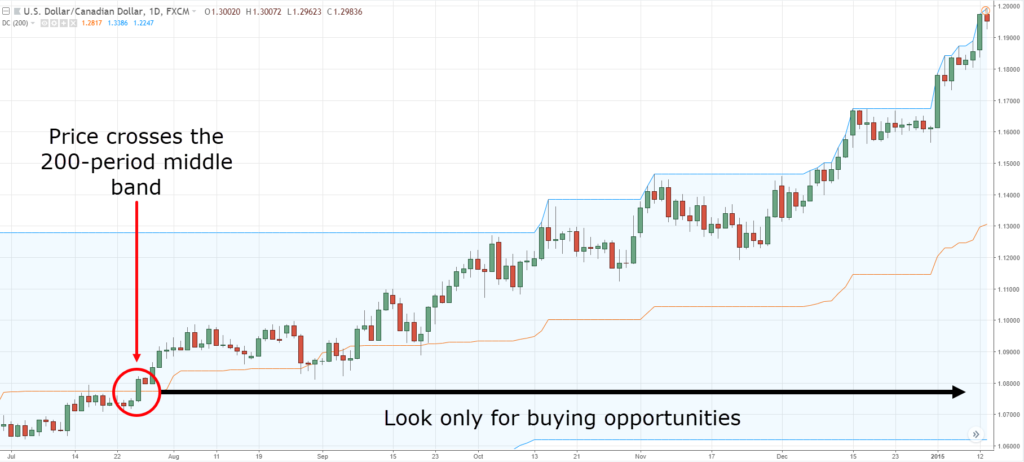
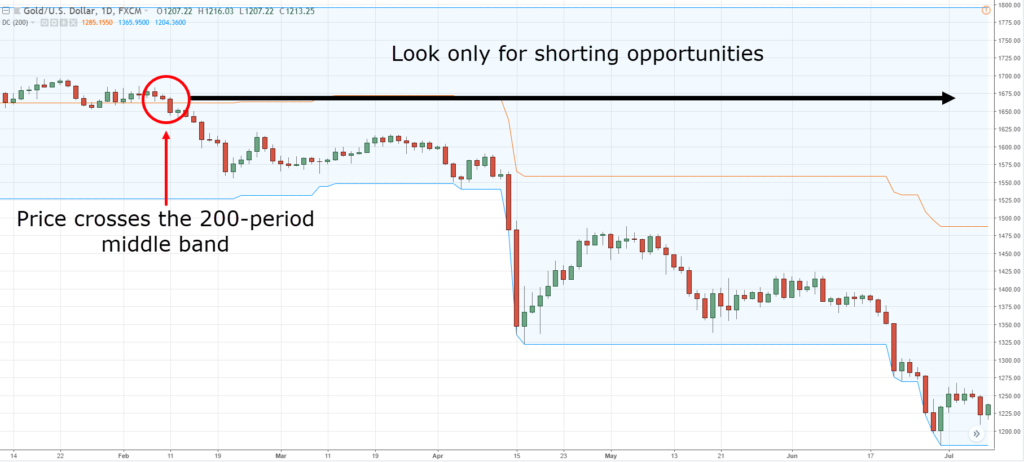
- Adjust the Donchian Channel to 200-period (to define the long-term trend)
- If the price is above the middle band, you look for buying opportunities
- If the price is below the middle band, you look for selling opportunities
Here’s an example…
Next…
How to use the Donchian Channel to time your entry and “catch” every trend
Here’s the thing:
Most of you want to trade with the trend but you can’t seem to do it.
Why?
Because you’re always waiting for a pullback which never comes — and if it does, you get stopped out of the trade (wtf).
So what’s the solution?
Learn to trade breakouts, especially when you’re dealing with a Forex entry indicator such as the Donchian Channel.
Because think about this…
For a market to trend, it must break out higher.
So if you trade breakouts, you’ll definitely get on board the trend.
Does it make sense?
So here’s how you can do it…
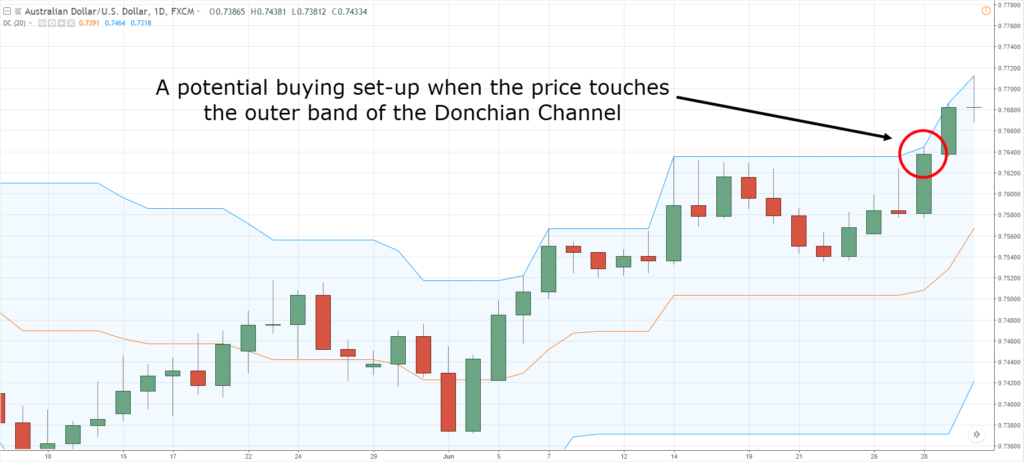
If the price “touches” the upper band of the Donchian Channel, you go long.
An example:
Now if you can do this consistently, you’ll catch every trend in the market — guaranteed.
Forex indicators that work #4: Stochastic
The Stochastic is a momentum indicator developed by George Lane.
You can use it to:
- Identify an area of value
- Act as an entry trigger
Let me explain…
How to use Stochastic to “predict” market turning points
A big mistake traders make is buying just because Stochastic is oversold — and only to see the price collapse even lower.
So here’s a better way to trade “overbought and oversold” signals…
- If the price is above 200-period moving average (MA), then look for long setups when Stochastic is oversold
- If the price is below 200-period moving average (MA), then look for short setups when Stochastic is overbought
The idea behind it is you’re trading with the trend, looking to buy when the trend is up and shorting when the trend is down.
Here’s an example:
Make sense?
How to use the Stochastic indicator to better time your entries
Now unlike chart or candlestick patterns where the entry can be subjective, the Stochastic indicator doesn’t give you that problem.
That’s because there’s no discretion for the entry.
It’s either YES you enter, or NO you stay out.
So if you’re the type of trader that is always unsure whether you should pull the trigger, then this entry technique is for you…
Here’s how…
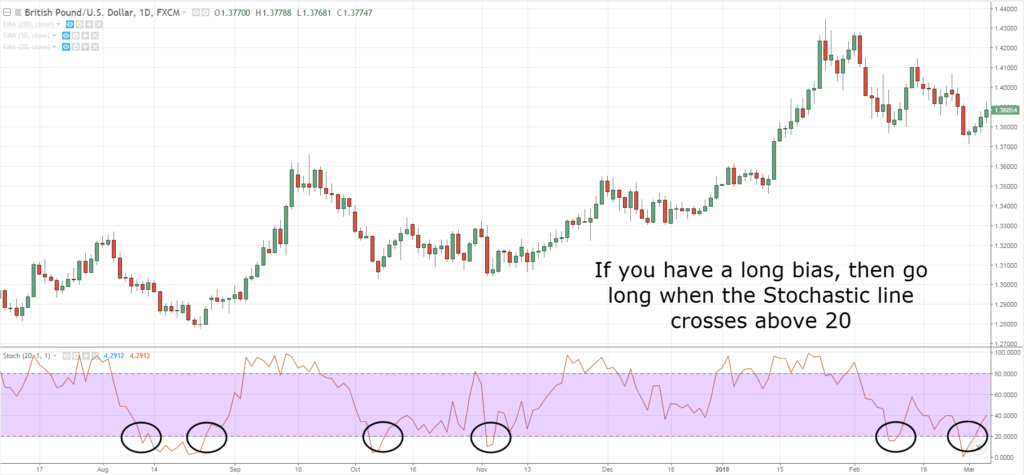
- If you have a long bias, then go long when the Stochastic line crosses above 20
- If you have a short bias, then go short when the Stochastic line below above 80
Here’s an example:
Now, what does this mean?
Recall:
The Stochastic indicator measures momentum.
That’s why when you see the Stochastic crossing above 20, it’s telling you bullish momentum is stepping in (and vice versa).
So that’s how you use the Stochastic indicator as a Forex entry indicator.
Note:
Don’t mistake this as a trading strategy because it’s not.
Rather, it’s an entry trigger to get you into a trade.
Forex indicators that work #4: MACD
The Moving Average Convergence Divergence (MACD) is a momentum and Trend Following indicator developed by Gerald Appel.
And if you use it correctly, it can help you:
- Identify momentum reversal
- Identify explosive breakout trades about to occur
Let me explain…
How to use the MACD indicator and identify momentum reversal
When I first started trading, I like to “chase” breakouts.
The more bullish the candles, the likelier I’ll buy the breakout.
However…
I was bleeding my account.
That’s when I realized I entered my trades “too late”.
I bought when the price is about to reverse in the opposite direction.
And this led to an AHA moment.
I wondered…
“What if I stopped chasing breakouts?”
“What if I took the opposite side of the trade?”
“What if I look to short when there’s strong bullish momentum?”
It worked much better!
However…
I had trouble explaining to traders what strong momentum is.
So…
That’s where the MACD histogram comes into play.
Here’s how it works…
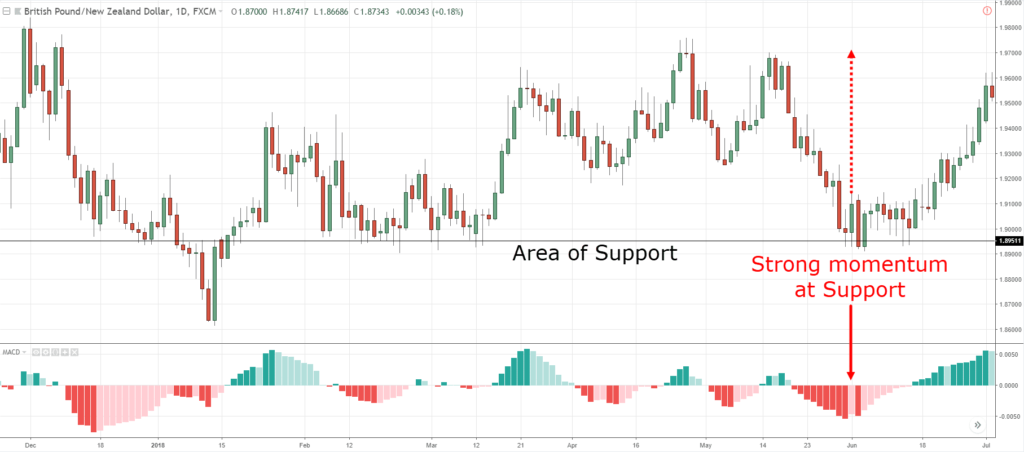
- Wait for the price to come into Market Structure (like SR, Trendline, etc.)
- MACD Histogram shows a strong momentum (you want to see a high peak/trough)
- Wait for price rejection before trading in the opposite direction
Here’s an example:
Next…
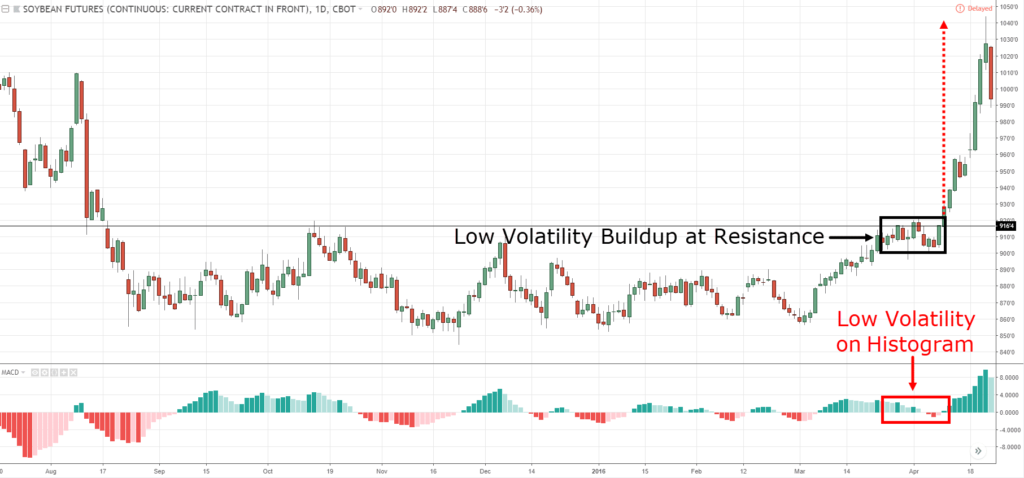
How to use the MACD indicator and identify explosive breakout trades about to occur
Here’s a fact:
Explosive breakouts usually occur when there’s low volatility in the market — you’ll notice the range of the candles gets small and “tight”.
But if you’re a new trader, this might not be easy to spot.
So, that’s when the MACD Histogram can help you.
Here’s how…
- The price comes into key Market Structure (like SR, Trendline, etc.)
- The MACD Histogram looks almost “flat” without any visible peak/trough
- Enter the breakout when the price breaks the Market Structure
An example:
Now…
You’ve learned the different types of Forex indicators and how it works.
Next, you’ll discover…
What’s the best forex indicator combination?
Here are 2 rules to follow when you want to combine Forex indicators…
- Every Forex indicator must have a purpose
- No duplicate indicators with a similar purpose
Let me explain…
1. Every Forex indicator must have a purpose
Every indicator on your chart must serve a purpose.
Whether it’s identifying the market condition, the area of value, or time your entry & exits.
Now if an indicator doesn’t have a purpose on your charts, remove it.
I don’t care how pretty it looks because we’re here to make money and not win the Miss. World of Forex Indicators.
Because this is the most crucial thing to iron out when building a Forex indicator strategy (and also to avoid analysis paralysis).
2. No duplicate indicators with a similar purpose
Here’s an example:
Let’s say you want to define the trend and you use Moving Average for it.
This means you do NOT another Forex indicator (like Donchian Channel) because the purpose is met by the Moving Average.
So, don’t make the mistake of having multiple forex trading indicators for the same purpose.
You’ll suffer from analysis paralysis as you get conflicting signals and you don’t know which one to follow.
Cool?
Conclusion
So here are the takeaways…
- Every Forex indicator must have a purpose, whether it’s identifying market conditions, an area of value, entry & exits, etc.
- There’s no such thing as best trading indicators because it doesn’t exist. Instead, the best indicators are the ones that meet your trading needs.
- When you combine different indicators, remember these two rules: 1) Every indicator must have a purpose 2) No duplicate indicators with a similar purpose
Plus, you’ve discovered the 5 types of Forex indicators that work and how to use it like a professional trader.
Now here’s what I’d like to know…
Which Forex indicators do you use and why?
Also, how many Forex trading indicators have you tried in the past but lost money?
Leave a comment below and share your thoughts with me.



This article is having extremely valuable information!!! Thank you Rayner…
You’re welcome, Raja!
I normally use MACD, Parabolic SAR, 10 period EMA & the Bollinger bands. The first three constitute the MACD professional strategy while the Bollinger band is just to help with the direction of the chart, i.e. if it is pointing upwards I buy while if it is pointing downwards, I open a sell position. Anyway, thanks for the insight into forex indicators that work.
My pleasure, Audrey.
Thanks for sharing!
Thanks alot for this insight into the world of indicators & all your great lessons.
I noticed RSI indicator was not discussed. Why?
I can’t possibly cover every indicator from A – Z man.
Great content, stay strong people look up to your for guidance on thier future
Thank you, Che.
Hi Rayner,
Please post a article on rsi also and how to use rsi with other indicators
May God bless you for taking your time to teach us how and best ways to trade, thank you. please I will like to Know which setup is best for the stochastic indicator?
There’s no such thing as the best setup for any particular indicator.
You need to know what’s your indicator purpose and then use it accordingly to meet your needs.
I was using the 5mA and 20mA with a combination of other indicators to trade it worked for a while made a couple of hundreds and after which I started loosing money I guess I was not disciplined
Right now I will use the just two 20 and 50mA just to trade trends
Remember, it’s not the settings of the indicators but using it for the right purpose to meet your needs — that’s what matters.
I use the MACD and ATR to trade because the MACD helps to enter a proper trade at the right time while the ATR helps to identify the price velocity in the market,i will like to ask a question on the point of entrying a trade, between 4hr and 1hr will first start a break out to know the other one will follow suit?
I’m not quite sure what you mean.
If you’re asking which timeframe to look at to know whether the breakout is real, then there’s no way to tell for sure since we’re dealing with probabilities.
Thank you very much sir, this is very imparting and informative.thanks.
My pleasure, Samuel!
Hello, Rayner.
Thanks for all your training materials.
Pls, what’s the meaning of Trading Style, Trading System and Trading Strategy.
And, I’m yet an newbie trader. I’ve blown out my account twice, but I’m still demo trading. I want to be able to develop a very powerful and profitable Trading Lifestyle. Pls, help me.
MACD, MA and Stochastic this has T.A.E all in it
Cheers
Hi Ray, thank you for the notes. I use the stochastic, rsi and the MA.
My pleasure!
It helps me a lot… Thank you so much Ray
My pleasure!
Thanks Rayner for this informative article on these 5 indicators I appreciate all your efforts to make us successful traders and I always look forward to your write ups. I only use Trend lines, Support/Resistance levels with candlestick patterns to practice but with this article now I think I will test the the indicators, I won’t forget to mention MA 200 for market direction that I use also.
Thank you for sharing!
Clear & simple explanation Superman. Thanks. Positive correlation on multiple indicators minimise trade risk and increases probability. I use RSI & Stochastics but both have to be extreme overbought or extreme oversold ath the same time = my edge to consistently enter the trade.
Thanks for sharing man!
Brilliant and very valuable. Thank you Rayner.
You’re welcome, Harry!
Great work rayner i learned many things about forex indicators
Awesome!
Awesome Rayner,Thank you very much..Now I learn a lot about Forex indicator
Cheers
Thank you Rayner for giving your great knowledge wisdom and support, in a cool style keep making a difference.
Hey Keith,
You are most welcome!
hi Reyner, your guides really helping my trading, i am using ma & stochastic, i want to use supertrend by replacing one of these, can u suggest which indicator to replace? ma or stoch? i am confused to chose between two
Hi Nagaraj,
The MA is using to determine the trend direction/Dynamic S/R
The Stochastic is best used in a ranging market or trending market.
You need to know the use of each indicator and when to use them.