The 50 Day Moving Average Trading Strategy Guide
Here’s the deal:
There are endless possibilities when it comes to moving average.
You’ve got the 50 day moving average, 100 day moving average, 200 day moving average, etc.
So you’re wondering:
“Which is the best moving average?”
“What is the best combination of an EMA trading strategy?”
Well, there’s no best moving average out there because it doesn’t exist (as it depends on your objective current market structure).
But in a healthy trend, the 50 day moving average is king.
And that’s what you’ll discover in today’s post, so read on…
What is 50 day moving average and how does it work?
First, what’s a Moving Average (MA)?
The Moving Average (MA) is a technical indicator that averages out the historical prices.
For example:
Over the last 5 days, Google had a closing price of 100, 90, 95, 105, and 100.
So, the average price over the last 5 days is:
[100 + 90 + 95+ 105 +100] / 5 = 98
This means the 5 day moving average is currently at $98
And when you add these 5 period MA values together, you get a smooth line on your chart.
What about the 50 day moving average?
Well, the concept is the same.
All you need to do is add the closing price over the last 50 days and divide by 50, that’s it.
Of course, you don’t have to do it manually because all trading platforms allow you to add the 50 day moving average to your chart.
Here’s how to do it on TradingView:

And here’s how it looks like: A 50 day moving average on the chart
Pro Tip:
A Golden Cross occurs when the 50 day moving average crosses above the 200-day moving average.
How to use the 50 day moving average and identify profitable trading opportunities
Most traders are familiar with buying Support and selling Resistance.
Now, this EMA trading strategy is useful when the market is in a range or a weak trend.
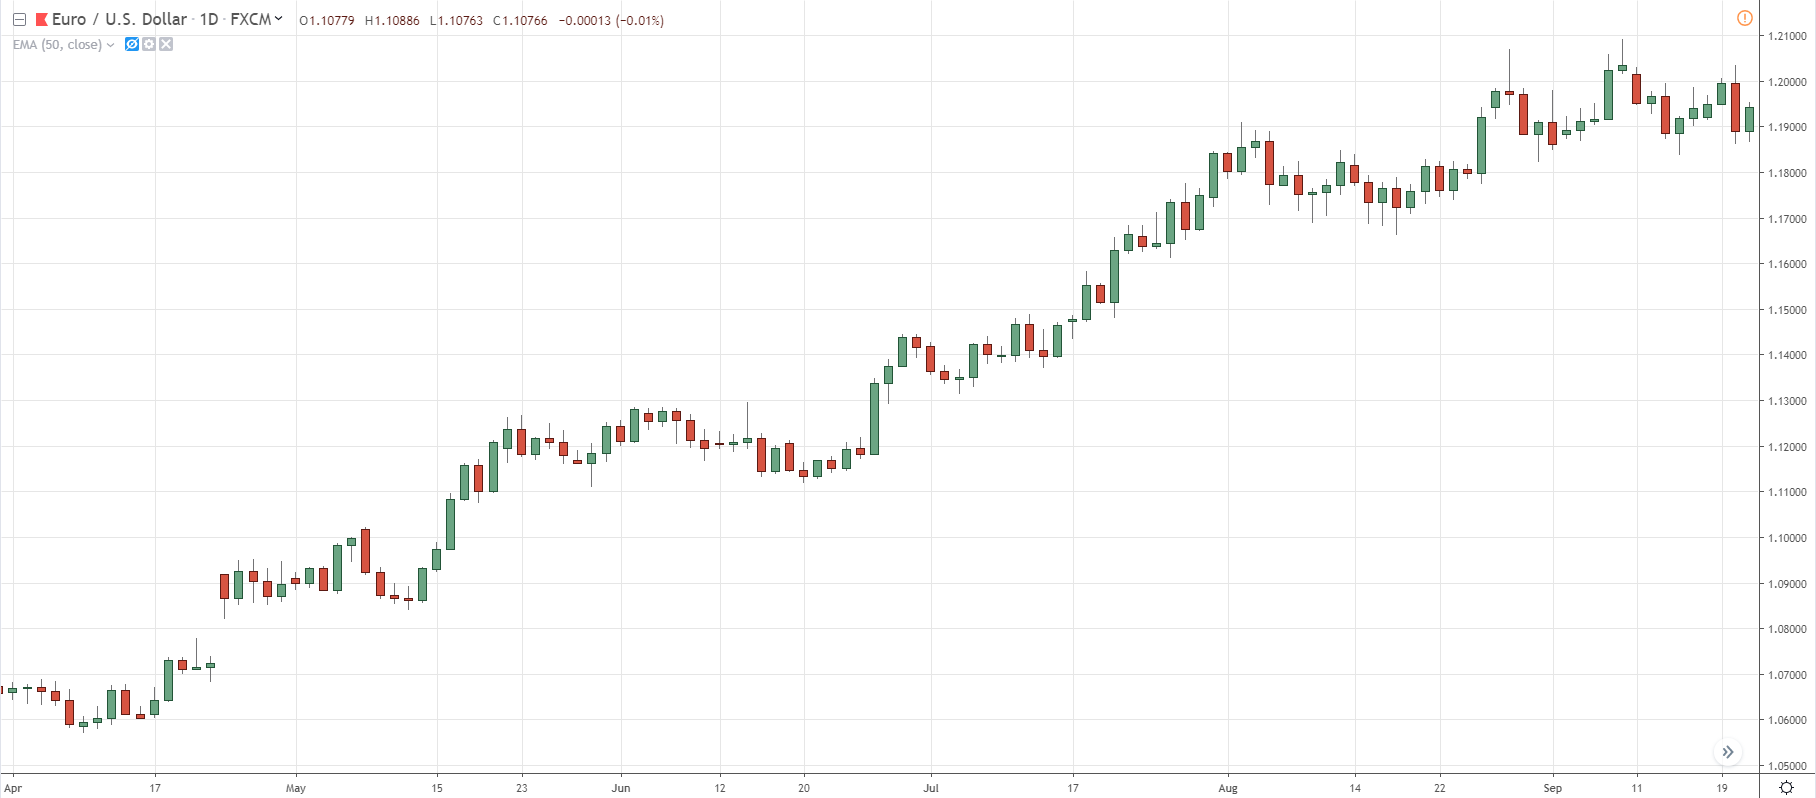
But what if the market is in a trend like this?
As you can see:
The market doesn’t re-test Support and if that’s what you’re looking for, you’ll be on the sidelines for a long time (while the market continues higher without you).
So, how do you trade in such a market condition?
Is there a 50 EMA trading strategy for it?
Well, you need to find a new area of value — and that’s where the 50 day moving average comes into play.
Let’s look at the same chart earlier but this time, overlay with the 50 day moving average…
See the difference?
(Also, it’s normal for the price to exceed the 50 MA as we are identifying an area of value, not a specific price level.)
And after the price re-tests the 50 day moving average, you can use reversal candlestick patterns (like Hammer or Bullish Engulfing Pattern) to time your entry.
(I’ll share more on this later.)
For now, let’s move on…
How to use the 50 day moving average to ride massive trends (and not get stopped out on minor pullbacks)
Here’s the thing:
When it comes to riding trends, even with the 50 day EMA, many traders get stopped out on the slightest pullback.
Why?
Because they trail their stop loss too tight!
It’s kind of like chasing a girl. If you stay too close to her, she’ll run.
But if you give her space, you’ve got better odds of winning her over.
So how do you do fix it?
Well, you’ve got to learn how to let go and give your trade room to breathe.
And one approach is to use the 50 day moving average to trail your stop loss.
This means…
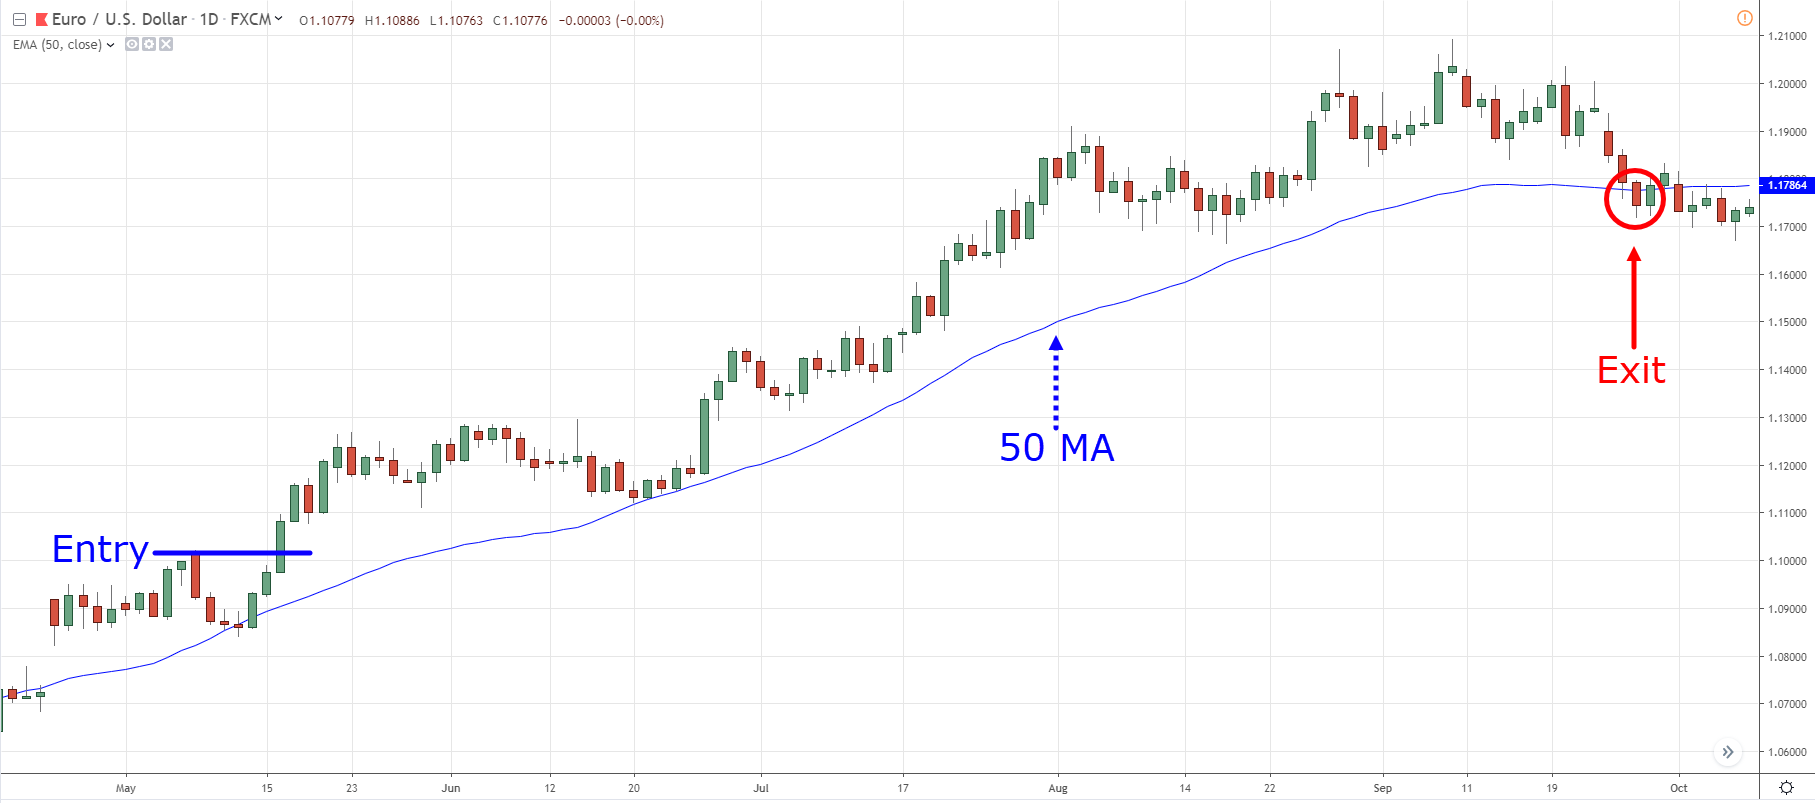
If you’re long, hold the trade as long as the price remains above the 50 day moving average, and exit only when it closes below it (and vice versa for short).
An example:
Pro Tip:
If you want to ride trends in the market, then you must give back open profits. There’s no other way around it whether you trade the 50 day ema, 60 day, 100 day, etc.
How to use the 50 day moving average and filter for high probability trend reversals
When you’re trading trend reversals, your entry timing is critical.
If you’re too early, you risk getting stopped out.
If you’re too late, you miss catching the big move.
So, how do you time your entry such that you’re not too early or too late?
Well, you can use the 50 day moving average to act as a trend filter.
Here’s how…
If you want to go short against an uptrend, wait for the price to close below the 50 day moving average before you look to short (and vice versa for long).
Now you might be wondering:
“What if the price didn’t close below the 50 day moving average, can I still short?”
No.
You remain on the sidelines. Let the 50 day moving average act as a trend filter and tell you when it’s “safe” to go short.
Pro Tip:
To increase the probability of your trades, make sure the price leans against the higher timeframe market structure.
This means if you’re looking to short, you want the price to be at Resistance on the higher timeframe.
If you want to learn more about it and a 50-day moving average strategy, check out The Trend Reversal Trading Strategy Guide.
Do you always enter your trades too late? Here’s why (and how to avoid it)
Let me ask you…
Do you always enter your trades too late only too realized you’ve bought at the highs?
The next thing you know, the market does a pullback at the 50 day EMA, and you got stopped out.
The worst part?
Your analysis is actually correct, and the market continues to move higher without you.
Ouch.
And why does it happen?
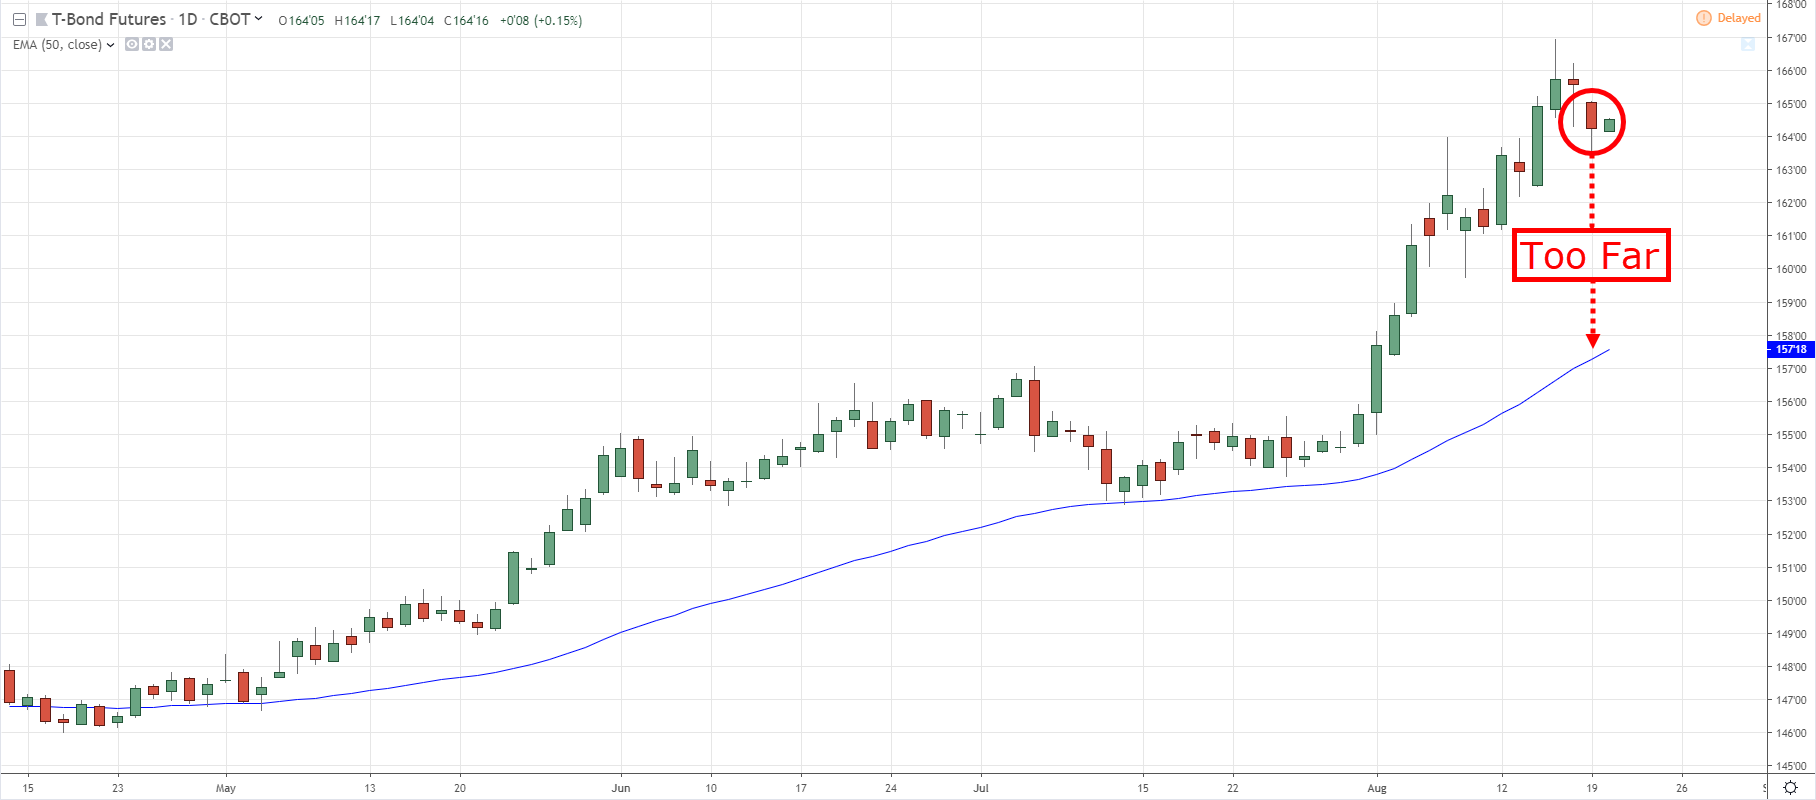
It’s because you enter your trades far from an area of value (when the price is “overstretched”).
So, how can you avoid it?
The secret is this…
You want to trade near an area of value, not far from it.
For example:
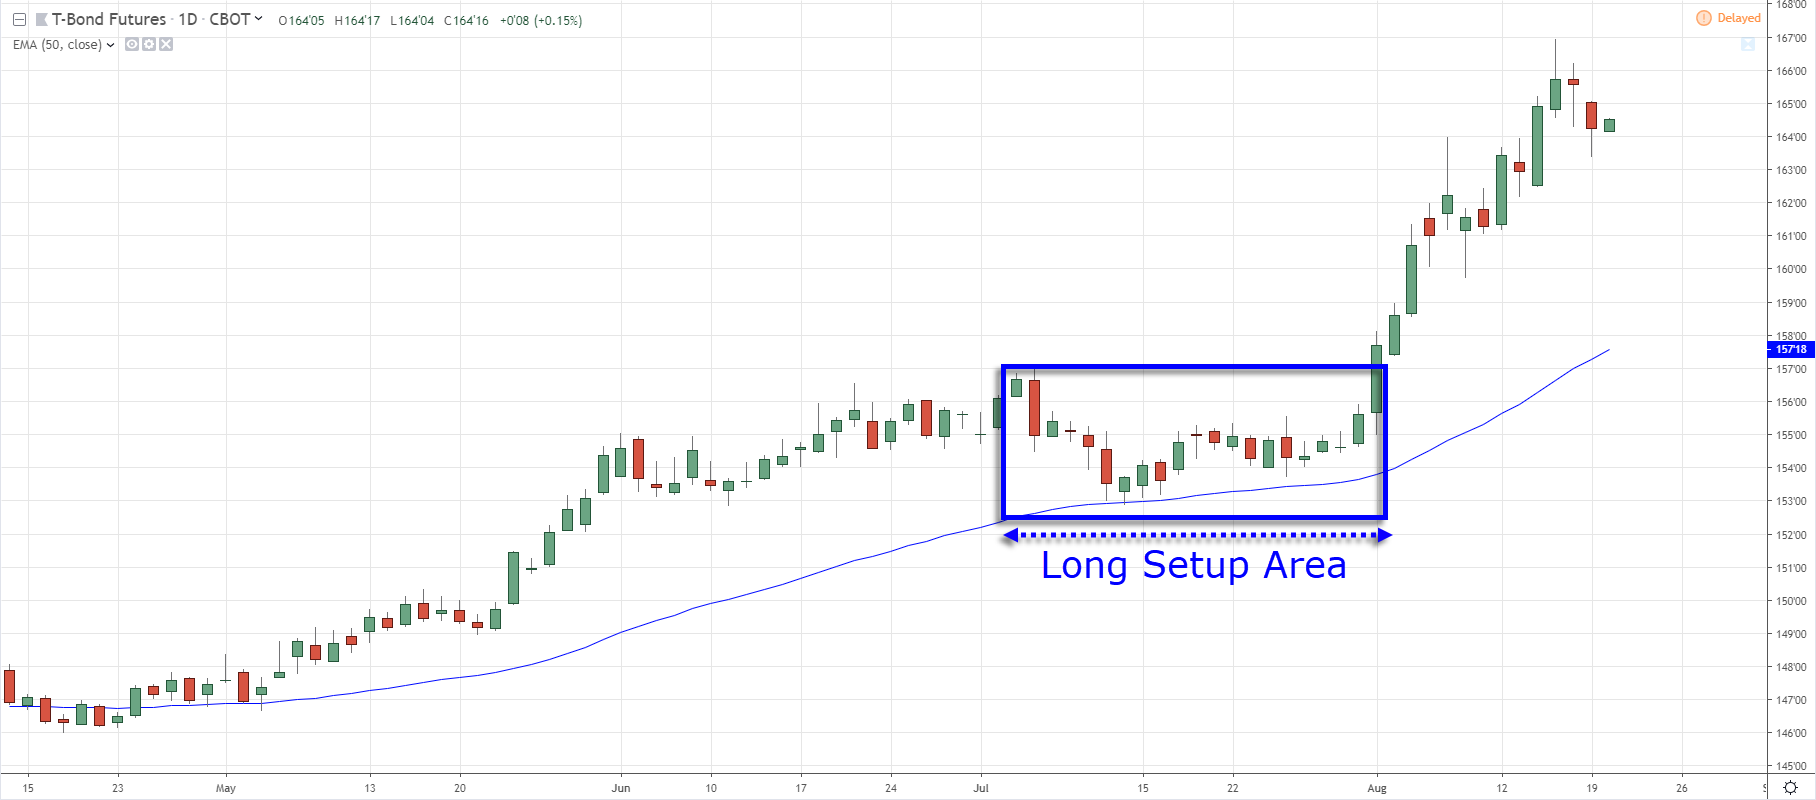
In a healthy trend, the area of value is at the 50 day moving average.
This means you want to enter your trades near the 50 day moving average so you can increase your winning rate and profit potential.
Here’s what I mean…
And here’s where NOT to enter a trade…
Pro Tip:
In a strong trend, the area of value is at the 20 day moving average.
In a weak trend, the area of value is at Support and Resistance area.
50 day moving average: How to better time your entries with deadly accuracy
There are two techniques you can use:
- Reversal candlestick patterns
- Trendline break
I’ll explain…
#1: Reversal candlestick patterns
Recall:
The 50 day moving average acts as an area of value in a healthy trend.
So when the price re-test the 50 day moving average, what now?
Well, you want to see buying pressure stepping to “confirm” the market is ready to move higher.
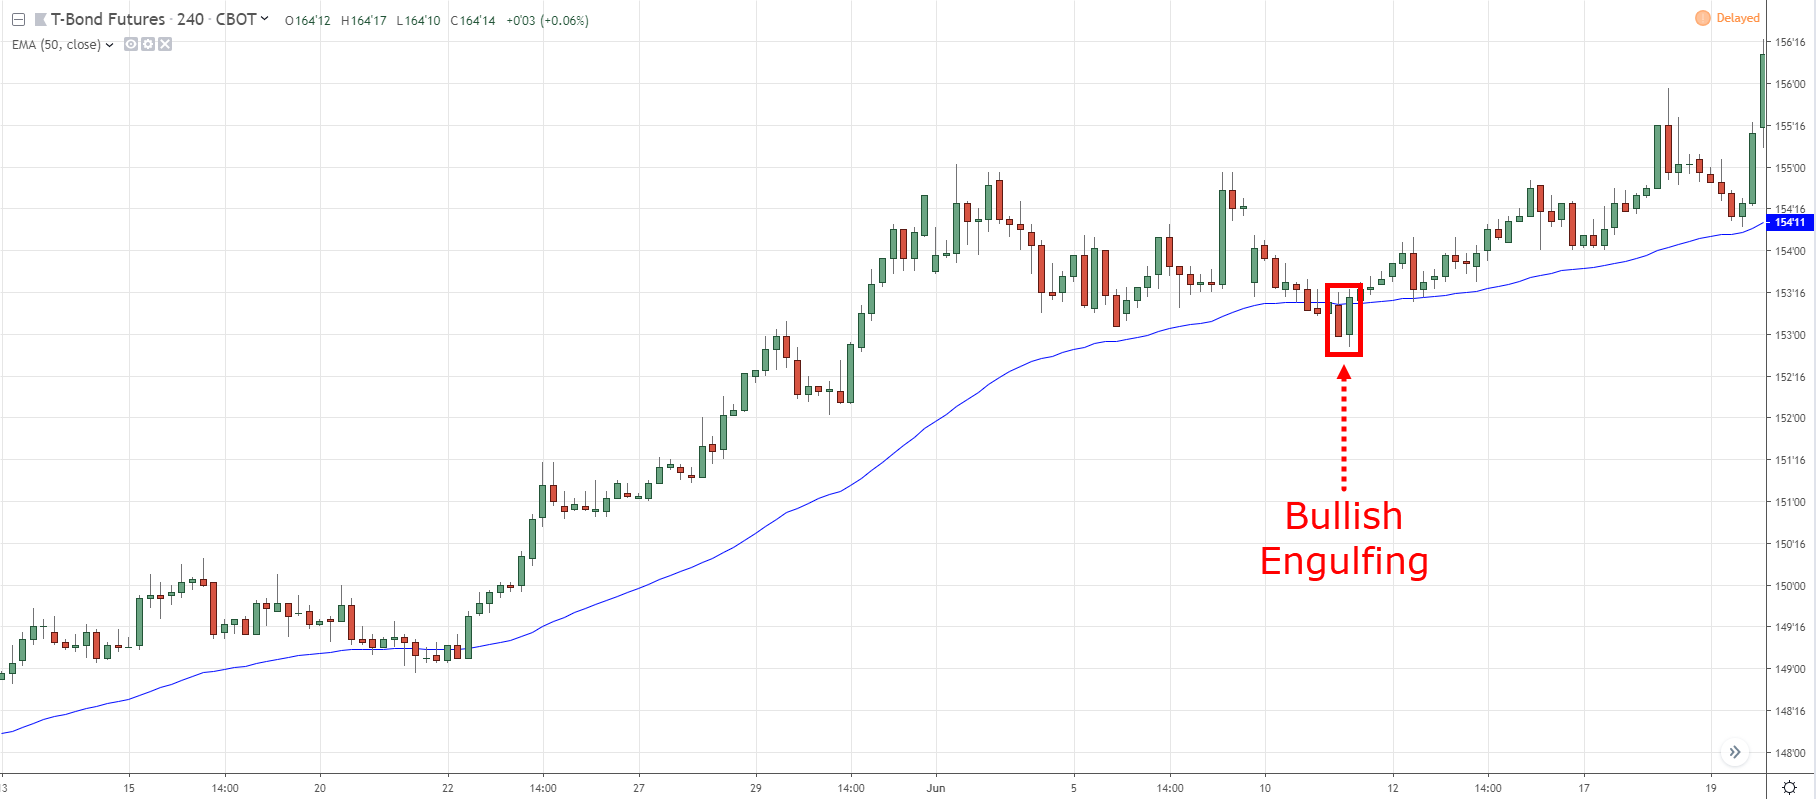
And this can be in the form of reversal candlestick patterns like Hammer, Bullish Engulfing, etc.
Here’s what I mean…
However:
There are times on this 50 ema strategy that you don’t get any reversal candlestick patterns and the price continues to move higher.
That’s where the next technique comes into play…
#2 Trendline break
Here’s how it works…
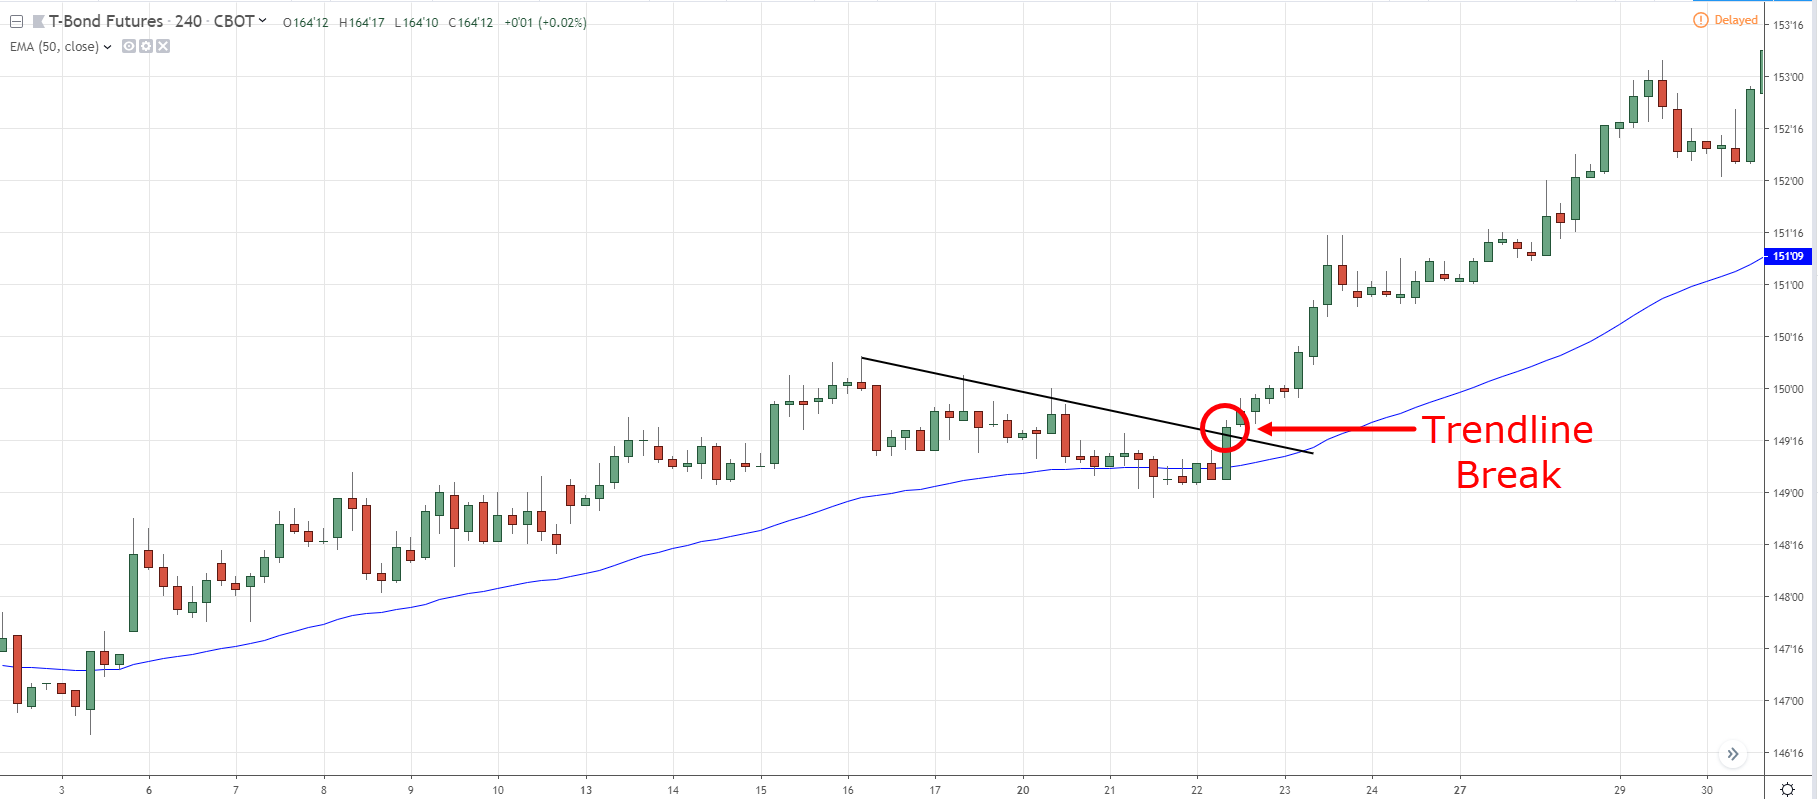
When the price does a retracement towards the 50 day moving average, you can draw a “mini trendline” pointing towards it.
Then your entry trigger occurs when the price breaks out of the “mini trendline”.
Here’s an example:
Next, let’s combine what you’ve learned and develop a 50 day moving average strategy.
Read on…
50 day moving trading strategy that works
Disclaimer: Please test this trading strategy first before risking your own money.
Now, the idea behind this trading strategy is to capture one swing in a healthy trend.
Here’s how it works…
- Identify a healthy trend where the price respects the 50 day moving average
- If there’s a healthy trend, then wait for the price to re-test the 50 day moving average
- If there’s a re-test, then look for a valid entry trigger (like reversal candlestick patterns on trendline break)
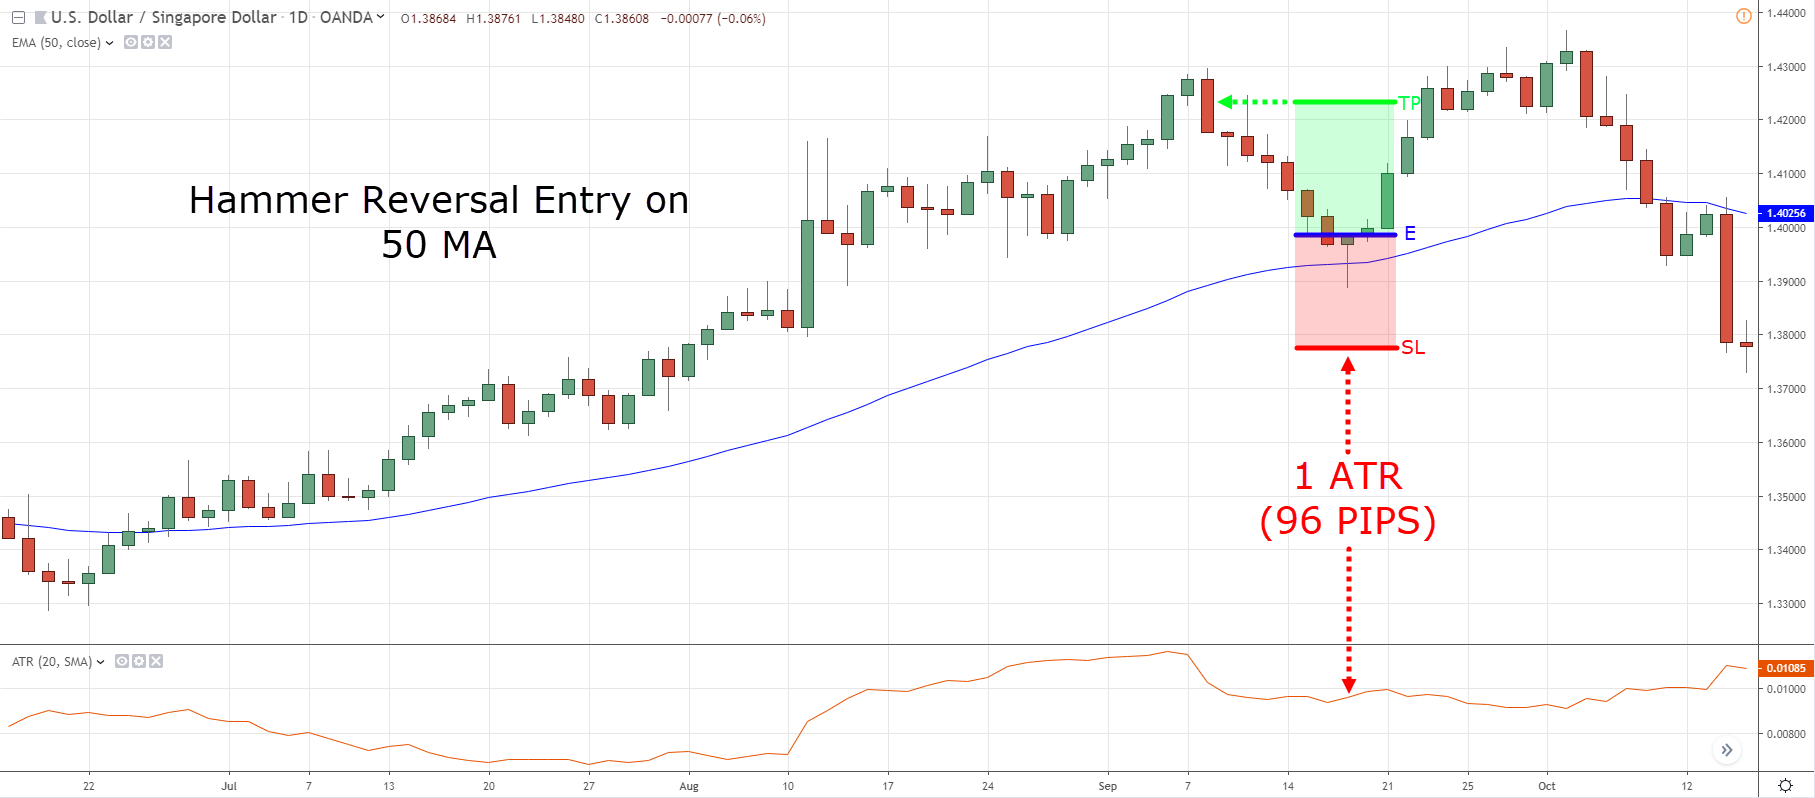
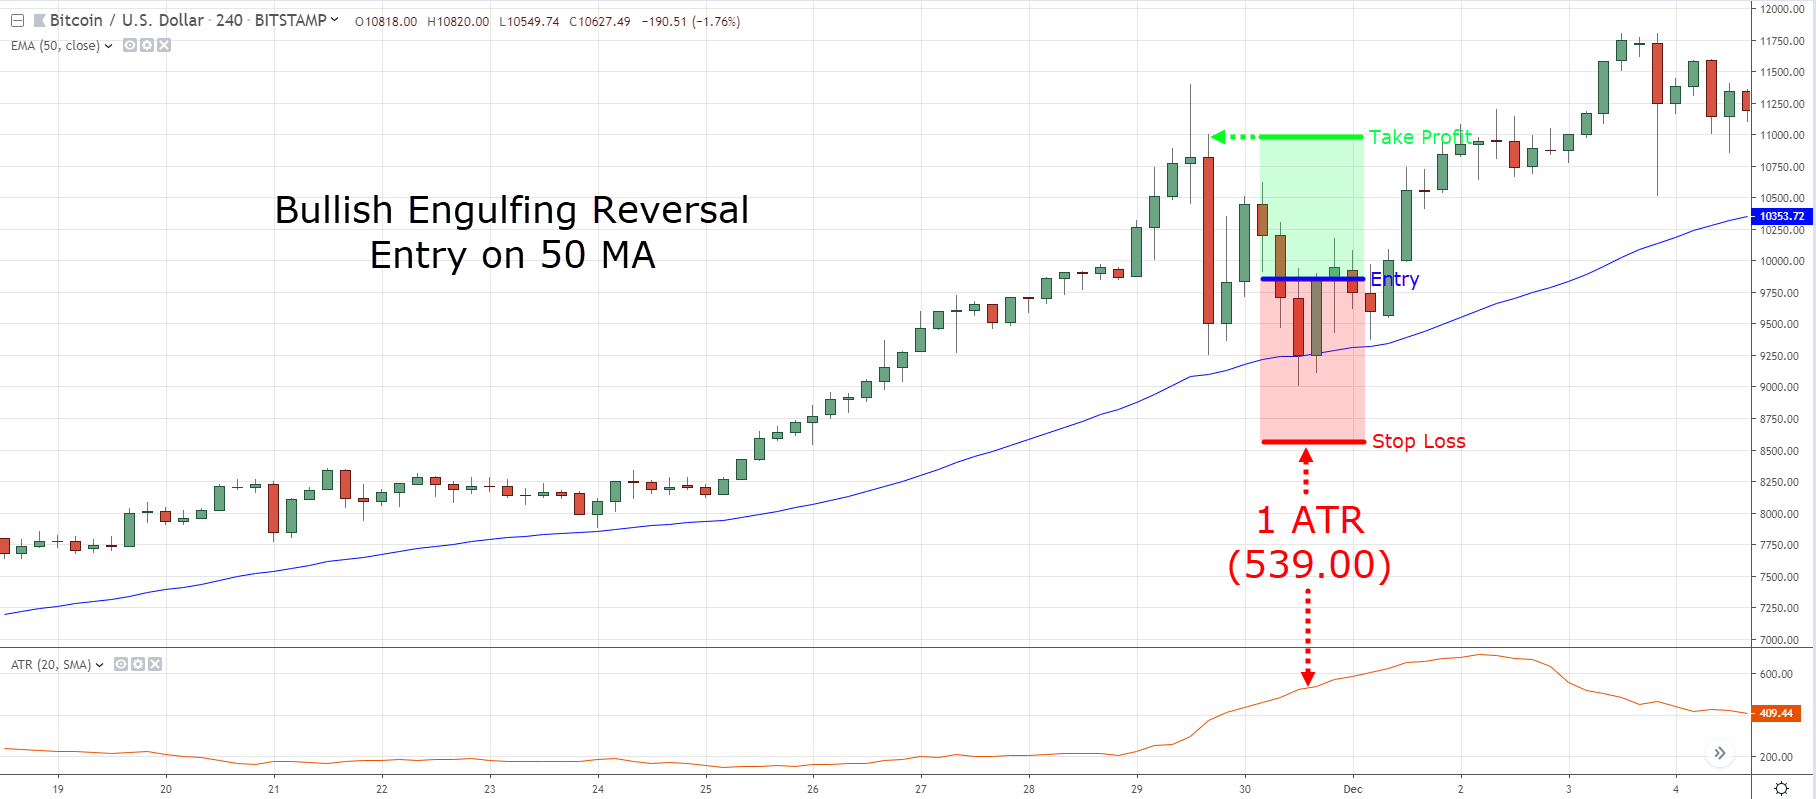
- If there’s an entry trigger, go long on next candle open and set your stop loss 1 ATR below the swing low
- If the price moves in your favour, exit before the nearest swing high
Here are a few examples…
Winning trade on USD/SGD Daily:
Winning trade on BTC/USD 4-Hour:
Losing trade on EUR/USD Daily:
This 50 ema strategy is pretty some, right?
Pro Tip:
You can tweak this 50 day moving average strategy to ride a massive trend.
All you need to do is use a trailing stop loss instead of a fixed target profit.
Conclusion
So here’s what you’ve learned:
- In a healthy trend, the 50 day moving average acts as an area of value to find profitable trading opportunities
- You can trail your stop loss with the 50 day moving average to ride massive trends
- If the price is too far from the 50 day moving average, it’s probably too late to enter. Wait for the price to make a pullback before looking for entries
- If the price is at the 50 day moving average, you can use reversal candlestick patterns or the trendline break to time your entry
Now it’s your turn…
How do you use the 50 day moving average?
Have you tried a 50 EMA trading strategy before?
How did it go?
Leave a comment below and share your thoughts with me.




The area of value mostly works if it is the first, second or third pullback to the 50 days moving average. From the 3rd pullback and onwards it becomes risky and the market does whatever it wants. You may also want to check the higher timeframes consistency with the one you use and also the lower timeframes to time your entry.
Thank you for sharing!
Can you use 50 MA on shorter time frames like 1 minutes, 5 minutes, etc.?
so simple… thanks
cheers
Excellent article to adopt and follow religiously in trading………………Thanks & Regards.
You’re welcome!
Nice
The contents of the article are very clear and understandable! These contents somewhere else you can’t get them for free, thanks Rayner for your commitment and hardworking, I really appreciate your work!
I’m glad to help out, cheers.
Hey Rayner, isn’t discretionary trend following and systematic trend following strategies correlated approaches to trade the markets? Isn’t systematic trading requires large capital to start with compared to discretionary trading? Your explanations will be helpful and appreciated.
Thanks
Yes they will be correlated if you trade them on similar timeframes and markets.
Both require capital to trade, and systematic TF would require much since you’ll likely have more positions on.
If I want to trade both systematic and discretionary TF, what do you suggest since these methodologies are correlated?
I prefer to combine a trendline from a higher timeframe with the ema55….waiting for the break of the trendline and crossing the ema is quite safe – for exits I very often take the next fiboncci level….
Thanks for sharing!
I trade on the 5 and 15 minute timeframe is the 50ma valid on those too?
You can apply the concepts and verify it for yourself.
use 30min I think its good
I used 50MA in simply term without much knowledge but your writeup has really helped me with the correct timing.
When I use 50MA, didn’t really consider area of value, all I did was since price is above or below the MA, I take my trade of long or short..
But Rayner my question is,
Do I have to use this 50MA on a specific timeframe or any one goes ?
I use it mainly in healthy trends as I find it works best during such market conditions.
Yes , does the 50MA work on any time frame? Or it’s specific to long term or short term?
You can apply the concepts to a different timeframe. But don’t take my word for it, verify it yourself.
cheers.
Brialliant writup.. Can u pleaae focus if I can use stochastic with 50MA. A bullish candle at 50MA with stochastic crossing above 20
I’m gonna back-test your strategy but between you and I; I like it already because you are one of my favorite YouTube Forex-coach…thank you so much
Please do and let me know how it works out for you. cheers.
Thanks so much for a clear content, which broker do you use for trading?
Hey Rayner, Since I started commenting my thoughts in the blog posts you are sharing, I have found it difficult to get notified whenever someone else comment on the same post, Is there any option I can use to get notification if someone comment or reply to my comments once I switch ON internet connection? If isn’t available can you make it to make our life easier?
I’ll look into it…
Thank you Rayner, i have used this and it worrks, im trading hourly timeframes , works well for me. Are you going to post price action patterns like head and shoulders pattern and so forth , im really interested in learning those. Cheers
I’ve got articles on it, check it out… https://www.tradingwithrayner.com/category/blog/chart-patterns/
Thanks for this.
My pleasure!
You are the answer I’ve been trying to look for.. Keep up you are not selfish. Of All I learned 70% is from your videos and e-books
Glad to help!
Hi Raynor can you tell me if you can use this strategy from the one timeframe or do you need to check other timeframes for trend or phases.
Should you always check the higher timeframe first before placing your trade even once it touches the 50 ema.
Hi Rayner,
Thanks a lot for ur dedication in helping new traders….anyway does timeframe matter? If it does what is the best time frame..thanks
Rayner should we use moving avg or ema.. how would it be if we use Ema .. please advise ..
Hi Rayner,
Jus now I happened to watch your video on candle sticks… Had watched few others videos as well but u r special in catching what’s that implies to the watchers in trading… Thank you… Following you… Got the books… Vl get back to you… Gifted to follow u..
You’re welcome, Ramesh!
It was very helpfull.
Cheers
Hey Rayner. I m your Fan from India. Thanks for your lovely insights.
Which one is more accurate in these set up? 50 EMA or 50MA. Thanks in advance
There’s no such thing as best or more accurate settings.
Your teaching is always amazing, I just love you, may you increase in knowledge and understanding as never before. Thanks so much
Hey Emmanuel,
I’m glad to hear that!
A very good article Rayner… Still learning..
Hi Isaac,
Thank you!
Really appreciate your work Rayner, it’s very helpful and the best i’ve seen. Just a suggestion. The red/green candles,or even brown, are very difficult to see for people who are red/green colour-blind: about 10% of the male population. Any other(distinctive) colours are fine. Also appreciate your clear expression. Thanks again for your efforts.
Hi Geoff,
Thank you!
Thank u lot
Hi Arul,
You are most welcome!
Thanks Teo for insight…
my trading are improving day by day
Hi Massy,
I’m glad to hear that!
Thank you Rayner. Your strategy is very crisp and clear and you dont leave any room for confusion. I will definitely use this stategy for my swing trading.
I’m glad to hear that, Chethana!
What is ATR and how to set SL?
Hey Manish,
If you are new to trading check out the academy.
https://www.tradingwithrayner.com/academy/
Cheers.
Can I also use it for indicies?
Yes! Timothy.
Recently started reading your books and articles and watching your youtube videos. The way you explain and demonstrate everything is done to perfection. I am considerably new trader, i have been trading only for about 6 months and your books and videos have helped me better understand a lot of things in trading. Thank you sir. Keep up the good work
Awesome, Dimitar!
Amazing this 50 MA explanation. Going to try in a few pair on trading view demo. And if it’s working I will buy all your books. Thank
Hey Maria,
Nice Moves trying it on Demo.
Cheers.
Very well explained Rayner. I am quite new in this but have learnt a lot from your videos and articles. Appreciate your effort and thank you.
You are welcome, Veelayudan!
what type is the 50 MA, is it simple,exponential, smoothed or linear weighted
Hey Centy,
You can use the exponential MA.
Cheers.
When the 50 MA crosses the candle…. ( Enter and Exit )
Enter when the candle cross immediately and its below the the 50 MA.
Exit immediately when the 50MA cross and above the candle
Rayner thank you for your videos and the books that I have received
Awesome, Troy!
Very good
You are welcome, Alex!
Rayner,you are good man. I do not know why you help traders, it does not matter. I like your heart. You are best of best. Thank you for your time and energy wasting for us .
You are most welcome, llkin!
The 50 day moving average is use to determine where the market is gonna go to enable us determine whether you are gonna buy or sell during trading.
To use the 50 day MA, I understood that, we shouldn’t trade far away from the 50 day MA and also, we should trade using candle stick patterns like the hummer, bullish and bearish engulfing candlestick patterns as well as the trade line to trade in order to make valuable trades.
Hi Reyner your way of Explaining 50MA is awesome,the entry point using trendline learnt just now. Thanks expecting for more surprises from you.
One of your fan from India .
You are most welcome, Adi!
Hi sir, I am your big fan.sir I am using four Emas ..20 50 100 and 200 ..I trade according to golden cross and death cross in M15 timeframe ..in golden cross I see buy entry ..and death cross only sell entries I see ..but in this way entries are limited …should I take the entry in pullback also so that I can get more entries ..kindly reply sir thanks ..
You Are one of the person in my life that’s thoughts I like to much thanks for giving your valuable article continue read your article very very impressive thanks a lot Rayner
You’re welcome, Nakul Vijay!
Which time frame it can use?
If you’re trying to trade mid-term trends, then 50 EMA would suit you.
For medium-term trends, you can look at the 4-Hour to daily timeframe.
Hope it helps! Cheers!
The 50 MA is used in healthy trends where the markets is above it .
It’s used for timing entries and exit . Entries are don at retest of the 50MA using bullish engulfing patterns or trend line breaks
Thank you for sharing, Sammhi!
Many thanks for the sharing idea , it is great and simple idea to understand when is the best time to entry and when we have to exit , however I still need to test weather this is proper to all stock
You’re welcome, Haerudin Israk!
Hi Rayner,
I thank you so much for your valuable information. Your information along with examples are amazing. I have paid a lot of money to learn to trade and none of the groups have been as clear as your information and most of the time no examples are given. On the example of the bullish engulfing pattern with the MA and the 50, how many candles later would you say to enter the trade? I couldn’t make that out in the example.
Thank you
You’re welcome, Barbara!
Our goal is to give a purposeful, and positive education for you guys!
Cheers!
You are my trading guru.
Hi Rayner,
Great article! Thanks a lot.
Please tell me, does it make a difference if I use the 5 min. or 1 min. time-frame instead of the 1-day time-frame? What changes?
Kind regards, Jay
hey, Jayvdw!
Your trading depends on what time frame you would use. and which higher time frame you are looking at.
You can check this video on how to select your timeframe, this might help you:
https://www.youtube.com/watch?v=YR_32PJVWQA
Cheers!
Hi Rayner, This is just awesome.. I’ve been following this strategy for more than a year whenever the market structure is trending (India), I must say I didn’t come across anyone who put this together so well. hey Rayner you know what your superpower is “you take a complex subject and explain it in a super simple way for anybody to understand” Cheers
Thank you for your kind words, Rajesh!
We’re glad that you find our materials very useful!
If there’s anything else I could do for you, don’t hesitate to let me know!
Thank you so much sir Reyno. You’re so generous. Your wisdom bless many…
Happy to help, Lin!