The more times Support is tested, the stronger it becomes.
Support and Resistance are lines on your chart.
You should place your stop loss when trading forex at Support and Resistance.
If you follow the “theories” above, it would cost you money in the long run. Because these are the biggest lies about Support and Resistance trading strategy.
And it’s not your fault because these are stuff that’s being taught in trading books and courses.
But don’t worry.
After reading this trading guide, you’ll never make these mistakes again.
Specifically, here’s what you’ll learn:
- The 5 things about Support and Resistance (losing traders are not aware of)
- How to find favorable risk to reward trades
- How to tell when Support or Resistance will break, so you don’t enter trades at the wrong time
- A Support and Resistance trading strategy — that lets you profit from losing traders
Are you ready?
Then let’s get started.
Truth #1: The more times Support or Resistance (SR) is tested, the weaker it becomes
First, let’s define Support and Resistance:
Support – Area on your chart with potential buying pressure
Resistance – Area on your chart with potential selling pressure
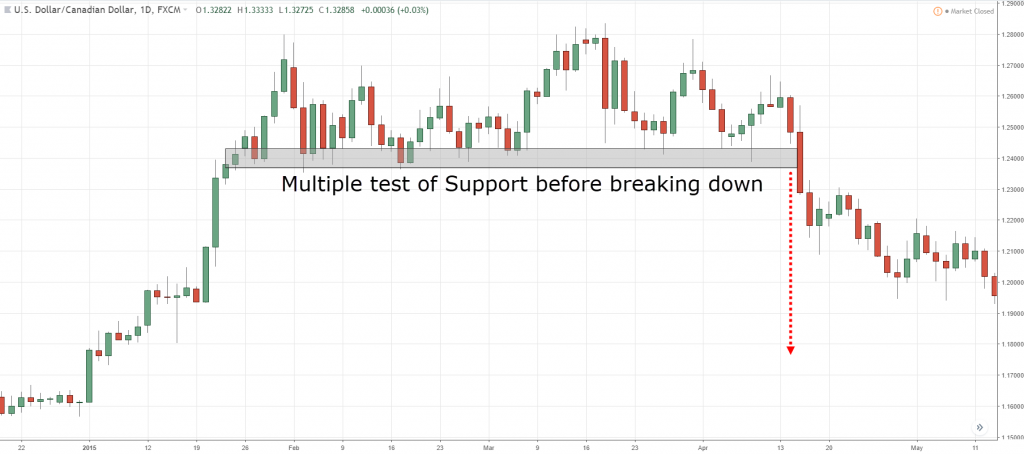
Here are examples of forex support and resistance:
You’ve probably read trading books that say… the more times Support or Resistance is tested, the stronger it becomes.
But the truth is…
The more times Support or Resistance is tested, the weaker it becomes.
Here’s why…
The market reverses at Support because there is buying pressure to push the price higher. The buying pressure could be from Institutions, banks, or smart money that trades in large orders.
Imagine this:
If the market keeps re-testing Support, these orders will eventually be filled. And when all the orders are filled, who’s left to buy?
Here’s what I mean…
Higher lows into Resistance usually result in a breakout (ascending triangle). Lower highs into Support usually result in a breakdown (descending triangle).
Let’s move on…
Truth #2: Support and Resistance are areas on your chart (and not lines)
This is a mistake I’m guilty of. Treating Support and Resistance (SR) as lines on my chart.
Why?
Because you’ll face these two problems:
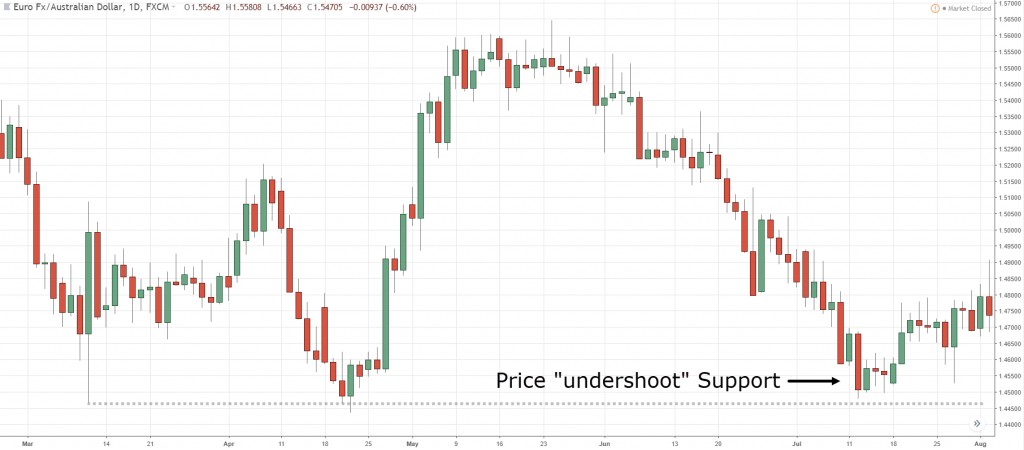
- Price “undershoot” and you miss the trade
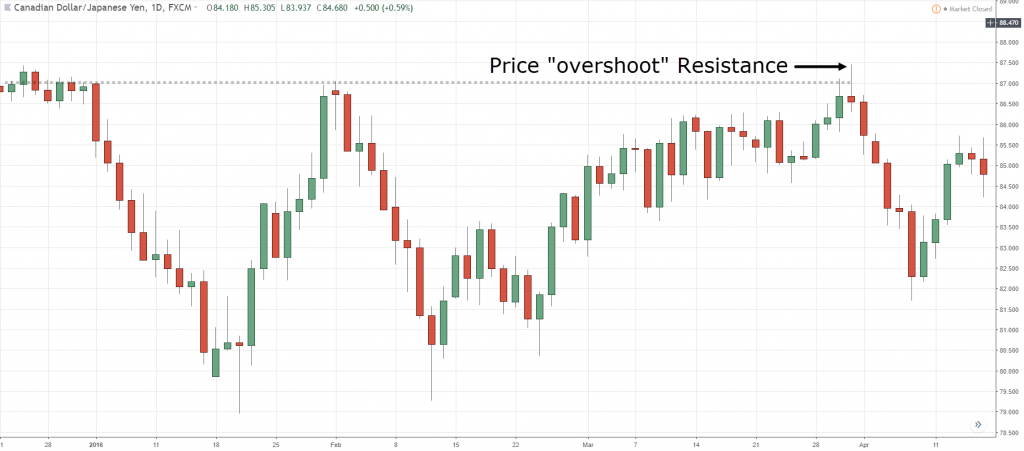
- Price “overshoot” and you assume SR is broken
Let me explain…
Price “undershoot” and you missed the trade
This occurs when the market comes close to your SR line, but not close enough.
Then, it reverses back into the opposite direction. And you miss the trade because you were waiting for the market to test your exact SR level.
Here are examples of over and undershooting support and resistance in forex:
Price “overshoot” and you assume SR is broken
This happens when the market breaks your SR level and you assume it’s broken.
Thus, you trade the breakout… but only to realize it’s a false breakout.
So, how do you solve these two problems?
Simple.
Treat Support and Resistance as areas on your chart, not lines.
Why SR are areas on your chart
Because of these two groups of traders…
- Traders with the fear of missing out (FOMO)
- Traders who want to get the best possible price (Cheapo)
Let me explain:
Traders with the fear of missing out would enter their trades the moment the price comes close to Support.
And if there’s enough buying pressure, the market would reverse at that location.
On the other hand, there are traders who want to get the best possible price, so they place orders at the low of Support. And if enough traders do it, the market will reverse near the lows of Support.
But here’s the thing:
You’ve no idea which group of traders will be in control. Whether it’s FOMO or Cheapo traders.
Thus, Support and Resistance are areas on your chart, not lines.
If you want to know my secret technique to drawing Support and Resistance, then check out this video:
Make sense?
Truth #3: Support and Resistance can be dynamic
What you’ve learned earlier is horizontal SR (where the areas are fixed).
But it can also change over time, otherwise known as, Dynamic Support and Resistance.
Now:
There are two ways to identify Dynamic SR.
You can use:
Let me explain…
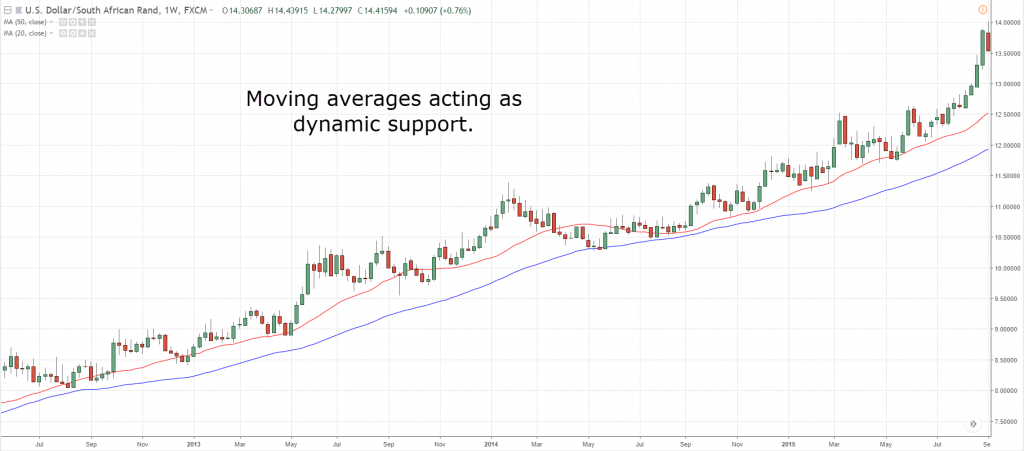
How to use the moving average to identify dynamic SR
I use the 20 & 50 MA to identify my Dynamic SR.
Here’s an example of dynamic support and resistance in forex:
However, it’s not the only way. You can use 100 or 200 MA, and it works fine.
Ultimately, you must find something that suits you (and not blindly follow another trader).
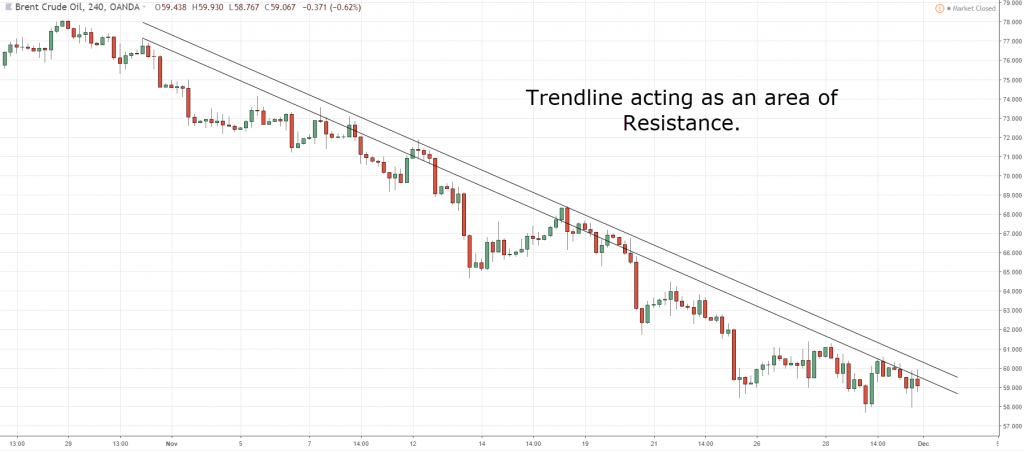
Trendline
These are diagonal lines on your chart to identify dynamic SR.
Here’s what I mean:
Treat Support and Resistance as areas on your chart (and not lines). This applies to both horizontal and dynamic SR.
Truth #4: Support and Resistance are the worst places to put your stop loss
I need not be an Einstein to guess where you’ll put your stops.
Below Support and above Resistance, right?
An example:
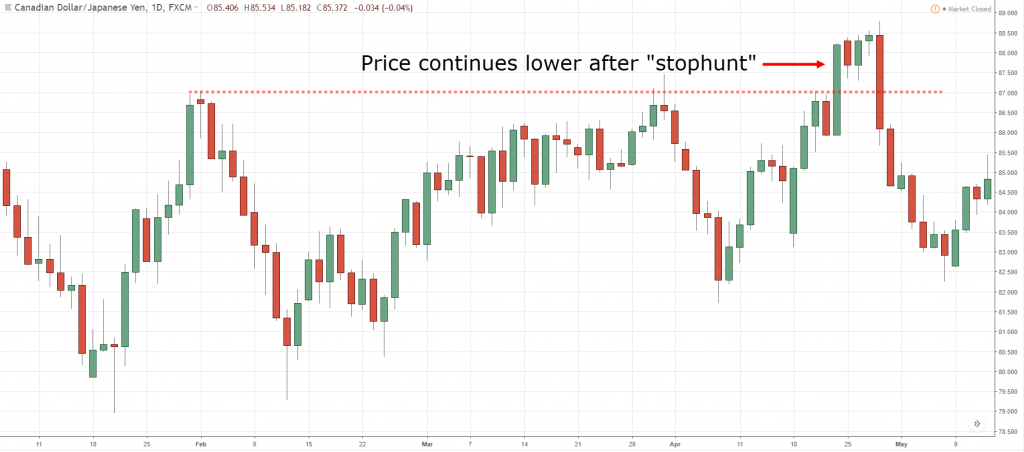
And why is this the worst place to put your stops?
It gets hunted.
Well, you can’t avoid it entirely.
But here are two things you can do…
- Set your stop loss a distance from SR
- Wait for the candle to close beyond SR
Let me explain…
Set your stop loss a distance from SR
You can do this by using the Average True Range (ATR) indicator.
Here’s how to do it:
- Identify the low of Support
- Find the ATR value
- Take the low of support minus the ATR value
If you want to learn more, go watch this training video below:
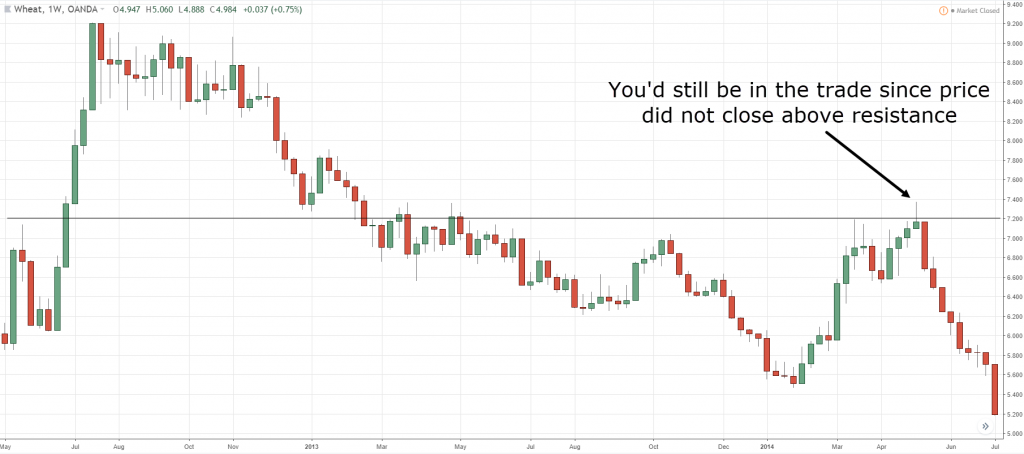
Wait for the candle to close beyond SR
Here’s how it works…
You only exit your trade if the price closes below the low of support or the high of the resistance.
Here’s what I mean:
And here’s something interesting… do you know the “real move” usually occurs after traders get stopped out of their trades?
And you can take advantage of this scenario by using a trading strategy I’ll share with you later.
But first…
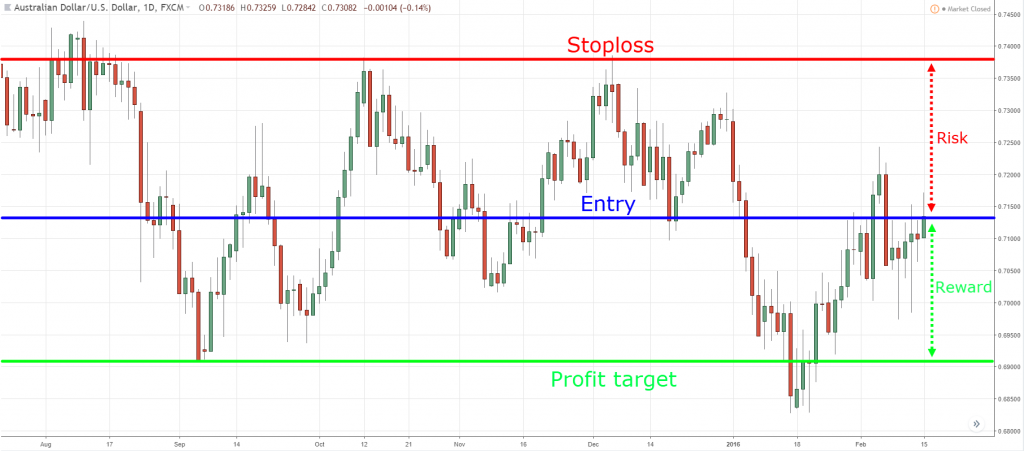
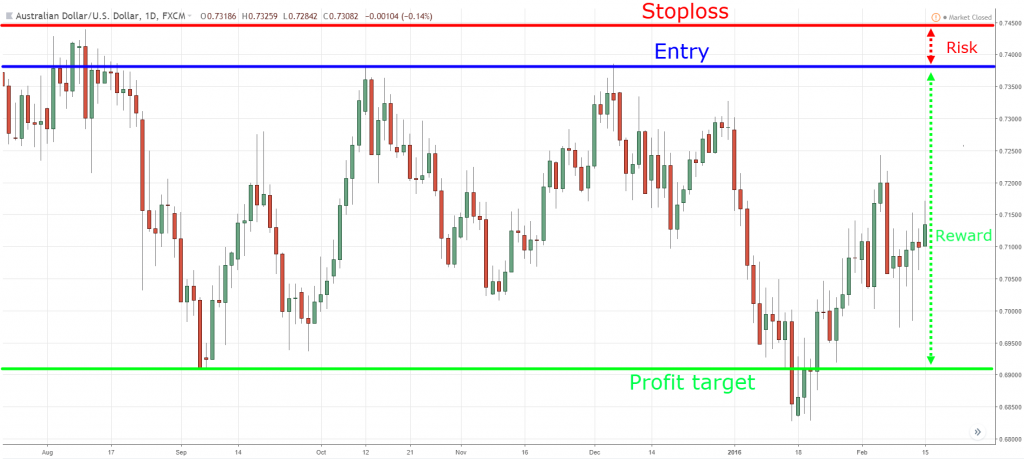
Truth #5: Trading at Support or Resistance gives you favorable risk to reward
The big mistake traders make is this:
Entering trades when the price is far away from SR. This requires a large stop loss and offers you a poor risk to reward.
An example:
But if you let price come to you, then you’ll have a tighter stop loss, and this improves your risk to reward.
Here’s what I mean:
Patience pays in trading. Stop chasing the markets and let price come to you.
Pro Tip:
Mark out your SR areas in advance. Then look for trading opportunities when the price has come to your levels. If the price is elsewhere, stay out.
Now…
If you want to learn more, go watch this training video below:
How to tell when Support or Resistance will break — so you don’t get “trapped”
The takeaway is this:
- Support tends to break in a downtrend
- Resistance tends to break in an uptrend
- Support and Resistance tend to break when there’s a buildup
Here’s why…
Resistance tends to break in an uptrend
Here’s a fact:
For an uptrend to continue, it has to consistently break new highs. Thus, shorting at resistance is a low probability trade.
Instead, going long at Support is a better trade.
Support tends to break in a downtrend
Likewise:
For a downtrend to continue, it has to consistently break new lows. Thus, going long at support isn’t a good idea.
But, going short at Resistance is a great idea.
Next…
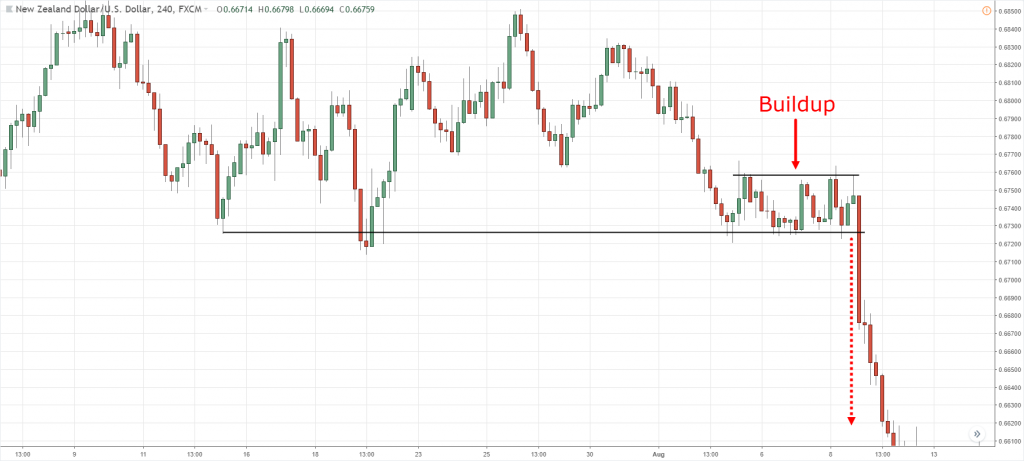
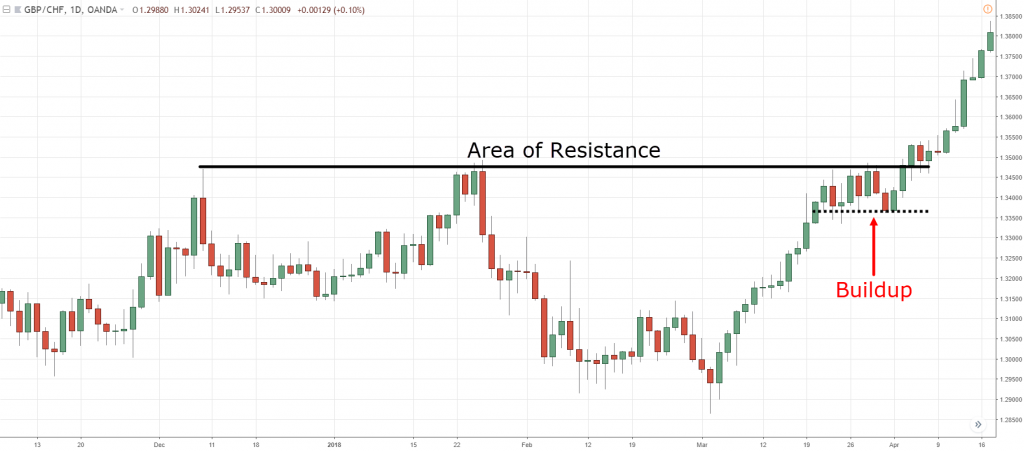
Support and Resistance tend to break when there’s a buildup
Consider this:
Support is an area with potential buying pressure. So, the price should move up quickly, right?
Now… what if price didn’t move up and instead, consolidates at Support?
What does it mean?
Recall the concept from Truth #1:
The more times Support or Resistance (SR) is tested, the weaker it becomes.
So it’s a sign of weakness as the bulls couldn’t push the price higher.
Perhaps there’s no buying pressure or, there’s strong selling pressure. Either way, it doesn’t look good for the bulls and Support is likely to break.
An example:
And the opposite for Resistance:
If you want to learn more, go watch this training video below:
Let’s move on…
A Support and Resistance trading strategy that lets you profit from losing traders
Here’s a fact:
Support and Resistance attract a lot of attention from traders. There will be some looking to trade the reversal, and others looking to trade the breakout.
Since trading is a zero-sum game… for reversal traders to profit — breakout traders must lose. And for breakout traders to profit —reversal traders must lose.
Do you understand?
Good.
Now… let’s learn a Support and Resistance trading strategy to profit from breakout traders.
Here’s what you need to do:
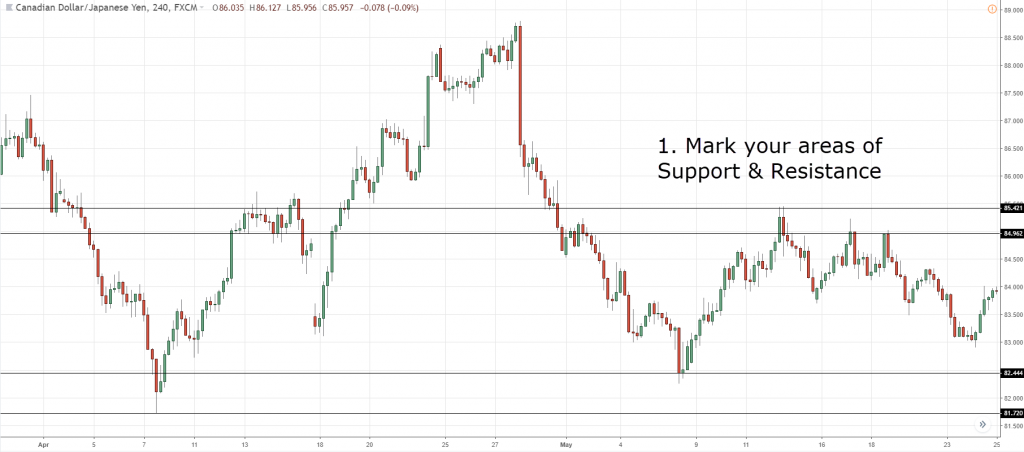
- Mark your areas of Support & Resistance (SR)
- Wait for a directional move into SR
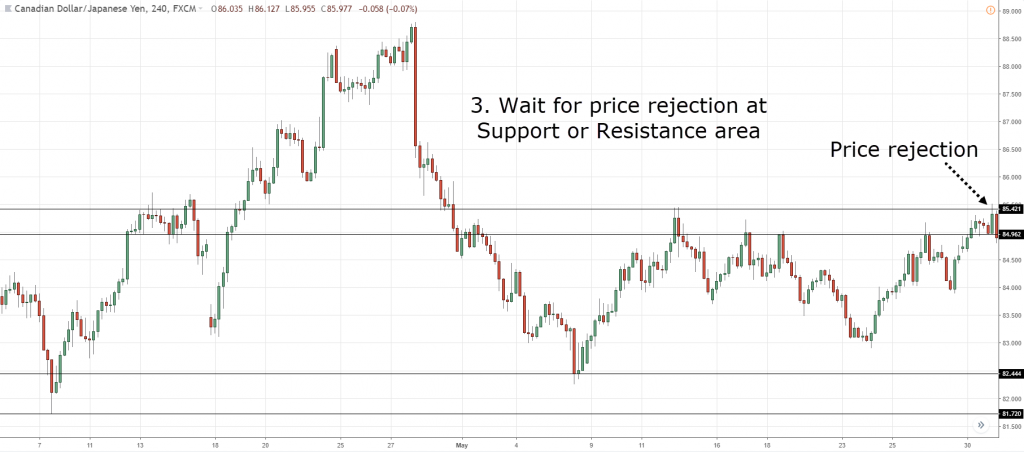
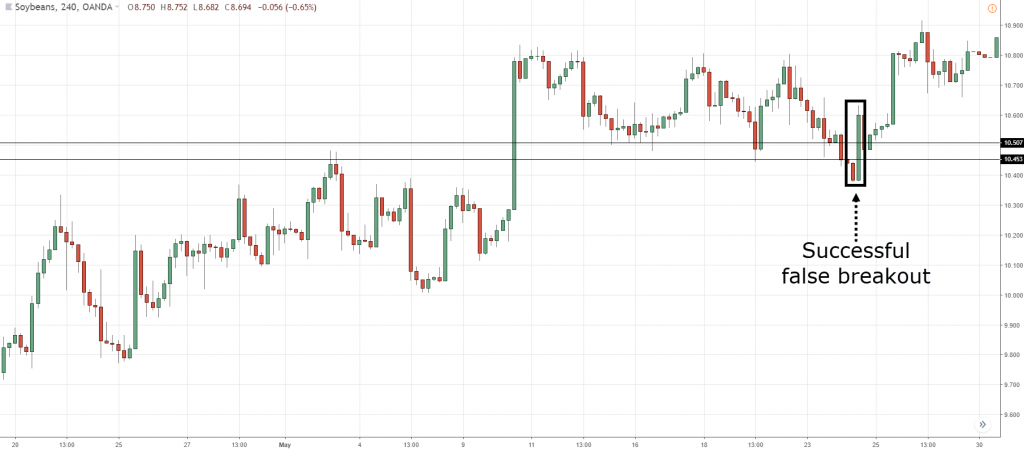
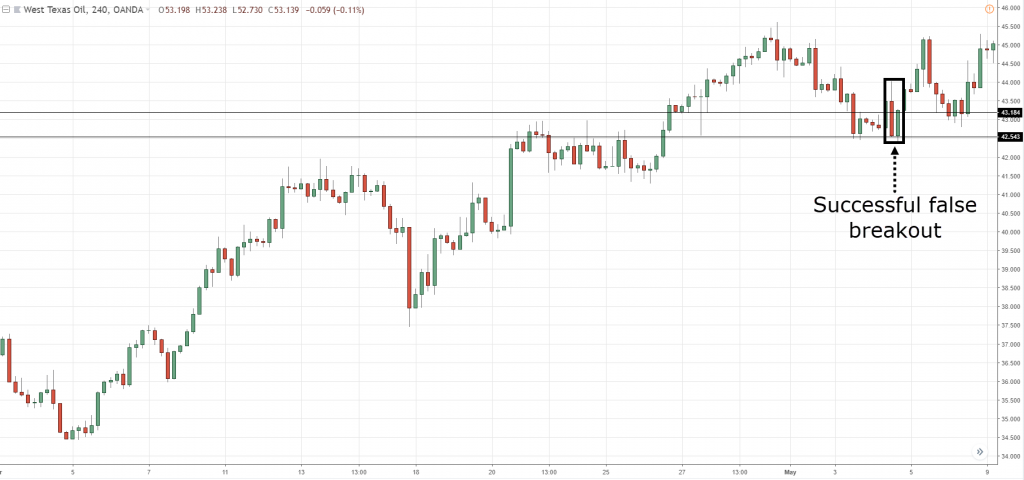
- Wait for price rejection at SR
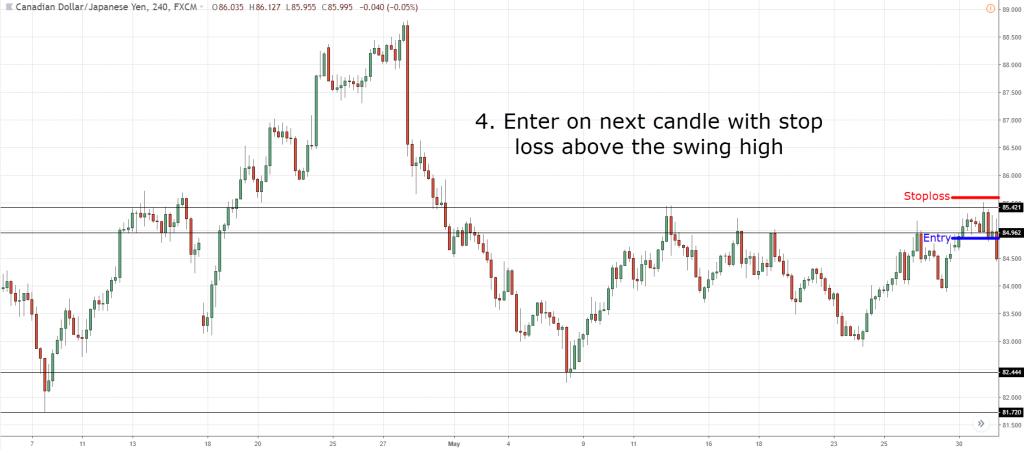
- Enter on the next candle with stop loss beyond the swing high/low
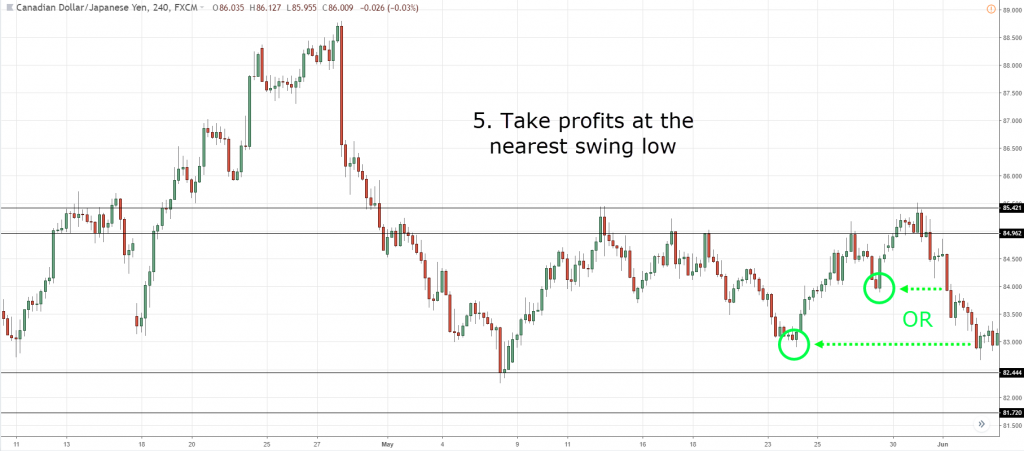
- Take profits at the swing high/low
Here’s what I mean…
1. Mark your areas of Support & Resistance

2. Wait for a directional move into SR

3. Wait for price rejection at SR

4. Enter on the next candle with stop loss beyond the swing high/low

5. Take profits at the swing high/low

Support and Resistance trading strategy examples
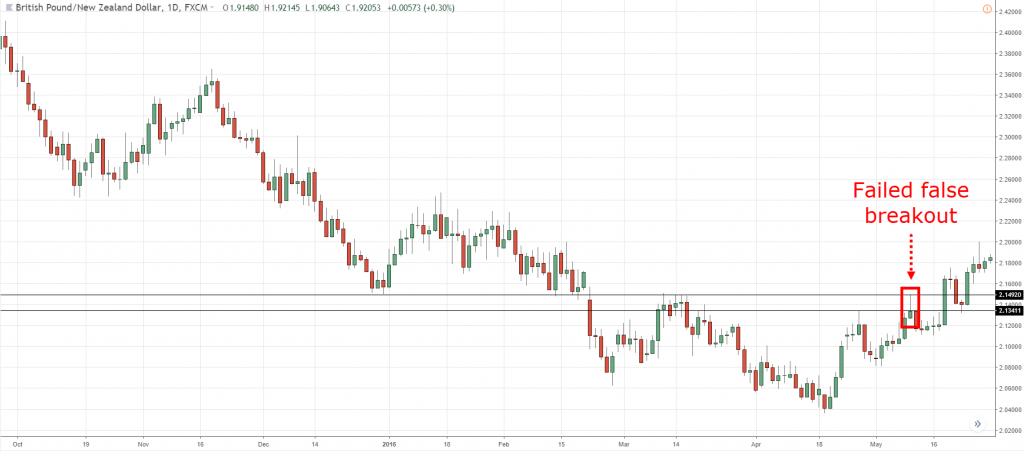
Losing set-up at (GBP/NZD):
Winning set-up at (SOYBNUSD):
Winning set-up at (WTICOUSD):
Now:
You must understand this trading strategy isn’t the “holy grail”. There are times you’ll lose to breakout traders — and at times, breakout traders will lose to you.
The only way you will survive in the long run is through proper risk management. Thus, I suggest risking not more than 1% of your account on each trade.
Frequently asked questions
#1: How do we define how wide the Support and Resistance can be?
An objective way to do it is to use the Average True Range (ATR) value as a gauge. Here’s what I mean:
- Find out the current ATR value
- Add 1.5 (up to 2) times of that ATR value to your Support level
So that forms an area of Support (similarly for Resistance). You can use this method to gauge how wide Support and Resistance can be.
A more discretionary approach is to observe how the price behaves at the Support and Resistance area.
For instance, whether the price goes into Support briefly then get rejected or does it go deeply into Support then get rejected. I’ll take these two levels to form an area of Support and gauge how wide it should be.
#2: Is it important for the price to break Support and Resistance with high volume?
Based on my research, I’ve discovered that volume doesn’t play a huge part in a breakout. So, the volume does not have a huge impact on whether a breakout is real or not.
#3: Hey Rayner, when you mention buildup, are you also referring to an accumulation?
Nope. A buildup is a tight consolidation where the candles are overlapping one another. It’s pretty difficult to identify Support and Resistance nor the swing high/low.
Whereas an accumulation is a range market, where its highs and lows can be easily identified and the market is swinging up and down within the range.
Conclusion
This is what you’ve learned today:
- The more times Support and Resistance is tested, the weaker it becomes
- Support and Resistance are areas on your chart (and not lines)
- Support and Resistance can be identified using moving average
- Don’t place your stop loss just below Support or above Resistance
- Trading at Support and Resistance gives you favorable risk to reward
- A Support and Resistance trading strategy
Now here’s a question for you…
How do you trade a Support and Resistance trading strategy?
Leave a comment below and let me know.




Hi Rayner!
I enjoy your lessons but sometimes I don’t understand some parts of its. (Maybe it comes from my poor knowledge of english.) So I have a question connected to Support and Resistance trading strategy. In the screen of “3. Wait for price rejection at SR” – what you can find in the part of your article named A Support and Resistance trading strategy — that lets you profit from losing traders – we can see a build up at least I believed. I thought it is a sign to the price will go higher. Instead of the price went down. Why? It wasn’t a build up or it happened in sideways market?
Thanks for your answer and keep up the good work
Best Regards
Gergely
Hi Gergely,
Yes, there’s a slight buildup which failed as you can see price failed to breakout from it, only to close lower.
Now, I don’t trade buildups in isolation. Always use these concepts in the context of the trend.
Hope this helps!
do you mean that only trade build up according to their trend?
build up on resistance in uptrend = long
build up on support in downtrend = short
thanks again rayner for sharing this precious tips.
Yes generally, that’s the case.
Hi Rayner,
Thanks for teaching people stuff that will improve their trading. What I have learnt from this article is worth more than what some people package as a training course. I really enjoyed it.
Hi Jovita,
Glad to hear that. Don’t hesitate to let me know if you’ve got any questions, I’ll be glad to help.
Hey, Hey!! What’s up my friend!! Haha. Hi Rayner, thanks for everything you do for all of us! Your a great guy! When I trade I use s&r. I first check and draw my sr lines on the weekly with a red line then daily lines with a blue line, then my 4 hour lines are orange and trade off of the line that gets the most touches before the open…….then I take the trade as close to the line as possible and set my stop beyond the line at no more than $200 risk and then I set my limit order to get out around the $250 sometimes $300 range and try to walk away and let the market go to work for me. I am just recently having some progress on ranging markets with this plan. I have found it to be very good for me when I set a profit target. I’m happy with $200 a,day for now but I want to keep improving. I know my risk to reward on this is out of wack. 2/1 is better but I just started to make a little money over the last few weeks and I like it!! Haha. I need to improve 1/1 will blow me out when I hit a losing streak again. I been trading for a year and 3 months and already blew up once with the help of a “veteran trader/broker” I’m doing it on my own now and your helping get alot!! Thanks again! God bless you and your family!!!
Hi Troy
Thanks for sharing. Happy to hear you found something that works for you.
Cheers
Great info Rayner…..I definetly owed you an edge in trading knowledge ….keep it up and God bless you.Thanks.
Glad to hear that Martin.
Don’t hesitate to let me know if there’s anything, I’ll be glad to help.
thanks Rayner I understood 100% just need to work more on sr
You’re welcome, Alex.
Yeah, keep on going!
Thank You Rayner ,
Its nice Study / guidance from you trading with support and resistance levels , i also studying W D Gann Methodology of trading for sup/Res with Sq of Nine table for trading any feed back on that pl guide me for becoming consistent trader.
One again Thanking you
Mandanna
Hey Madanna,
I’ve not used Gann methodology myself, so I can’t comment on it.
Rayner,
It’s a nice write-up about SR for sure. It would be fine if you share it in the form of PDF. Note that your views and info about trading is very helpful to the trader like.
God bless you.
Thanks………… Rony
Hey Rony,
Thank you for your feedback, I’ll look into this…
Rayner
Thanks rayner.
Its good way to think SR as an area instead of lines.
Now i will consider in the same as you told and will tell you the difference comes in my trading.
Hi Rahul,
You’re welcome, do keep me updated of your progress 🙂
gr8 post Rayner. Thanks a lot. Will apply this strategy and post the results soon.
Hi Nair,
Great to hear that, do keep me updated!
Hi Rayner,
Great and helpful stuff you put up here. Thanks!
Like to point out some “typo” below:
The takeaway is this:
Support tends to break in uptrend
Resistance tends to break in downtrend
If I am not wrong: it should be:
Support tends to break in DOWNTREND
Resistance tends to break in UPTREND
Thanks again.
Hi YH,
Thank you so much for correcting me, I really appreciate it!
Nice! good catch ! 🙂
Hi Karma,
Thank you!
Thanks for the great article Rayner. This is incredibly educational information.
I’m also glad to see you mentioned using ATR for placement of stop loses – that’s a tip that has really helped me improve my trading.
Thanks again!
Hi Jay,
Really glad to hear its helping.
Don’t hesitate to let me know if there’s anything, I’ll be glad to help.
Thanks again Rayner. As always I find your articles, downloads and videos very helpful.
Keep up the good work
Glad to hear that, Ray!
Don’t hesitate to let me know if there’s anything, I’ll be glad to help.
Thanks Rayner, through ur article and email….
I learn a lot of thing about about market trend, candlestick, market overview, SNR and many more. Your lesson much simple and easy to understand for newbie such as i.
Thanks for ur guide about 3 things we must have to be a consistent trader. Hope this lesson will be continuously for the future…..Thanks a million pips!
You’re welcome Fadzli. Glad to hear that!
I am using upthrust and springs methods plus sma 20 and 50 sma during trending period. Quite similar to your idea in SR.
Many thanks rayner.
You’re welcome, YJ.
Yes those are some good entry triggers in my opinion.
Cheers
Hi Sir,
It was great information. Thank you so much.
Can you please post about moving averages, RSI Levels and others also to find out better entry and exit points.
Thanks Once again for such a great helpful information.
Hi Mastan,
For moving average you can check this post out…
https://www.tradingwithrayner.com/moving-average-indicator-trading-strategy/
I don’t use RSI in my trading.
Cheers
Hi, Thank for sharing.
May I know how do we define how wide the Support and Resistance to be?
Hi Yong Liang,
There’s no hard and fast rule here. Sometimes the SR can get pretty wide and sometimes it’s nice and tight.
It’s discretion if you ask me.
hi thanks for the article on supp/res I’d like to know how do we differentiate supp/red area from supply and demand area ?
I don’t trade supply and demand so I can’t comment much on it.
Absolutely true! Support and resistance are not a single line. Your lessons are very easy to understand for those who’re keen learner and consider financial markets as serious business.
Thanks you! Always excited to watch your every lesson.
Awesome to hear that, Sushant!
Thank you again for an awesome article.
My entry on S&R, I place a sell stop below the low of the rejected candle and wait for the price to continue with me on the next candle. My problem is panic, I seem not able to wait for a price to play out till the my TP or SL. I have to work on it though
Thanks for the lessons Rayner
You’re welcome bud!
Hi Rayner,
Got problem to suft your web, firefox browser says:
“Secure Connection Failed
An error occurred during a connection to el2.convertkit-mail.com. Peer’s Certificate has been revoked. Error code: SEC_ERROR_REVOKED_CERTIFICATE
The page you are trying to view cannot be shown because the authenticity of the received data could not be verified.
Please contact the website owners to inform them of this problem.
Learn more…”
Hey O
Thank you for sharing. That’s an issue from my email service provider.
My website links are fine.
cheers
A bit confusing about SNR thing but still look to understand it better.
No prob. You can re-read again if that helps.
cheers
Thank You Rayner “Blessing” Teo for such a wonderful information,, I now have an edge in the market
cheers bud
Hey Rayner, great stuff you sharing brother thank you.
You’re welcome, Lesenyego
HI Rayner,I cant thank you enough for the information you have given out free like this!!!
God bless you
You’re welcome, Felix!
❤rayner ✌✌…
cheers
I have learned from your u tube videos about how to trade with the build up.Today I learned how to place the SL.THANKS SO MUCH.
You’re welcome, Senaka!
Hi Rayner,
As a new comer for forex and loser this is good lessons for me. Thanks a lot. I am continuously reading your lessons. Thanks again.
You’re welcome, Lakshman!
Backtested Dynamic Stops against my closed positions. It would have added considerabley to my profits. In addition I could have used SR range as an opportunity to add on an up day and red flag (confirm) complete breakdowns.
As always your tutorials are keepers!
Glad to hear that, Tom.
cheers
your articles are sooo helpful! i think you’re going to help me make money (don’t worry, i’ll give you a cut if ever do lol)!
Glad to be of help, Jay!
I am a student of Price Action @ Support & Resistance. To us PA is the King, Queen and all in all in the market place. I begin by drawing my SR lines on the Bigboss(monthly)fine tune and add more on the Boss(weekly)fine tune and add more on the Worker(daily).I place my trades from the Worker depending on the direction given by the Boss and Bigboss. Then wait for PA on the SR’s drawn by looking for either bearish (Shooting Stars, Bearish Engulfing/Outside) or bullish candles(Hammer, Bullish Engulfing/Outside). Where this happens at a congruence of Fib, Trendlines or DSRI, it is a more probable trade. Thank you
Thank you for sharing, Emeka.
Hi Rayner,
Big thanks for your honesty. I find these each points in my analysis.
Thanks again, good man.
Rasik Talsania
You’re welcome, Rasik.
in one of the blog, you have mentioned that one company has suffered a loss only a single day in the year which is that company, show me that blog. kindly reply.
It could be “how to be a professional trader” post?
Hi Rayner,
How to gauge the area of S&R, can give more details about it. Thannks
There’s no perfect way to gauge.
But what you can do is use the ATR indicator and have the SR drawn around 2 ATR of it.
Hey Rayner! You said that you must wait for the candle to close beyond the support or resistance levels to confirm a breakout but some examples here show the fact that price did close beyond the support and resistance area with consolidation even forming. Yet, after sometime fails and goes back to trade in the range. Can you please explain? I’m confused.
Case in point: The successful failed breakout charts in the latter part of this post
Best Regards 🙂
Nothing is 100% in trading.
Thanks a lot
Very helpful
Could you do a pdf format of it?
I don’t have that.
Hi Rayner,
Thank you for your teachings .
Your Pro Tips are very helpful .
Your understanding of what is happening with price action and the possible scenarios that can result from it .
Please, don’t stop putting up your You Tube Lessons.
Regards Rodger
You’re welcome, Rodger.
Awesome work brother…very very useful for me
Awesome to hear that!
hi there
thank you for your article… its pretty insightful (thank you). I have a question which might be two part. When one trades using support and resistance do we ignore trend direction and focus on the next swing low/high?
how does one spot a change in direction and how would one trade it or do we look at break out and let price determine… I think I have FOMO and would like to enter as soon as possible which sometimes doesn’t really work out.
1. I look at the trend
2. This post might help… https://www.tradingwithrayner.com/how-to-identify-trend-reversal/
Great and helpful stuff you put up here. Thanks!
I have been having issues with this strategy because i am always stopped out of the trade which has been giving me headache and made me start researching again till i came across this post ……i will put everything you taught into practice and share my success with you, i hope this solve all the problem . THANKS AGAIN.
Awesome, let me know how it works out for you. cheers
Awesome post. I have learned a lot about SR. this is what I needed to understand before practice trading. Thanks for all your help and support.
My pleasure!
Hi Rayner
I have two comments please.
I have noticed that you didn’t mention volume at all, don’t you think to break a SR we need high volume?
Is there an indicator that can draw SR? Or does it always have to be done manually by the trader?
Thank you
I don’t use volume so I can’t comment on it.
But there are Stock traders who look at volume and it matters to them.
thanks Rayner, another very useful stratergy which would help most of the traders here. Hats off to you
Cheers Velu
Thanks alot brother ..This post is very helpful to me..
Awesome to hear that, Shyam!
Thanks For S/R system….
You’re welcome!
Excellent
Cheers
Hi my name is Mhlonipheni from South Africa I wait for bullish engulfing candle to form at support area and enter long at the break of the high of the engulfing candle stop loss 80 pips below support level.and trail my stop loss each time a second candle closes.For bearish I do the opposite (daily time frame)
Thanks for sharing!
[…] Support and Resistance […]
Hey Rayner,
For Truth #1: The more times Support or Resistance (SR) is tested, the weaker it becomes.
However, fundamentally how we draw SR lines or trendlines, where maximum points (of swing highs/lows) get connected. Doesn’t it imply that if we draw SR lines or trendlines having maximum points, can be said as more times SR tested and that SR line or trendlines are weaker ones?
A better way I should have put is the more times it’s tested within a short period of time.
My experience tells me that the probability of multi-tests of SR levels leading to break-outs increases by dint of the frequency of the tests relative to the time-intervals between them; i.a.w., if the intervals appear on long term SR levels (W/D Frames) exceeding visibly the normal volatility of touches typical for an instrument then the holding power of a SR level seems to be stronger.
Cheers
Joerg
Thanks for sharing, Joerg!
Hi Rayner, I want to know how to use ATR
You can check this out… https://www.tradingwithrayner.com/atr-indicator/
Hi Rayner, i Read Your This artical.. it helps me alot.. lots of love and respect for you.. and lots of prays for you my dear..
regard
bilal from kashmir, pakistan
I’m happy to help, Rj!
It’s so much educative and thanxs alot but I would like to know what’s meant by 200EMA
200-period exponential moving average, cheers.
Great post. Loved it. Thank you.
My pleasure!
Hi Rayner,
It’s a very nice article, it will indeed change my trading style. Thanks a lot
God Bless You.
Cheers Peter!
Hi Rayner! Thank you so much for sharing all the valuable content, which btw is like a gold mine to us beginners! I’ve learnt quite a lot from your videos and articles and they are superb.
I do have a small doubt.. “Enter on the next candle with stop loss beyond the swing high/low” …what is meant by swing high/low here?
This post might help… https://www.tradingwithrayner.com/swing-trading/
hi Rayner, is there 1 ATR or 2 ATR +/- Resistance/support or 1% of capital used or some beyond swing high/low, as stoploss, little confused, please reply…
The reason you’re confused is because you’re looking for something definite.
Think about concepts behind WHY I’m doing it and you’d realize the parameters isn’t important, the concept is.
You are always rocking.
Help society to make wealthy.
Great person in the world.
I promise my self , will learn and trade always as you taught.
Will surely help yo avoid FOMO
Glad to be of help, Keshav!
Awesome rich content as usual. Thank you
My pleasure!
Too good, simple..
What is the most suitable timeframe to look for if the style of trading are as below:-
1. Between 3hrs to 6hrs
2. Between 6hrs to 12 hrs
3. Between 12 hrs to a day
4. Between a day to 3 days
5. Between 3 days to a week
The timeframe is very important in order to identify suitable areas of support/resistance and subsequently for a proper SL and TP.
Hi Rayner,
I like your salutation everything you about to start a session. Hahaha! I just started this month learning how to trade. I only have 1month and using demo accounts. I have been paing people to teach me but this clear info you provid from your youtube platform is great.
Thanks alot, you my mentor as from now on. My goal is to buy house by December 2019.
One question before I go, how do I size the area of SR since you said we should treat it as area instead of a line.
Thank you,
Lunga
Hey Lunga
This will help… https://www.youtube.com/watch?v=qm90uTnxY1U&t=1s
Hi Lunga,
Did you buy your house or not?
I Enjoyed Reading This
I Discovered Something New Again Thnx Rayner
Awesome to hear that!
Can I apply this support and resistance strategy in stock market here in Philippine? I just want to know thanks
Yes, the concept can be applied the same.
Hi Rayner!
Thank you for the material provided. I can identify the trend and use EMAs to help me trade with the trend. I do understand that you sell resistance in a downtrend and buy support in an uptrend. My only problem was the idea of what support and resistance looks like and how to apply it as well as confirms. The struggle was in applying the concepts as well as knowing what happens if prices reaches that area. I do understand that you look for rejection in a downtrend and look where price is finding support in an uptrend but with all this information I just don’t seem to get it right.
hello rayner, by build up do you mean accumulation or ranging, or that is totally different?
Buildup refers to a tight consolidation.
An accumulation stage is usually a wide range where the SR can be identified easily.
New to forex business hence the terms are still strange to me. I believe with constant study I will get over it. Thanks for words of wisdom and simple teaching method.
You’re welcome!
The way you have treated this SR topic has deepen my understanding. But I will like to know how to identify or draw SR area using meta trader 4 on Android phone. Regards. Peter
Check this out… https://www.youtube.com/watch?v=qm90uTnxY1U
Your teaching is laudable and commendable. Easy to understand and to comprehend with example to reveal the real picture of how the market works. I have suffered a lot of loses before encountering your books. Now, I will have to source for capital and go back to trading and begin to put to practise all what I have learnt from your book. You shall hear good news from me soon. Thank you so much for not keeping this knowledge to yourself alone.
Glad to help out, cheers
Thanks a lot Rayner, was very informative! Appreciate ur good work!
You’re welcome, Prabs!
Thank you so much I am always looking forward to learn from you thank you sir you are great
My pleasure!
Very nice educative stuff, I really benefit from it. Thanks Bro
Glad to be of help!
rayner great work bro for beginners like me to learn. what i should do if i want to learn all the aspects of stock market??
Excellent support and best method of trading you are explained here.
Requesting kindly share support and Resistance downloadable PDF format kindly share it here please
Thanking you
Rajalakshmi
Hi Rayner
It was really help full your lessons to understand the market SR levels, and thanks for that and I also want to know about fibanacci retracement and extension please can you explain brief about that ……..
I’ll look into it …
[…] Trend and Range: The Best Trading Strategy for Trading Trend and Range 5 Ways To Identify The Direction Of The Trend Everything You Need to Know About Trading With Trend Lines Support and resistance mistakes How to Trade Without Indicators Support and Resistance Trading Strategy – The Advanced Guide […]
thanks i learn how trader better with SR
Awesome!
Thank you so much
You’re most welcome!
Hi Emanuel
Hi Rayner,
That was a great blog on SR. You keep us educating and we are proud to be with you.
I would love to clear my thoughts with you.
Instead of keeping stop loss above or below SR, can we make it as an entry points.
Suggest your views on this.
Thanks,
Saran
Best Forex education ever, simplicity,practical and very passionate. Thanks alot Rayner.
My pleasure!
The charts you show in your lessons what time frames are they and what time frames do you recommend under different trading scenarios and why?
The concepts can be applied to different timeframes.
Hi Rayner,
When the price reaches SR, how do I determine if it is a breakout or pullback?
No way to tell for sure.
But one thing I look for is the range of the candles on the pullback. The smaller the range, then likely it’s a pullback.
Mr Rayner. Thank you for all these insight. Though I’m new to forex and I have decided to go into trading. I believe some of your video will guide me through. I’m yet to understand some terminologies. I hope that the book I downloaded will also help. Thank you very much for your help to humanities.
from Micheal Atoyebi
Cheers Michael.
Thank you for your valuable sharing. I’m still newbie in this line. So, far the best guidelines is coming from you compare to others (easy, smart & simple). Thank you very much
You’re most welcome!
U are just amazing..very valuable your teaching ..thanks
My pleasure!
Thank u Rayner, I can now successfully trade the support and resistance strategy.
But I have a question how can I draw sr lines in mt4 when using a mobile device….is it possible or it can only be done on a computer….. thanks again
Waiting for your reply
Do it on computer.
Understandable and useful
Your strategies are really good I am enjoying each and every one of the videos -really doing a good job keep it up….
Cheers John
Can I get this system
[…] when you combine this technique with market structure (like Support and Resistance, Trendline, etc.), you can pinpoint market turning points with deadly […]
Hi,I read and learn a lot from your mail and thankful to you.One query-which timeframe chart should I use for intraday and swing trading in this strategy?Please also tell me if your Booklet Pullback stock trading system works for stock and stocks futures for Intraday and swing trading?Waiting for your response .Thank you
mdriz1khan@gmail.com.
Hi Rizwan,
The Pullback Stock Trading System is strictly for stocks.
Trading on a higher timeframe gives you a better clue of the market.
Cheers.
What A Blessing! Your lessons are very easy to understand for those who’re keen learner and consider having financial freedom.
Dazed by your level of experience and the simplicity in your manner of teaching.
I will certainly improve on drawing SNR.
Tnx
Hi Dlight,
Thank you!
I trade Support and Resistance using the Quarters Theory. From your experience is it good ?
Great teaching brother
Hi Sandy,
You are welcome!
Cheers.
Hi Rayner
I am reading your book (The Ultimate Guide to Price Action Trading) and practicing your tips. You did a very good work. Thank you for that. I only have two questions for you, for now.
1. I am currently using MetaTrader 4 platform for trading. However, I would like to know which platform are you using on your videos? Because I have noticed it is different from metetrader 4.
2. 4 Stages of the market. Can you apply these stages (Accumulation, advancement, etc) on any time frames, like 1 Hour time frame? I ask this because on your book you seem to only mention a Daily time frame.
Thank you.
When price comes to area of value wait for candle to close above or below S/R and enter next candle by put SL 2ATR above/below
You are my GURU…You are my MENTOR….I am always learning great things from u…..You are the best….
Thank you, Rajesh!
Hi! Thank You VERY VERY VERY much for your site, lessons, videos and books! You are GREAT man!!!
Thank you very much, Arsian!
i’ve learned alot frim this lesson and im grateful to have a mentor like you who gives us information that we’ll actually need and also showing us the ropes in every detail you tell us thank you so much
You are welcome, lebogang!
Like for the loosing setup on GBP/NZD where there was a fail of false breakout , at resistance level, could that be as a result of change in trend where the price started making higher highs and lows? even when the market rejected and made a pattern evening star at the level?
This is highly educative. I leant a lot .Thank you
Awesome, Micheal!
Great post! I stopped trading a while ago because I blew my account, but I have been drawn back into it recently based on the recent boom in crypto and realising how well I can analyse charts. I am currently playing with a demo account, what I use to struggle with was figuring out how to get out of trades as I was a trend reversal trader so I’d trade the bounces off support and resistant levels. And it’s recently clicked with me how to do this now, as breakouts use to hit my account hard. But your article breaks down how to prepare for a breakout and hedge risks. I think my problem was as well I was looking for a holy grail, and it’s clicked with me that there isn’t you simply find a strategy that works more than 50% of the time and you can make a living. I cannot wait to get back into trading the markets, just waiting on my crypto profits to be able to get back in! They say when everything clicks you will make it trading and I believe things are starting to click for me
Give me this book
Mark your support and resistance area on your chart. When price approaches either area, you wait for a false break. Then you enter at the close of the next candle and set your stop loss a over the previous highs/lows.
Thank you for your contribution, Afosho!
Awesome…
that was a great lesson RAYNER
You are welcome, William!
today i have known a different theory about SR zones and put the SL by the trader, which I hope definitely work out in getting huge profits to him
I’m glad to hear that, N
THANK YOU SO MUCH RAYNER !!
You are welcome, Dharamveer!
1. Is this method useful to day trade
2.what timeframe is best in day trading because in india leverage is 20 time of the capital we invest for intraday with discount broker and brokerage is also very low and i want to grow my account
Hi, bro You are great, keep it up I’m getting smarter,, thnks u Bro
I appreciate you, Maibam!
In continuation of above comment , Even for Pullback trading strategy did not receive pdf version soft copy till now . Kindy help out for getting pdf copy for 8$ order and also refund for a mistaken order worth 22258 INR .
Hi Rayner,
Today on 31-07-2021 , I ordered a Pull back trading strategy pdf worth 8 $ (595 INR) .Just immediately after that I mistakenly enrolled for an additional subscription worth 22258 INR.
Kindly refund the 22258 INR to my credit card.
Even for Pullback trading strategy did not receive pdf version soft copy till now . Kindy help out for getting pdf copy for 8$ order and also refund for a mistaken order worth 22258 INR .
Note – I placed an order from India.
Hi, Lokendra Singh!
Please send a request to our email: support@tradingwithrayner.com and we will assist you with your concern.
Thank you!
This is excellent information .. can you pls make videos of how to draw chanels in trading view. Thnx
Hi, Soma Sundar!
You may check this link on How To Use TradingView Like A Pro (in 2021):
https://www.youtube.com/watch?v=Vqrkbcdmuqc
Hey Rayner, Thanks for all the info that you are spreading to trading community.
Which is the best way that you recommend to keep SL? SL order placed in system or placing manual SL order once we get close of the day below our assumed SL price?
Hey VB,
SL order placed in the system, Because if it hits your stop loss, it means it invalidates your set up.
So respect your SL and trust. Let It do its jobs.
You can check this “Stop Loss Strategy Secrets” to learn more!
https://www.youtube.com/watch?v=1ohBdvp8CoU
Cheers!
Hi Rayner Sir,
We can trade with the same two lines at support or resistance.
1. Reverse Trade
2.Breakout Trade
1. Reversal trade: If the price moves towards (SR) without swing high or swing low then (SR) can reverse.
2. Breakout trade: If price has buildup near (SR) then it can breakout (SR) and we can use 20 moving average with it.
If the market close in the support with a bullish harmer, then I will wait for the next one hour candle to close above the previous candle then I confirm the market. Or if a maribozur candle form at the support I will wait for 15minutes candle to close, if the minute candle close above the previous candle then I will take my bias.
Thank you for sharing, Udoh!
im happy to learn it to you. now most of my trade become profitable. Thank you sir. Godbless
Nice to hear that, Gilbert!
I wish you the best in trading!
Cheers!
Ur way of explaining is super… clear concept n no confusing
Hey there, Durga!
Jarin here from TradingwithRayner Support Team.
Glad you find Rayner’s blog helpful! Yes! It should be clear and straight to the point so it can absorb quickly!
Cheers!
Thank you so much for teaching this simply
No worries, France. Glad we could help!
Cheers!
Easy to understand SR concept
Thanks, Nor Aishah!
Raynar can a $10 Account Managed on 1% risk Management
Hey rayner you make it clear on how to trade on support and resistance.
Glad it helped you, Mlamli!
Cheers!
I like the way u teach
Sorry, I’m late to the stock market but happy to get your skills. Thanks.
You are most welcome!
thank you for this article, i am still newbie in trading and this article really helps me understand better about trading
You are most welcome!
Feel free to explore Rayner’s Academy if you are a beginner.
Here is the link:
https://www.tradingwithrayner.com/academy/
Cheers!