Chart patterns are one of the most powerful tools you can use in your trading (only if you use it correctly).
For example, it can help you:
- Read market conditions accurately so you know whether to buy or sell
- Get out of losing trades quickly and better manage your risk
- Find high-probability trading opportunities
- And much more…
That’s why I’ve created this essential guide—the ultimate guide to chart patterns, so you know how to trade chart patterns like a professional trader.
But first, let’s destroy 3 myths about Forex chart patterns…
The myths about chart pattern (don’t fall for it)
Myth #1: Chart patterns can predict the future accurately
Many traders think chart patterns can predict the future (like some kind of magic crystal ball).
For example:
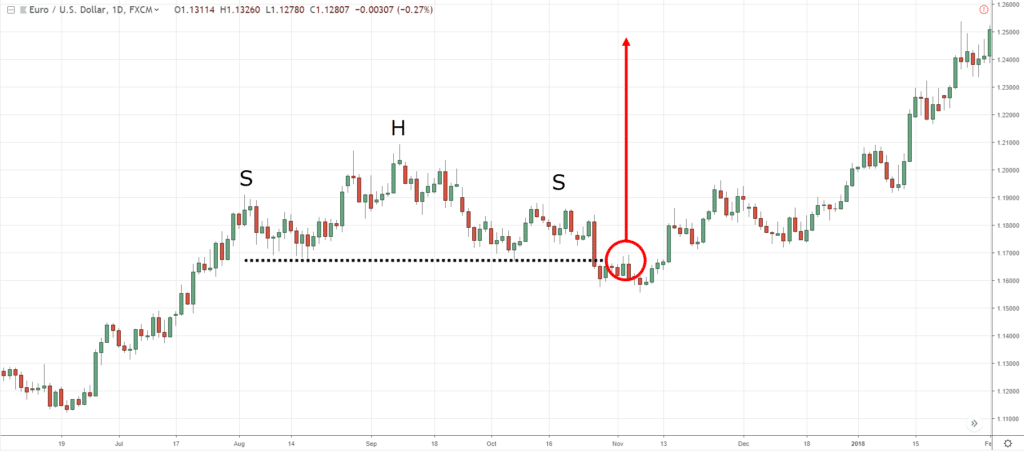
You see a Head & Shoulders chart pattern and think the market is about to head lower.
So, you go short.
Before you know it, the market reverses higher, and you got stopped out — ouch.
So here’s the deal…
Chart patterns can’t accurately predict the future, nothing or no one can.
But…
Chart patterns can help you assess market conditions and manage your risk.
(More on that later)
Myth #2: Chart patterns don’t work
Now…
After a few failed attempts at trading chart patterns, you’ll claim it doesn’t work.
Just look at the failed Head & Shoulders chart pattern earlier!
So here’s the secret…
Whenever you trade chart patterns (or any form of Technical Analysis), it has to be within the context of the markets.
Let me explain using these 2 examples…
Example #1:
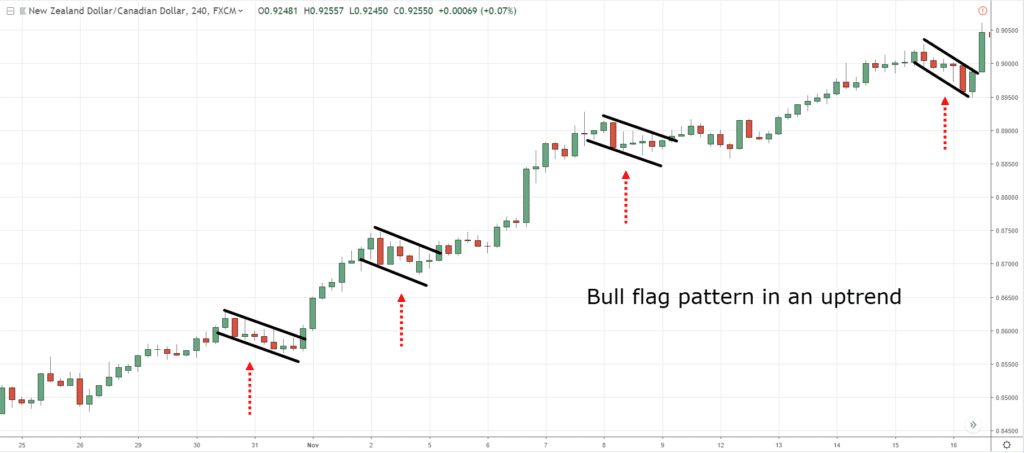
You spot a Bull Flag pattern in a downtrend.
Example #2:
You spot a Bull Flag pattern in an uptrend. And on the higher timeframe, the market had broken out of resistance and is trading at 52-week highs.
Now let me ask you, which chart pattern would you trade, #1 or #2?
Next…
Myth #3: You must know every chart pattern if you want to trade it profitably
Here’s the thing…
There are possibly hundreds of chart patterns out there.
Sure, you can try to memorize the shape and meaning of each pattern (and risk getting burned out).
Or, learn how to read the price action of the markets so you can understand any chart patterns that comes your way — without memorizing a single one.
Which do you prefer?
Read the price action?
Then read on…
Chart patterns cheat sheet: If you know these 3 things, you NEVER need to memorize a single chart pattern again…
This is important, so pay attention…
#1: Trending Move
You’re probably wondering:
“What is a Trending Move?”
A Trending Move is the “longer” leg of the trend.
If the candles are large (in an uptrend), it signals strength as the buyers are in control.
If the candles are small, it signals weakness as the buyers are exhausted.
An example of a Trending Move:
#2: Retracement Move
A Retracement Move is the “shorter” leg of the trend.
If the candles are large, it signals the counter-trend pressure is increasing.
If the candles are small, it’s a healthy pullback and the trend is likely to resume itself.
An example of a Retracement Move:
#3: Swing Points
Swing Points refer to swing highs and lows — obvious “points” on the chart where the price reverses from.
Here’s an example:
This is important because it lets you know whether the market is in an uptrend, downtrend, or range.
As a guideline:
- If the swing highs/lows move higher, then the market is in an uptrend
- If the swing highs/lows move lower, then the market is in a downtrend
- If the swing highs/lows are not moving higher or lower, then the market is in a range
You’re probably wondering:
“What has this got to do with reading chart pattern?”
Well, that’s what I’ll cover next.
Read on…
How to read and understand any reversal chart patterns accurately
Now, let’s put what you’ve learned to use.
Reversal chart pattern #1
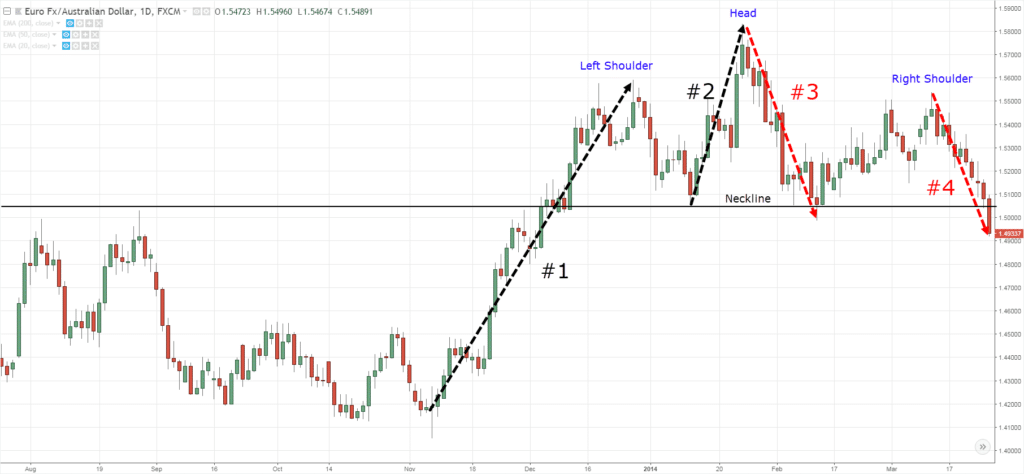
Look at the chart below…
#1 and #2: The market is in an uptrend as the price made new swing highs (and lows).
#3: The price failed to make a new swing high. And if you notice, the Trending Move is getting weak as the range of the candles got smaller (compared to #1 and #2).
This doesn’t look good for the buyers. But if the swing low doesn’t break, the uptrend is still intact.
#4: The price broke below the swing low and the Retracement Move is getting stronger. Notice the range of the candles getting larger?
Overall, the sellers are in control and the market is likely to move lower from here.
Pro Tip:
This is known as a Head & Shoulders chart pattern (and the opposite is called Inverse Head & Shoulders).
Next…
Reversal chart pattern #2
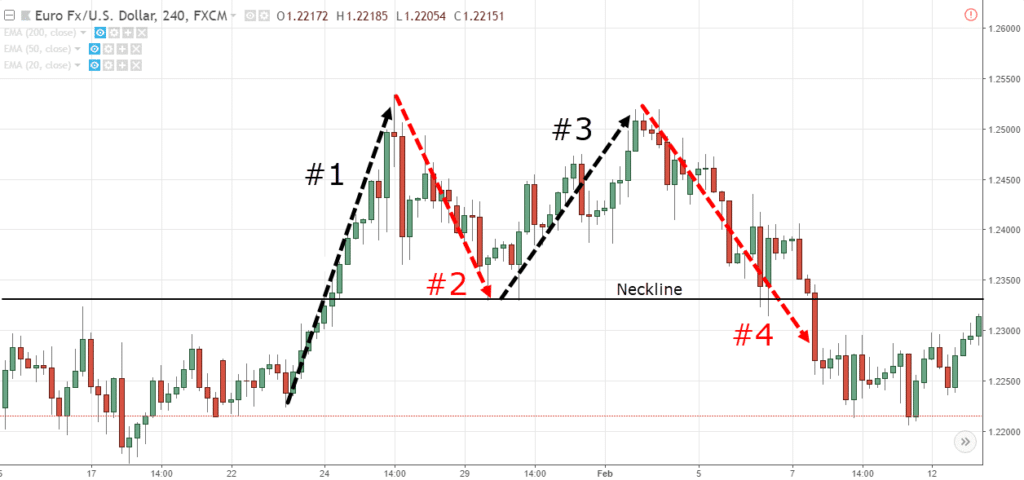
Look at this…
#1: A strong Trending Move higher as the price made a new high.
#2: A Retracement Move lower which forms a swing low.
#3: The market made another push higher but failed to break above the previous high (from #1). This is a sign of weakness but the uptrend is still intact.
#4: The market re-tests the swing low (and consolidates for a while) before breaking lower.
Overall, the sellers are in control and the market is likely to move lower from here.
Pro Tip: This is known as a Double Top chart pattern (and the inverse is Double Bottom)
Continuation chart patterns, here’s what you must know…
Let’s get started…
Trend continuation chart pattern #1
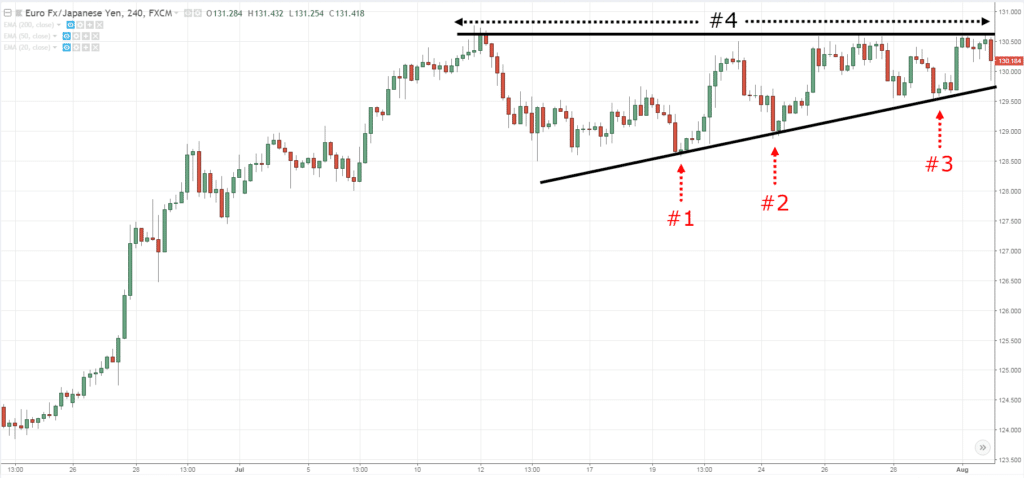
Look at the chart below and ask yourself:
“Is this a bullish or bearish chart pattern?”
#1, #2, and #3: The price made higher lows into Resistance. This is a sign of strength as it tells you buyers are willing to buy at higher prices.
#4: This is an area of Resistance (the last line of defense for sellers). Also, there’s likely stop loss orders above it from traders who are short.
Overall, the buyers are in control and if the price breaks out, the market is likely to move higher.
Pro Tip: This is known as an Ascending Triangle chart pattern (and the inverse is Descending Triangle).
Also, it can be a reversal chart pattern if it forms after a downtrend.
Trend continuation chart pattern #2
Now, what about this chart pattern?
Let’s analyze it together…
#1: A strong Trending Move higher as the price re-tests the previous high.
#2: A weak Retracement Move with small-bodied candles. Sellers have difficulty pushing the price lower.
Overall, the buyers are in control and if the price breaks out, the market is likely to move higher.
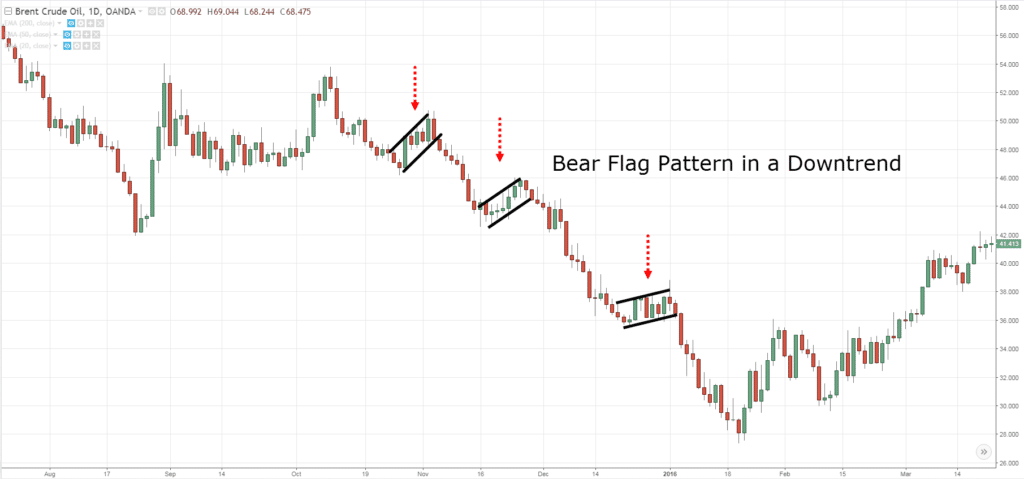
Pro Tip: This is known as Bull Flag chart pattern (and the inverse is Bear Flag).
There are other variations to it like Symmetrical Triangle and Pennant.
How to trade chart patterns like a professional trader
Now…
You’ve learned how to understand any chart patterns and you’re itching to trade them.
You’re thinking:
“Time to look for a Head & Shoulders pattern and short the market.”
But wait!
Not so fast.
Why?
Because remember, not all chart patterns are created equal.
You can have two identical chart patterns but one has a higher probability of success.
So the question is, how do you tilt the odds in your favor?
Well, here are three things to look for…
- Trend
- Area of value
- Buildup
Let me explain…
The trend is your friend
Yes, I know you heard this a gazillion times, and it’s true (the trend is your friend).
So if you’re trading chart patterns, you’d want to be trading in the direction of the trend.
For example: Buying a Bull Flag in an uptrend
Or selling Bear Flag in a downtrend…
Next…
Area of value: How to buy low and sell high
Let me ask you:
When you go to the supermarket to buy Apples, what’s the price you’re willing to pay?
Probably anything below $2, right?
Now, what if an Apple cost you $10?
Well, you’d think it’s ridiculous and won’t even touch it.
And it’s the same for trading.
You want to buy when the price is at an area of value — when it’s “cheap”.
But how do you the area of value?
Simple.
You can use tools like Support and Resistance, Moving Average, Trend line, etc.
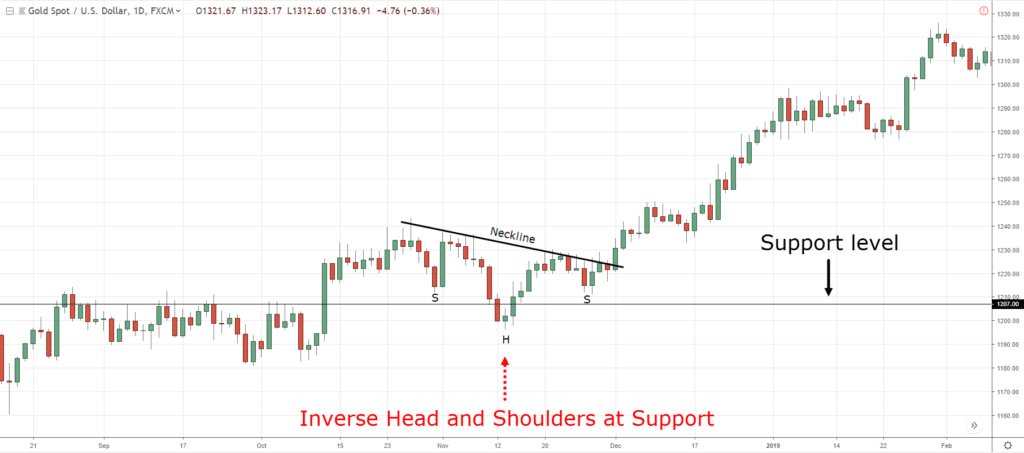
Here’s an example: Inverse Head and Shoulders pattern at Support
Now, you know Support is an area where potential buying pressure could come in.
And when you get an Inverse Head & Shoulders pattern, it means buyers are stepping in and could push the price higher (if it breaks the Neckline).
Won’t this increase the odds of the trade working out?
Moving on…
Let me show you one of my most profitable trading patterns.
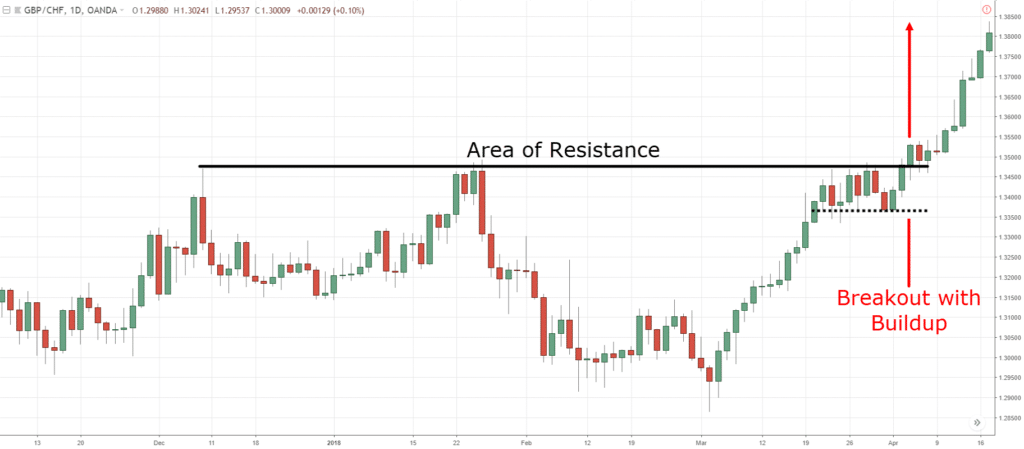
Breakouts with buildup
Note: This mainly applies to chart patterns with horizontal boundaries (like Double Top/Bottom, Head and Shoulders, etc.).
Now…
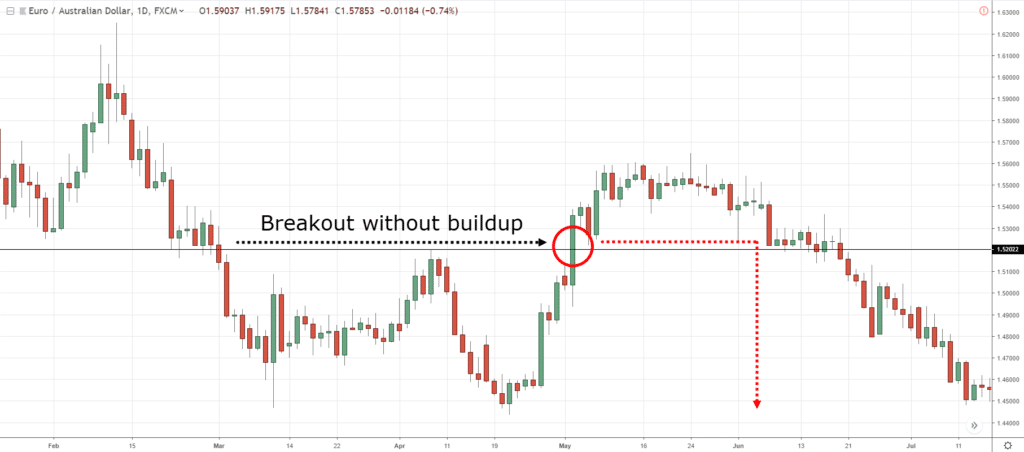
When you trade breakouts of a chart pattern (like Double Bottom), you don’t want to “blindly” trade every breakout — especially when the price has made a big move prior to the breakout.
Why?
Because buyers would look to take profit at Resistance plus, sellers would step in to short the markets.
And this leads to a low probability breakout trade.
Here’s what I mean…
You’re probably wondering:
“So how should I trade breakout?”
Well, you look for a buildup to form at the horizontal boundaries (like Support and Resistance).
Here’s why…
#1: Favorable risk to reward
You have a logical place to set your stop loss (below the low of the build-up), and this offers a more favorable risk to reward.
#2: A sign of strength
When the price forms a build-up at Resistance, it’s a sign of strength.
Because it tells you the buyers are willing to buy at higher prices (even in front of Resistance).
#3: Profit from losing traders
Imagine…
If the price is at Resistance, what would most traders do?
They’ll go short and have their stop loss above Resistance.
And the longer the price hovers at Resistance, the more traders will short and buy stop orders would cluster above Resistance.
But what happens if the price breaks above Resistance?
This cluster of buy stop orders gets triggered which fuel more buying pressure (and this increases the odds of a successful breakout).
Here’s what I mean…
An example of a build-up on GBP/CHF Daily:
Now:
You’ve learned how to trade chart patterns and identify high probability trading setups.
Next, you’ll discover how you can use it to manage your risk.
Read on…
How to use chart patterns and manage your risk
Here’s the trick…
You can use the structure of chart patterns to set your stop loss.
This means you set your stop loss at a level where if the price reaches it, it would “destroy” the chart pattern.
Let me share with you a few examples…
Example #1
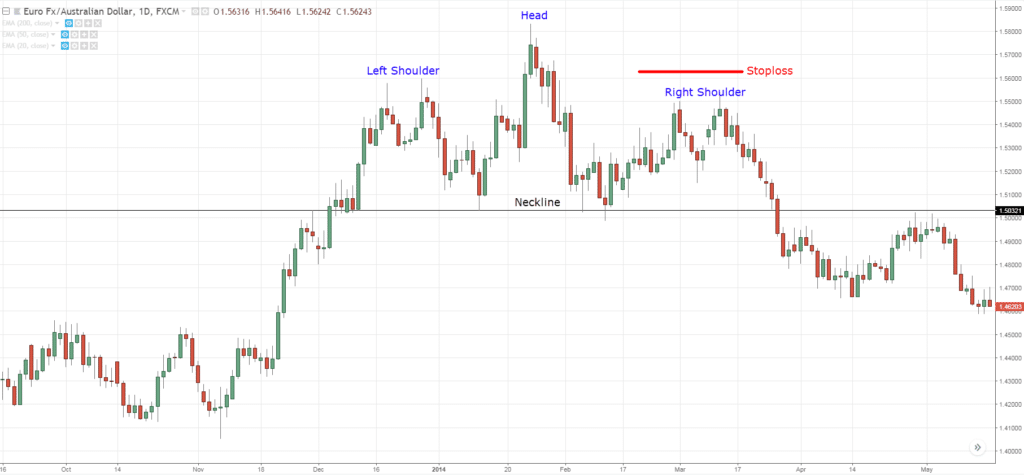
You know the Head & Shoulders is a bearish reversal chart pattern and traders might go short on the break of the Neckline.
So, where’s a logical place to put your stop loss?
Well, you can set your stop loss above the highs of the right shoulder.
Because if the price were to reach the level, it would invalidate the Head & Shoulders chart pattern (and you want to get out of the trade).
Here’s what I mean:
Make sense?
Example #2
The Bull Flag is a bullish continuation chart pattern and traders might go long on the break of the highs.
And where would you set your stop loss?
Remember…
You want to place it at a level where if the price reaches it, it would “destroy” the chart pattern.
So, one way is to set your stop loss below the low of the Bull Flag pattern.
Here’s what I mean…
Now, at this point of the ultimate guide to chart patterns, you might be wondering…
“So, which are the most profitable chart patterns?”
Well, the truth is…
It doesn’t exist because there’s no such thing as the most profitable chart patterns.
Why?
Because market conditions triumph over any chart patterns you know of.
For example:
If the market is in a downtrend, then any bullish chart patterns won’t do well because the trend is down.
And if the market is in an uptrend, then any bearish chart patterns won’t do well because the trend is up.
Agree?
So the bottom line is this…
Forget trying to find the most profitable trading patterns — it doesn’t exist.
Instead, identify the current market condition and then trade the appropriate chart pattern — you’ll do much better this way.
Frequently asked questions
#1: Do all these concepts work in the stock market as well or do they only work for Forex market?
Yes, these concepts work in the stock market as well.
#2: Should I wait for a buildup to form before shorting the head & shoulders chart pattern in a downtrend?
Ideally, you want to wait for a buildup to form as it tells you that there’s a volatility contraction at that moment which could expand in your favour thereafter.
Sometimes if you don’t get a buildup, you can also reference the previous swing high to set your stop loss if the risk-to-reward makes sense.
#3: Is there an easy way for me to know if the chart patterns work in the long run, or not?
No, there is no way to know for sure if something will work in the long run. That’s why you’ve got to put in the hard work to validate your findings.
Ideally, when you’re trading chart patterns, you want to have sound logic behind those patterns.
Conclusion
So here’s what you’ve learned today:
- Chart patterns cannot accurately “predict” what the markets will do (nothing and no one can)
- You don’t need to know every chart patterns out there to trade it profitably
- If you want to understand any chart patterns, just analyze the Trending Move, Retracement Move, and swing highs/lows — that’s all you need
- Chart patterns work best when you trade with the trend, trade from an area of value, and trade breakouts with a buildup
Now here’s what I’d like to know…
Which Forex chart patterns do you love to trade and why?
Leave a comment below and share your thoughts with me.






Very helpfull to me…thanks master
Cheers
Thank you, very helpful. I try to learn technical anslysis to be a successful trader. Your documents help to me. Regards. Mustafa
Hi Rayner,
Is your question not a trick question?
I am asking because given your above post (regarding optimum buying or selling levels — basically entering as close as possible to ‘value’ with a ‘stop’ placed beyond whatever price level would signify that you were wrongly positioned) can there be a ‘favourite’ chart pattern?
Cheers,
David
Hey David
No tricks, just wanted to know which chart pattern people resonate the most with.
Hey Rayner, i like to thank you a lot.. Since I started listening at your Videos, my trading strategy is improving.. i see a lot of changes.. i wish to buy your books for more information..
I’m so glad to hear that, Otshepheng!
very Useful
Thank you, Frank!
Rayner Teo,
I don’t know how to thank you enough for your kind gestures, I must confess that your free teachings has made a lot of difference in my trading carrier.
My dream is that one day I will meet with you one on one and give that long hug to say thank you Rayner.
Please keep the good work up, Heaven will be kind to you always.
Awesome to hear that, Olasoji!
Everything he said!
Thanks.what I can say God blessed us with a living signal which is Rayner. Best forex tool. I wish I can show you my real account.
You’re welcome!
I have always followed your weekly blogs and they have indeed being helpful.
Kindly send me a sample of your trading journal to enable me organize myself.
Regards,
Ernest.
You can follow the template here… https://www.tradingwithrayner.com/profitable-trader/
great article
Thanks Murphy!
Superb Rayner, you make understanding so simple. Thank you.
My pleasure!
Mr Rayner thank you so much for your book THE ULTIMATE GUIDE FOR PRICE… How can I download it. Plz I want to be your student and also be in your TEAM and trade. What do I do? How do I get a direct link? I have gone tru some of your videos eg Candlestick Pattern strategy, very simplistic n educative, tnx Bishop Eric Lazarus
Good content Rayner. Infact, you have revealed the most secret parts of technical analysis.
Why not talk in “mental chatter” during no opportunity days and professional traders emotional intelligence.
Thank you, Raja.
What do you mean by talk in mental chatter?
Sorry it is “talk on Self talk”
Ah okay I’ll look into it…
Great Rayner. As usual, await your in-depth knowledge share on the subject. Thank you.
This tutorial surpose to be not free of charge, because I know my self that it is not a cheap stuff. Thank you Tayner for becoming a blessing to me and to the whole society around the globe.
My pleasure!
rayner je ne sais pas comment te qualifier. J’ai plusieurs fois essayer de t’écrire en te soumettant mon réel problème et ce que je voudrais que tu m’apprennes dans le trading je suis prêt à payer le prix que tu demandes même si tu n’as pas besoin de nos miettes. c’est un signe de bonne foi de détermination, et de volonté . si tu fais ce travail gratuit, j’aimerais être un de tes abonnés pour une offre payante. je désire bénéficier des formations payantes chez toi. stp ne m’envoie pas une réponse automatique. je veux te lire sachant que tu m’as écris et plaise à Dieu je te verrai avant de mourir.
Wow! That’s super! You are a real master. Thanks a lot, master!
You’re welcome, Joseph!
Head and shoulders in downtrend and inverse head and shoulders in uptrend
Thanks for sharing, MK.
I thank you for your articles. A heart felt gratitude.
You’re most welcome!
Simple and clear to understand the chart patterns with your step by step teaching and narration……. thanks Rayner teo
You’re welcome!
Wonderful explaination
Thank you!
ke a leboga Rayner, Modimo a go segofatse ebile a go godise. in short i said thank you for this and may our God truly bless and increase you for life brother.
Thank you, Jooh!
Thank you for this imparting knowledge.
My pleasure!
Head and shoulders
Thanks for sharing!
Best lesson ever on chart patterns which many mentors dnt teach or know
Cheers bud
On your #3:Swing Points graph, you write ” Higher Highs and Lower Lows in an uptrend”
Is it correct or not?
It’s a typo, thanks for the heads up!
Head and shoulder pattern
You’re a genius. Thank you so much for your wonderful teaching. Lots of love from India.
Cheers
Dear Rayan thank you for all that you try to teach us, I want to ask you, Do you do training courses face to face?
Nope, I don’t.
Bless u …my trading strategy has started changing …tnx alot
Let me know how it works out for you, cheers.
Hey Superman you are superb bro…. i am following you seriously and i am your huge fan i am following you on telegram, you tube and Facebook bro….. you explain things very nicely….. Thanks for share nice blog Superman…..
Ohh i wanted to ask you one question Rayner is this concept also works for stock market or it will work only for forex please let me know… if possible…. Thank you.
Yes the concepts can be applied to the stock markets as well.
Really appreciate that master it really helpful. Anyway do you have team to trade that we can invest with you?
I don’t have such a service. And you’re welcome!
I have been following your work of love for some months now. If I discovered you earlier, I wouldn’t have lost a fortune or life savings. Work of love because you give all this for free and from the way you present your facts, I feel the zeal in you. God bless you.
Thank you, Eric!
This is really great info Rayner. With all the new stuff you bring out are you updating your price action and trend following books / guides?
Yes, the price action one has been updated. Will be updating the Trend Following one soon.
Thank you for this relatively simple, yet extremely effective approach to trading. Thank you for sharing this content, it really is a game changer.
Awesome to hear that!
Thank you Brother, I have really refreshed my memory.
Keep the good work.
Cheers bud
Very good,keep upload such inputs to trade better
Very useful to me…
Cheers
For the first time as a learner I traded with Head and Shoulder chart pattern and the trade went my way.
Thanks great Teacher!
Amazing article to learn a lot about TA. Thanks a million Rayner!
You’re welcome!
excellent article!
Thanks Krishna!
Before I read this article, I thought the price patterns will always point to the next price move.
I was wrong !!
Thank you Rayner for your enlightment 🙂
GBU Rayner
You’re welcome!
It’s really good!
It’s really nice!
Cheers
u r trade guru sir……
It’s a pleasure knowing more about price action
Thank you Rayner
You’re welcome, Henry!
Thankyou Rayner! Im feeeling better equipped, thru your guidance. My up comming stages are the computer ( gaming speed an the tools (computers software for charts an stuff). Getting excited an an nervous !!!!
Baby steps! Excited for you too, I know how it feels like when I just started out…
Thanks for the information. I am new in trading and I am gaining alot.
I am currently trading a demo account and am being stopped. After I set my trade using monthly and weekly chart.
Kindly assist me to interprete the different time chart to better my trades.
Hi Rayner
I tharowly studied your lessons on stock market it was really help full and I learned much things about stock market because of you thanks for that bro………
Anytime Marish!
Is this applicable to stock market?
Yes, the concepts can be applied to it.
Good trading idias and your experience so very much and I will send you sir and I am Indian market Traders.
Very informative, thanks sir
Cheers
Very clear. Thanks Ray
My pleasure!
Very good Rayner,,, you are the best…
You’re most welcome!
You just have a way with how you explain things so easily. Thank you so much
My pleasure!
You’re so awsome
Cheers bud
great article!
Thanks Jeff!
Thanks bro very usefull
Awesome to hear that!
This was such wonderful and most appreciated lesson
I’m glad to help!
Double shoulder head pattern
Are just amazing man
Hey Gowtham,
Thank you!
NSE & BSE
i like your explanations, everything makes sens and build a whole system which everyone can understand. thx a lot for your work. Keep it !!
Is there the opportunity to get the pullback book as ebook ?
Hey Daniel,
You are most welcome!
The pullback stock trading system, the book is only available in a hardcopy.
I have really learnt something out of this. Thanks alot
Hey Lizzy,
You are most welcome!
Candlestick
Hey hey my friend I like your simplicity when explaining these terminologies.I’m gaining more and more confident in my trading career especially since I am a beginner thanks a million my brother.
hey Mbongiseni,
You are most welcome!
Is really grateful for u to provide this coaching, it really help. God bless you.
Hi Alex,
Thank you!
are you just trading Forex or stocks futures and crypto too?
Great writeup sir thanks for the shared knowledge
Hi Kelvin,
You are most welcome!
good
Hi Pandu,
Thank you!
Hey hey, what’s up my trend??
Thanks a lot for the deep insight.
“Market sentiments is all one should look for in the chart.”
Hi Auckroh,
Thank you!
This material is really educational. You are truly concerned with my success. I will work hard to assimilate it. There is no better way of being a successful trader. Thanks once again Mr. Rayner
Hi Prince,
You are most welcome!
Thank you…
Very helpful content thanks Mr.Rayner because of you we are getting knowledge
Hi Ayushman,
You are most welcome!
Thank you…
A lotof info,understand chart patterns better.Thankyou.
Hi Robbin,
I’m glad to hear that!
Cheers…
Very helpful for newbies like me, thank you, more power.
Hi Tony,
You are most welcome!
Just a wowwww!!!! You are really amazing man …love your dedication and work ❤️
Hi Milind,
Thank you!
Cheers..
Explain in very easy language. I watching your every video , Superb . Built my confidence in trading because of you Rayner.
Thank you so much
Hi Nitin,
I’m so glad to hear that!
Cheers.
Thank you very much for this concept clearing awsome literature
Hi Ajit,
You are most welcome!
Thank you so much Rayner. You enlightened me.I learned a lot from you. I will continue learning from you. Thanks again.
Hi Sigrid,
Thank you!
super helpful as always! Thank-you Rayner.
Hi Michele,
You are most welcome!
Hi sir,
you are very special to me . keep it up sir .
Hi Umshankar,
I’m glad to hear that!
Cheers.
Thank you so much for such a detail explanation. Just what this newbie was looking for. It sure enlighten this delay brain of mine. Getting old.
Yes Rayner you sure are fair-dinkum!
Hi Alex,
I’m glad to hear that!
Cheers.
Can you explain SUPPLY AND DEMAND
I do not trade based on chart patterns but still an insightful info. I simply like your information sharing. Every time there’s something to learn. This time it was about BO with/without buildup. Thank you!
Hi Sameer,
You are most welcome!
Hey hey Rayner what’s appp ….
How are you man
You doing great things very silently… God gives blessings to you abundantly…
You shared
Whatever you learned….
Nobody doing like you …
Previously am lost so much of money in indian market…
And am not having any idea about price action…
But now a days am good in price action…you are my guru…
Now a days am not get big profits
But end of the day … 100% satisfaction on my analysis…
Hi Saravanan,
Thank you!
I am learning your strategies and implementing, and it’s working
Hi Muthu,
I’m glad to hear that!
thank you Rayner, it really help me that much
Hi there,
You are most welcome!
Cheers.
Superb sir,
you make understanding so simple,Thank you very much Rayner Sir
Hi Samarth,
You are most welcome!
Cheers.
I wish I could understand everything more better sir.. I’m a rookie in all this trying to find my way to be a better trader and I’ll appreciate any help you can offer to me.
Hi Yekini,
I appreciate your interest.
Check out the trading academy…
https://www.tradingwithrayner.com/academy/
i’m inspired with your lecture, God bless you
By my side I love to trade a dissending & ascending channel.. (multi touch) also falling wedge & rising wedge….. Expand triangle…
I love these patterns because these patterns many times is happens on the market and that’s simplest to spot.
Hi Shabandodo,
Glad to hear that!
Thanks for sharing your forex knowledge with us. It’s very helpful. I prefer to trade breakout with buildup at area of resistance bcos it’s easy to identify and you can easily know whether it’s false breakout or not it also give room for following the trend.
Cheers
Hi Hammed,
I’m glad to hear that!
Cheers.
Hi Ray it was a great reading explained in so much easy language thatit’s understandable to a stonehead (people says but I don’t agree) like me. A request can you please share something on buildup which you referred to many times in this. Thanks again. Prveen Thakur. psthakur67@gmail.com.
Hi Prveen,
Check out this video.
https://youtu.be/jyf4zN-qsFE
Please, I’ve come to a point of approving you as the most gifted forex lectucturer beside Rob Boker and Karen Foo. I always see genius kind of skill in your during your lecture. However, it has been argued that you you are theoretical and not practical. You never trade!!!!! Hence your words are hearsay.
Hi Micheal,
Thank you for those words.
Cheers.
I am in a mentor program but I watch Rayners videos every morning like a class! Thank you for helping me get even more understanding of trading.
Awesome to hear that, Latrece!
Thank you Rayner very good lesson head shoulder how to implement this on mt4 can you please help me send me templit
You explanation is really easy to understand. Thank you Rayner
Thank you, Eli!
Thank you so much for this wonderful lesson. My question is does this work also in crypto trading?
You are most welcome, David.
Take your time to backtest.
Cheers.
very nice content it is very useful to me. very nice explanation for understanding with examples…thank you.
Thank you, Ruchita!
Thanks rayner for helping us new trader
You are most welcome, Abdul!
Typo: But how do you the area of value?
Your content is so helpful, Am Grateful Rayner
Thank you, Brian!
Learning a lot thank you
You are welcome, Motshidisi!
In all of these charts, where do we entry….and what confirmation we need to look (if any) for entry?
I hope you are learning from these comments, cheeky hey!. anyway all the best, its a good way to earn from all your hard work and pitfalls and win experiences. I know little, but have a little discernment, which is my aid. I will attempt to keep up with you, but thehole will only go so deep, thanks Paul, like your style and effort.
Very well explained. Thank you Rayner
You are welcome, Jamal!
Like always an eye opener.
Awesome, Damanjit!
excellent compilation of chart patterns. Please share your knowledge of more advanced chart patterns
Thank you, Santosh!
Rayner, you are a great teacher. It runs in your blood. Clear, unambiguous and down- to-earth. Thank God for meeting you.
Awesome, Adebayo.
Keep winning!
Wow thank you so much boss this is really helpful keep it up sir I do I like head and shoulders patterns
You are most welcome, Happyboi!
I found this really helpful, thanks.
Hi Rayner, in forex and stock market, does these chart patterns play the same rule or there are a difference?
Double/triple tops and bottoms. Series of touches on a trendline.
I trade all chart patterns. Like this¡¡
* i let the pattern form complete
* if the price breakout at the neckline with strong momentum. I waint for pull back on the neckline
* if the pull back doesn’t occur i wait for high/low volatility contract to form. Then i go long when it breaks
* if it doesn’t form those two i wait for inside bar to form then i go long/short when it breaks on my favour
* or breakout with buildup
Thank you for sharing!
Bear and bull flag becz of good risk and rewards
Thank you for sharing your thoughts, Zafar!
Nice book sir you dis really well but sorry to say am not satisfied because you did not complete some information like the build up and other topics you treated on I hope complete it
Thank you Rayner u are Godsend… I appreciate your help
Happy to help, Elias!
HEY Rayner!i like double tops/bottoms but now i wanna do bull flag[i backtested it on US stocks and it’s working well.You helped me SIR to be honest,i can even square my account balance in 1 trade.THANK YOU SIR
That’s a piece of good news, Lesha!
Cheers!
Book pdf
Thank you
No worries, Kwalekeme!
what is the appropriate amount of cash needed to start trading forex in dollars?
Hi, Victor!
Jarin here from TradingwithRayner Support Team.
If you are new to trading, one major tip is to start small. Because sometimes your emotions are attached to your capital, which is how much you’re saving. Also, you only trade the money that you afford to lose so it won’t hurt that much if the market goes against your favor.
I hope this helps!
Good afternoon Rayner Teo
I’ll start by saying thank you for your help seriously you have changed me lot
I have been listening to you over six months now and I see something different in my trading journey
I’m planning to buy your book but it’s not working out
I live in Africa and I don’t know why the payment method is declining
Hi, Emmanuel!
You can still read Rayner’s book by purchasing the PDF version. If interested, feel free to email us at support@tradingwithrayner.com
Cheers!