What is a Shooting Star candlestick pattern and how does it work?
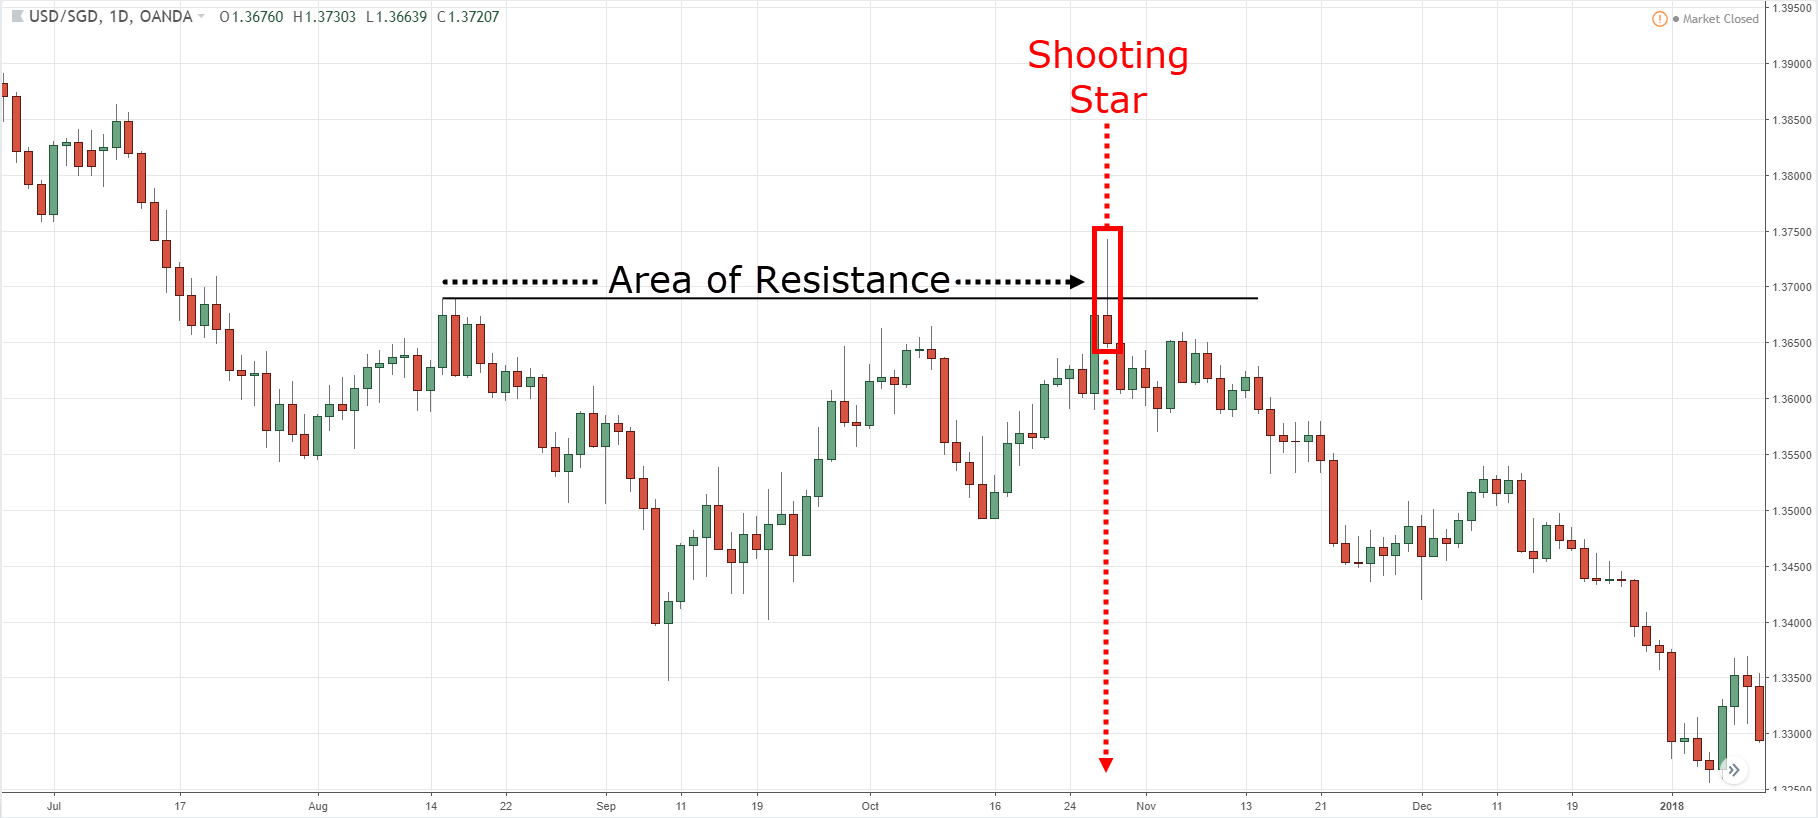
A Shooting Star is a (1- candle) bearish reversal pattern that forms after advancement in price.
Here’s how to recognize it:
- Little to no lower shadow
- The price closes at the bottom ¼ of the range
- The upper shadow is about 2 or 3 times the length of the body
And this is what a Shooting Star means…
- When the market opens, the buyers took control and pushed price higher
- At the buying climax, huge selling pressure stepped in and pushed price lower
- The selling pressure is so strong that it closed below the opening price
In short, a Shooting Star is a bearish reversal candlestick pattern that shows rejection of higher prices.
Don’t memorize the Shooting Star Candlestick Pattern, here’s why…
Now, the Shooting Star Candlestick Pattern is one variation of bearish price rejection.
But it can also appear in the forms like Bearish Engulfing Pattern, Gravestone Doji, etc.
So, don’t memorize candlestick patterns.
Instead, learn how to read it properly so you never need to memorize a single one ever again.
And all you need to do is ask yourself:
“Where did the price close relative to the candle’s range?”
Look at this candlestick pattern…
Let me ask you…
Who’s in control?
Well, the price closed the near highs of the range which tells you the buyers are in control.
Now, look at this candlestick pattern…
Who’s in control?
Although it’s a bullish candle the sellers are actually the ones in control.
Why?
Because the price closed near the lows of the range and it shows you rejection of higher prices.
So remember, if you want to know who’s in control, ask yourself…
Where did the price close relative to the range?
Next…
Don’t make this mistake when trading the Shooting Star candlestick pattern…
Here’s the thing:
Just because you spot a Shooting Star candlestick pattern doesn’t mean you go short immediately.
(I’m guilty of this too.)
Why?
Because you must also consider the context of the market (like the trend, the area of value, etc.).
If you don’t, then you could be shorting in an uptrend (which is a low probability trade).
Here’s what I mean…
Now you’re wondering:
“So how should I trade the Shooting Star candlestick pattern?”
“What’s the Shooting Star trading strategy then?”
Well, that’s what you’ll discover next, read on…
Introducing The M.A.E Trading Formula…
This is my proprietary trading formula and it’s powerful when combined with reversal candlestick patterns.
Here’s how it works…
- Market structure
- Area of value
- Entry trigger
Let me explain…
#1: Market structure
You’d know you should never trade candlestick patterns in isolation.
Instead what you want to do is ask yourself…
“What’s the current market structure?”
“Is it in an uptrend, downtrend, or range?”
Since the Shooting Star candlestick pattern is a bearish pattern, you’d want to trade it in a downtrend.
If you’re unsure how to identify a trend, then check out this training below…
Next…
#2: Area of value
Now just because the market is in a downtrend doesn’t mean you go short as the price could be at an “extreme” level (and about to snap back higher).
So, what you want to do is to trade from an area of value.
For example…
Don’t worry, I’ll provide examples on it later.
But for now, let’s move onto the next step…
#3: Entry trigger
This refers to the specific “pattern or signal” that will get you into the trade.
Since this is a Shooting Star trading strategy guide…
It’s about the Shooting Star candlestick pattern, let’s use this as an entry trigger.
So, here are a few examples on The M.A.E Trading Formula…
But remember, the Shooting Star is only one variation of bearish price rejection.
There are others like Bearish Engulfing Pattern, Dark Cloud Cover, Gravestone Doji, etc. — these can serve as an entry trigger too.
Don’t forget that.
How to set a proper stop loss and protect your trading account
Now, I think The M.A.E Trading Formula is awesome!
But here’s the thing…
No matter how good it is, you’ll still encounter losing trades — it’s a fact of trading.
That’s why you must have a stop loss in place so you can minimize the damage done to your trading account.
Here’s how…
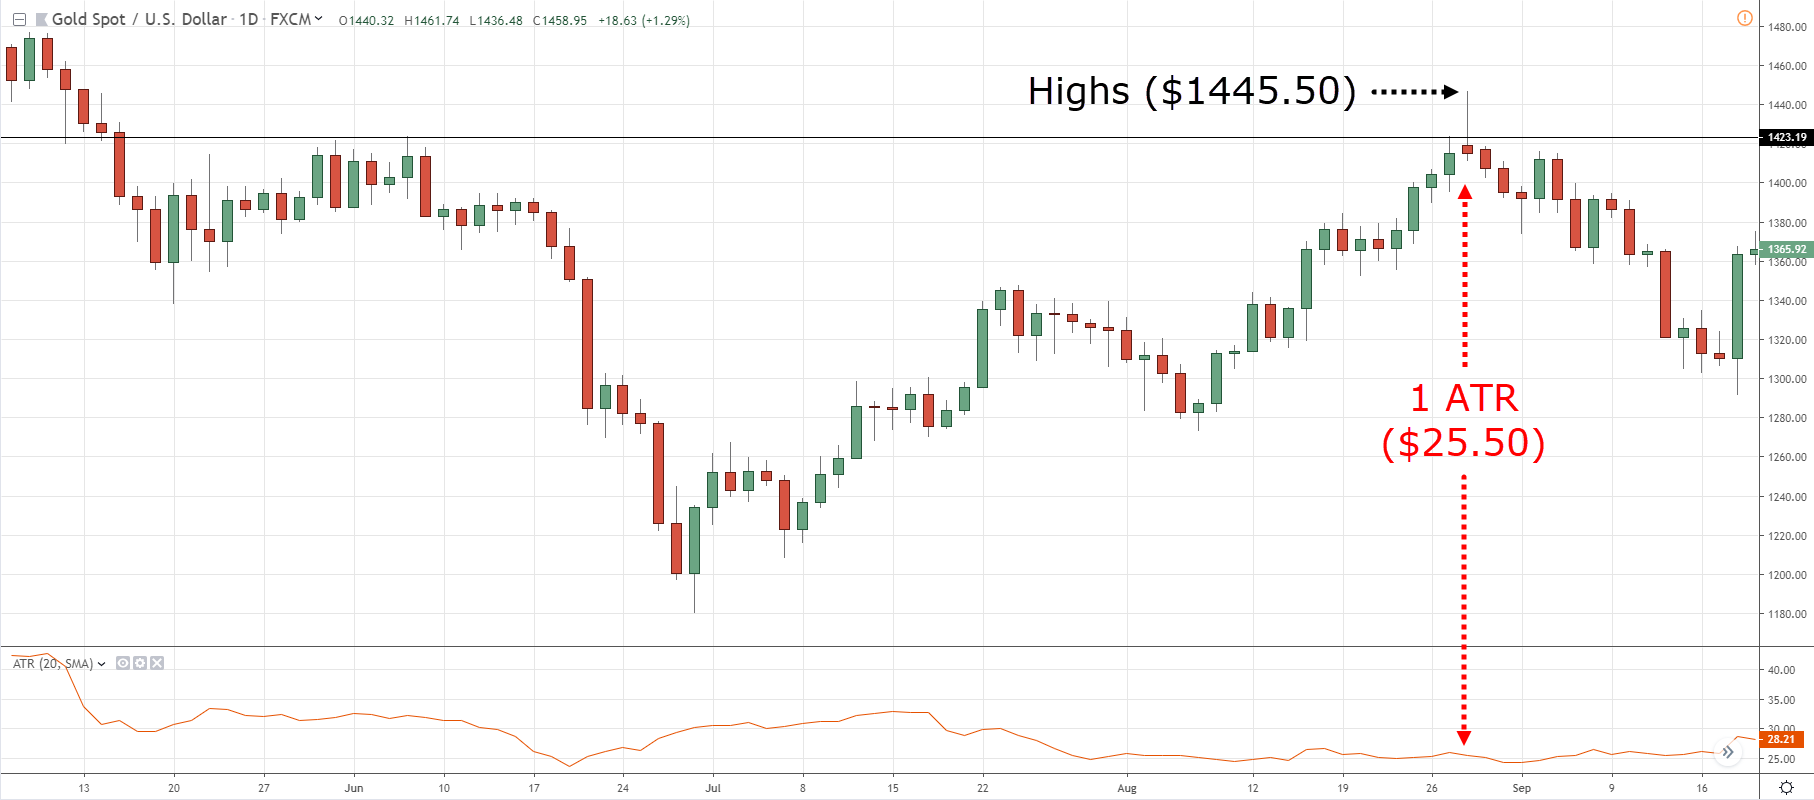
#1: Find out what’s the current ATR value of the market you’re trading
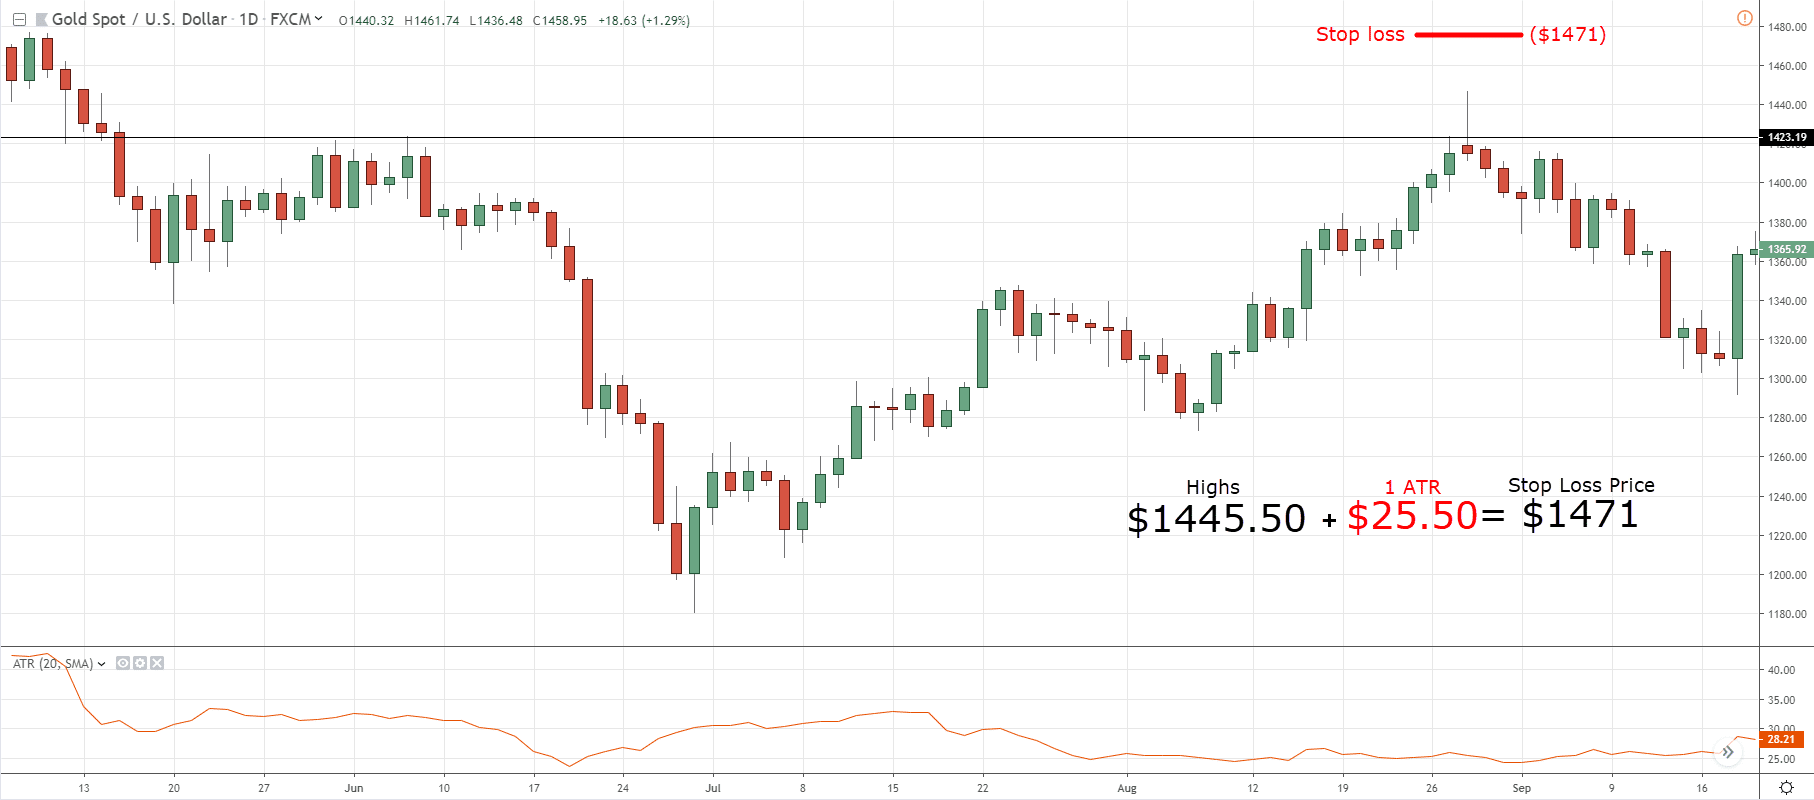
#2: Add the ATR value to the highs of The Shooting Star candlestick pattern, and that’s your stop loss level
Next…
How to exit your winning trades for consistent profits and ride massive trends
Now, the last part of the equation is to exit your winning trades.
And here are two ways you can go about it:
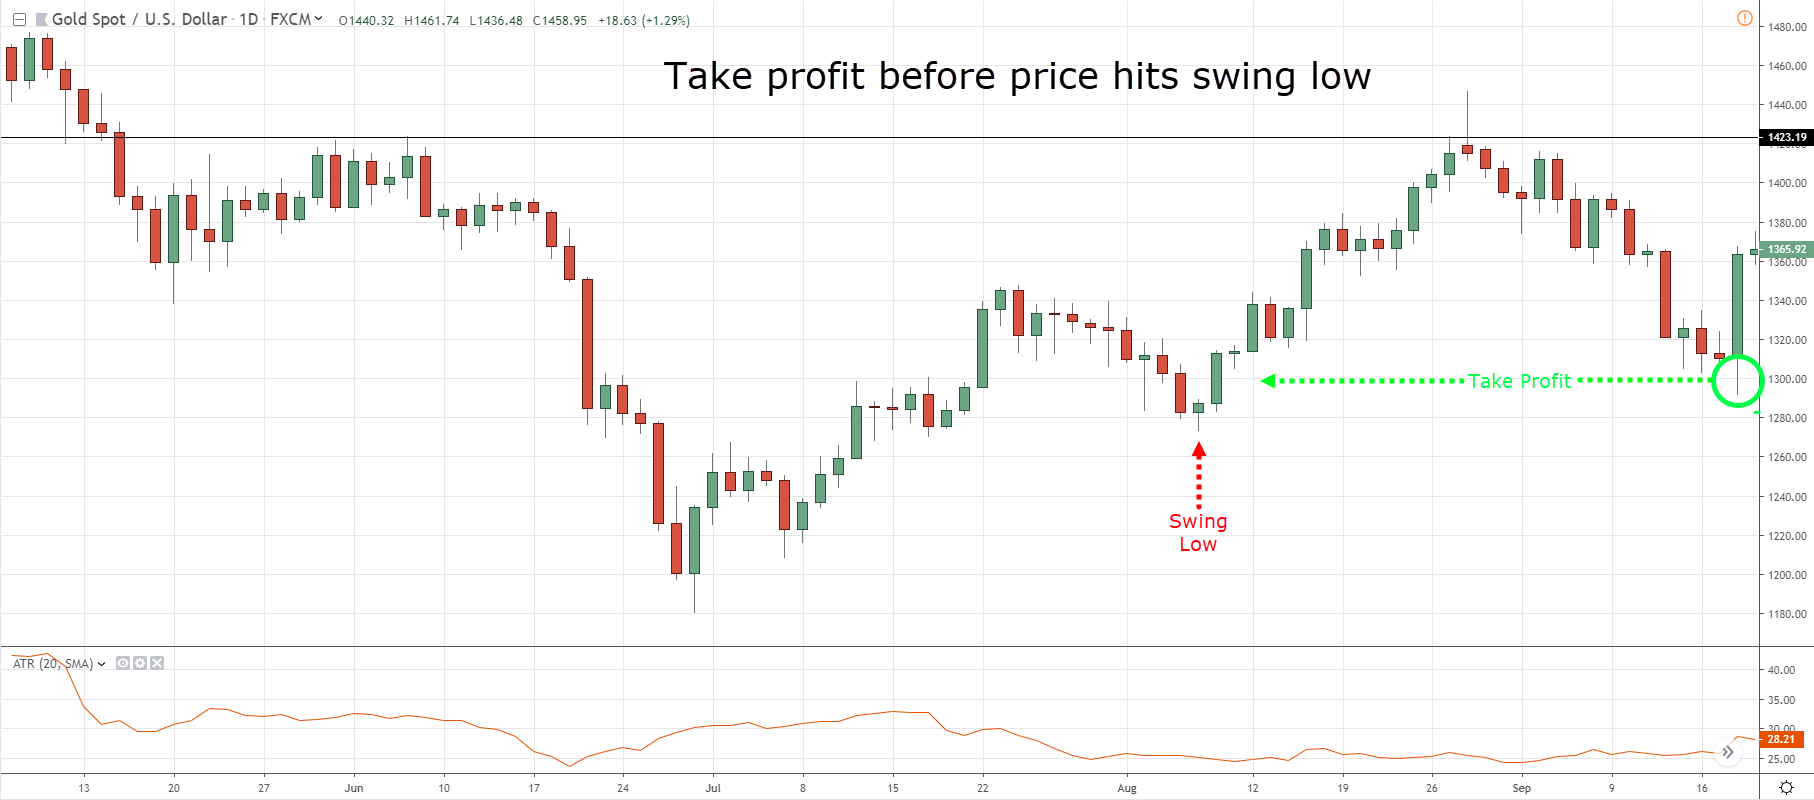
- Swing trading for consistent profits
- Riding massive trends others can only dream off
Let me explain…
Swing trading for consistent profits
As a swing trader, you’re only looking to capture “one move” in the markets, and that’s it.
This means you exit your trades just before opposing pressures steps in.
So, if you are long, then you can consider taking profits at Resistance, Swing highs, Fibonacci Extension, etc.
Here’s what I mean…
If you want to learn more, then check out The NO BS Guide to Swing Trading.
Moving on…
Riding massive trends others can only dream off
Here’s the deal:
If you want to ride a trend, then you must not have a fixed target profit.
If you do so, then you’re cutting your profits short (which makes it impossible to ride a trend).
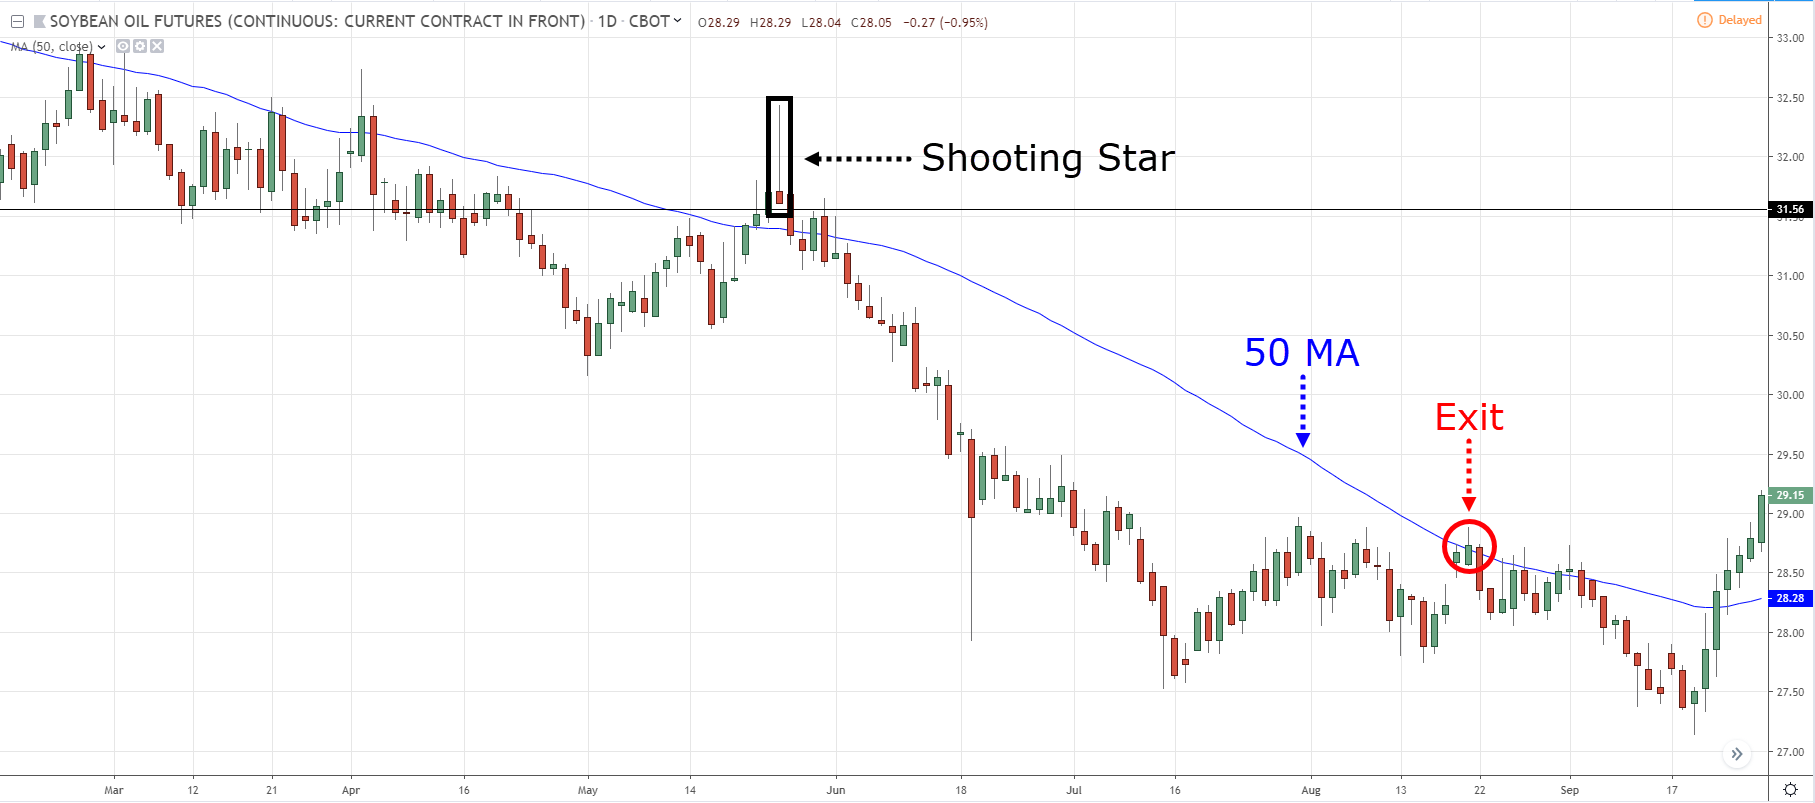
So if you want to ride massive trends, then you need to use a trailing stop loss.
Some examples of trailing stop loss are:
- Moving Average
- Chandelier Kroll Stop
- Market Structure
- Etc.
Here’s an example…
Now if you want to learn more, then check out 5 Powerful Techniques to Trail Your Stop Loss and Ride Massive Trends.
Bonus training: 3 powerful tips to increase the probability of your winning trades
Are you ready for bonus trading tips to improve the results of your shooting star trading strategy?
Then check this out…
#1: Focus on the major Resistance levels, that’s where traders get trapped
Here’s the thing:
When you trade The Shooting Star candlestick pattern, you want to focus on trading the major Resistance levels (the ones which can be seen on the higher timeframe).
Why?
Because when a level is obvious and the price breaks out of it, many traders will hop on the bandwagon and buy the breakout (hoping to catch a piece of the move).
However, if the price makes a false breakout, this group of traders is trapped, and their stops will trigger strong selling pressure.
Now, this is to your advantage because The Shooting Star candlestick pattern allows you to trade the false breakout and profit from “trapped” traders.
So the more obvious the level, the more traders will get trapped — and you make more money.
Next…
#2: The stronger the price rejection, the better
Imagine this:
There are two trains moving at 20km/h towards each other.
When they collide, what happens?
The front part of the train gets damaged and both trains come to a halt.
Now, what if one of the trains decides to increase his speed to 200km/h while the other remains at 20km/h.
Now, what happens?
Clearly, the faster train would destroy the slower one and continue moving while the other gets “kicked out” of the track.
Agree?
And that’s the same for trading.
When you trade price rejection, you want to be the faster train moving at 200km/h — that’s where you’re dominant.
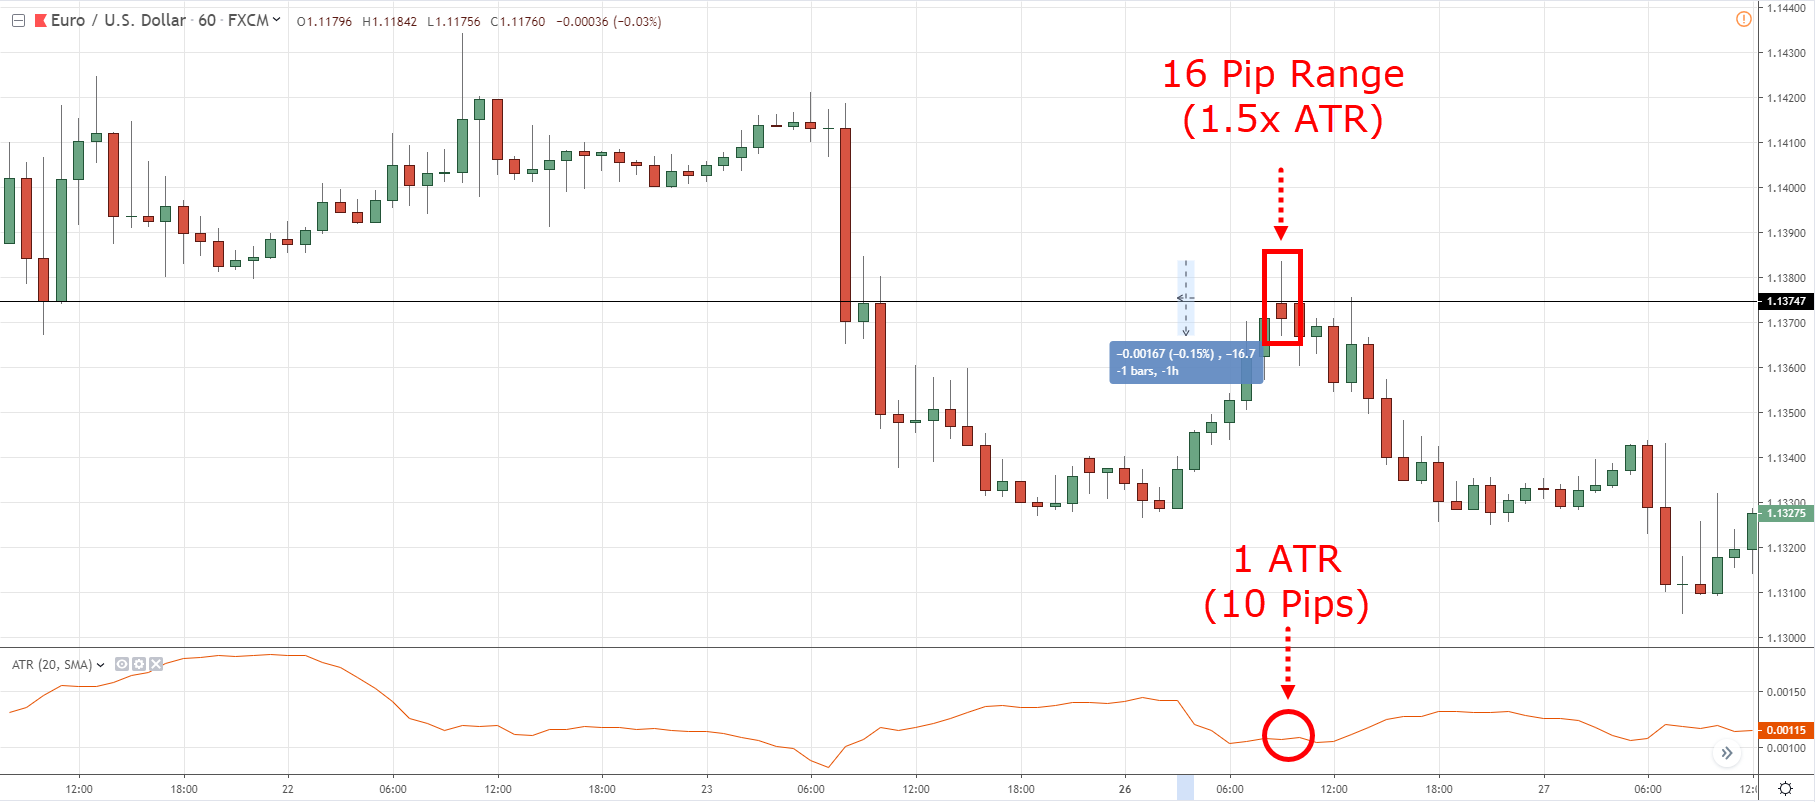
This means when you trade the Shooting Star candlestick pattern (or any type of price patterns), you want to see a strong price rejection.
And here’s how you identify a strong price rejection…
- Identify the current ATR value
- Check if the range of the reversal price pattern is 1.5 times larger than the current ATR value
- If it is, that’s a strong price rejection
Here’s an example…
Make sense?
Great!
#3: The stronger the momentum, the better
Here’s the thing:
When you trade reversals, you want to have a strong momentum move coming into the level.
(I know it sounds contradicting but bear with me on this.)
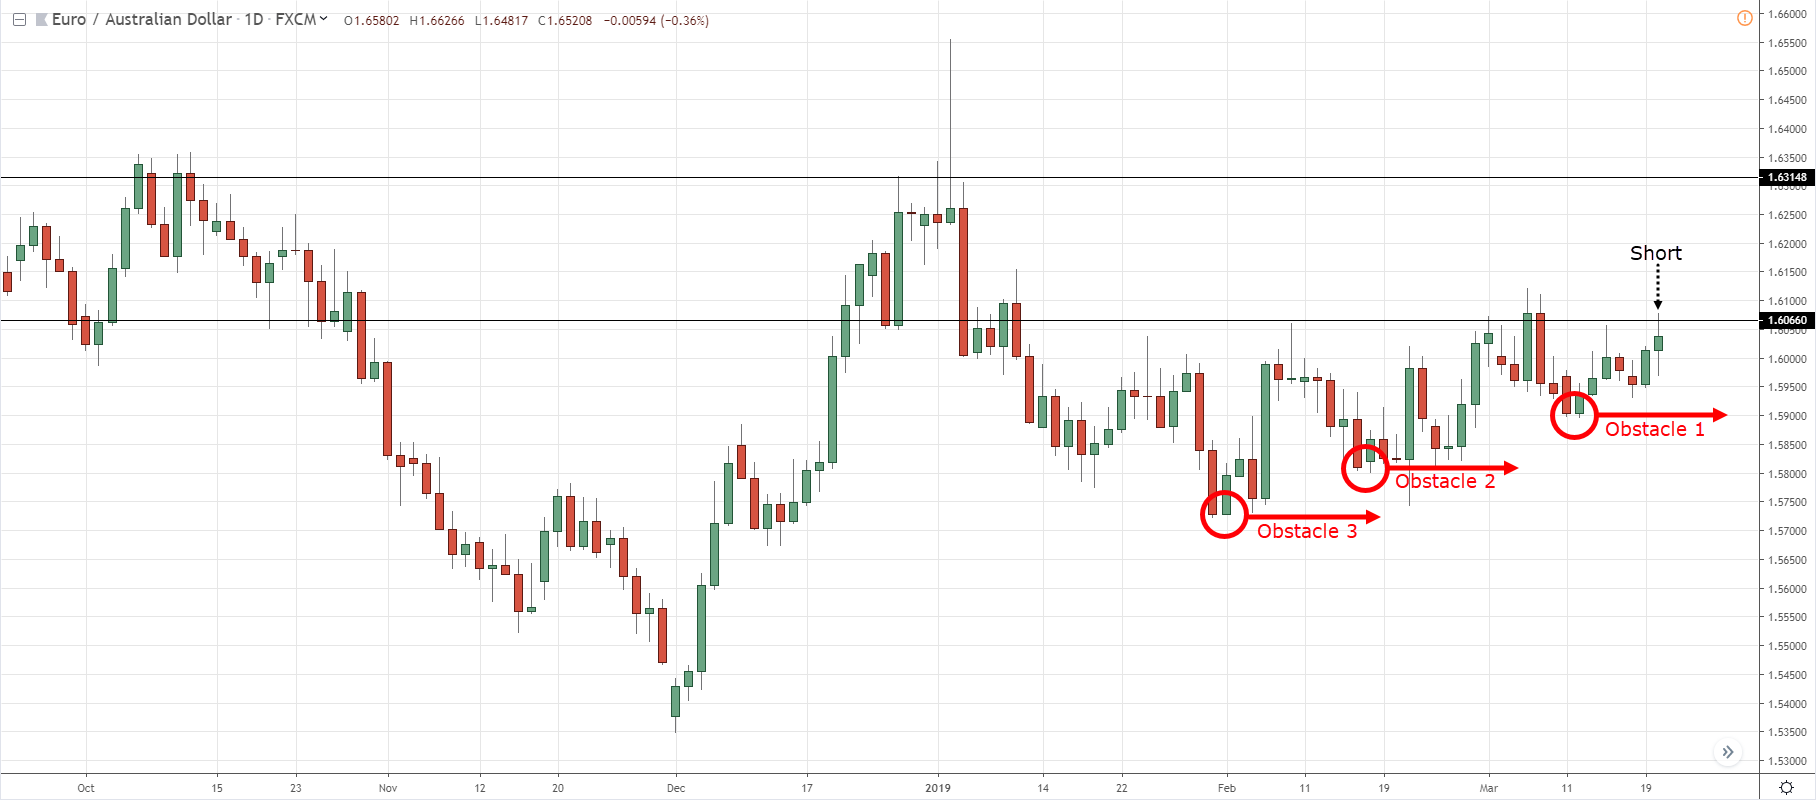
Because when there’s a strong momentum move, there’s little-to-no “obstacles” in your way.
This means the price has a lot of room to move before opposing pressure steps in (thus increasing your profit potential).
Here’s what I mean:
Now…
If you compare this to a “stair-stepping” move, you’ll face many “obstacles” in your way — and this reduces your profit potential and winning rate.
An example:
Clearly, if you want to trade market reversals, a strong momentum move is always preferred—especially when you’re doing Shooting Star trading.
Got it?
Conclusion
So here’s what you’ve learned today in this Shooting Star trading strategy guide:
- The Shooting Star candlestick is a bearish reversal pattern that shows rejection of higher prices
- Just because you a spot a Shooting Star candlestick pattern doesn’t mean you go short immediately because you must also consider the context of the markets
- The M.A.E Trading Formula to identify high probability trading setups (market structure, area of value, and entry trigger)
- Set your stop loss 1 ATR beyond market structure so your trade so you can avoid stop hunting
- Capturing swings and riding trends require different techniques. Know what you want and then use the appropriate method for it
Now here’s what I’d like to know…
How do you trade The Shooting Star candlestick pattern?
Leave a comment and share your thoughts with me.



Everything makes sense. For me, ONLY Trade at price levels, candle patterns, MA, etc more of a confirmation at these levels, but not against trend. My question is: these price levels ( support/resistance), do not last forever. What is our criteria, if any, for giving us some indication that a level is WEAK and may be BROKEN? (I don’t think buyers and sellers hang around these levels forever) so we add the stop loss. I’m thinking the best trade set up is the FIRST visit to a good level, maybe the second visit also. ( Yes, I have also studied your videos on how to ID good levels) so I’m looking to close these little question gaps to help build bullet proof investments. ( with stops) thanks RT, you’ve been a big help to that goal.
Hey Gary
I’d like to see a clean/power move into a level. The strongest the momentum the better.
If the price has a “choppy” move like higher lows into resistance, I’d avoid such trades.
I explain more about power moves in this video here and why it’s important…. https://www.youtube.com/watch?v=PuboYnBc0t8
Hello Rayner, thank you for all you do.
As a slight deviation from Gary’s question, how often should one redraw levels?(support/resistance, trend lines, etc)
Can it be daily or weekly, or every time you want to trade; for long term, medium term and short term types of trades?
Thank you.
Hey Rex
Check this out… https://www.youtube.com/watch?v=qm90uTnxY1U&t=156s
I enjoyed shooting star technique. Much value to know things to consider before trading the shooting star.
Also learnt how to use ATR to set stoploss- and identify high selling pressure.
Awesome to hear that!
Hey Rayner,
Great info and work. But, I am still unable to correlate the word “Pressure”. I may be missed some of your courses, but I want to learn it. Suggest me correct material.
Thanks
Thanks for teaching,it’s very informative and imparting.Thanks a lot Sir.
Cheers
It’s really to know, Pro. Trader works.
I make sure the body open and close within the previous candle, the wick must be away from other prices, it must form at resistance level and I wait for the second candle to close down, but, before the third candle completely take off.
Thanks for sharing, Steve.
The shooting star candle stick is a bearish candle showing you price is about to go downwards but from experience you should wait for confirmation before entering the market and understand the contest of the market.
Hi ! Reyner, I’m a follower of your all video lesson and I will thank you
for this sharing knowledge about market trading.
My pleasure!
Dear Rayner,
In the stop loss setting you indicated that “#2: Add the ATR value to the highs of The Shooting Star candlestick pattern, and that’s your stop loss level” which to me it is $1,445.50+$25.50 = $1,471 instead of $1,445.50-$25.50 = $1,420 as shown in your example. Is it a mistake or am I missing something? Thank you for your educational posts very informative and I am learning a lot from you.
Hey Basil
You’re right, there’s an error here.
I’ll fix it soon, thanks!
Very useful and enlighten write up
Thank you, Usoni.
Hi guys, I’m reading about the Chandelier Kroll Stop. What is the difference between P, X and Q when you are setting up the indicator on the graph?
How to set a proper stop loss and protect your trading account #2
it’s not correct.
Your post Add the ATR, but your graph show minus it.
Yup, we’ll get it fixed, thanks!
great content and admire that you give back of what was given to you!!! will you do a summary over the VECTOR pattern on canndlesticks? thx
I’ll look into it, cheers.
Rayner you are doing well in teaching us,well done!
Thank you for your kind words!
Thanks Rayner for a wonderful insight on the shooting star pattern. Also the ATR method for the stop loss and the 50 SMA for trailing stops was very well explained!
You’re welcome, glad to hear that!