You’ve probably heard this a million times…
“Don’t trade against the trend.”
And I’ve said it myself too.
But here’s the thing…
Trend reversal trading can be crazily profitable — if you do it right.
Imagine:
You know how to identify high probability trend reversal areas.
You can catch market tops and bottoms with heightened accuracy.
You can identify potential trading setups that yield 1 to 5 risk to reward (or more).
Now…
I know it sounds too good to be true.
But it’s not.
Because after reading this post, you’ll discover the secrets to trading trend reversal like a pro.
Here’s what you’ll learn:
- The most expensive mistakes traders make when trading reversal
- What are the 4 stages of the market and why it’s essential to a trend reversal trader
- How to identify trend reversal with deadly accuracy
- Trend reversal trading setups that work
- Trend reversal trading: Entries, stops and exits
Are you ready?
Then let’s begin…
Do you make these mistakes in reversal trading?
Here’s the thing:
Trend reversal trading can be a profitable way to trade the markets. However, like any other trading strategy, there is a correct and a wrong way to do it.
Before I teach you the correct way to do it, first let me explain how you should NOT trade market reversals.
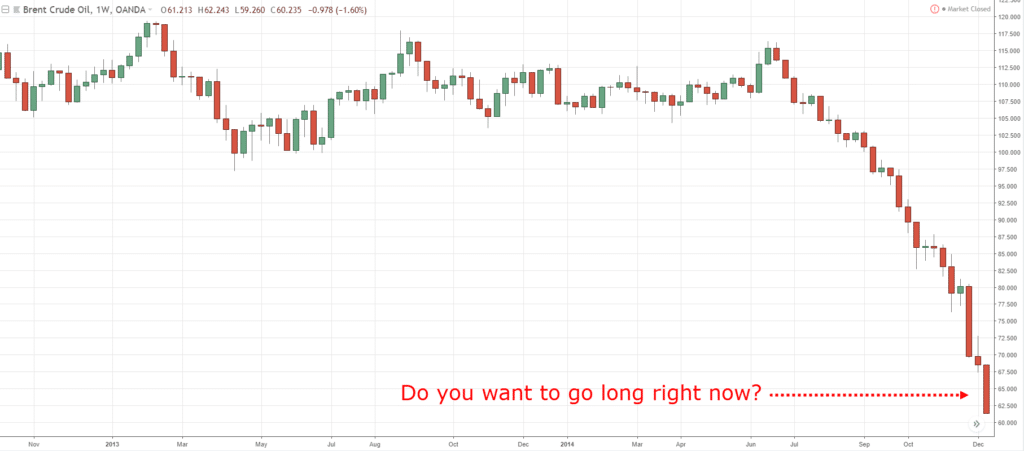
1. You’re catching a falling knife
For those of you who don’t know what’s catching a falling knife, it means trying to long the markets when it’s plummeting like a rock.
It looks something like this:
If you ask me…
There’s absolutely no sense in trying to catch a falling knife.
Why?
Because there’s no logical place to put your stop loss; there is no Support or market structure you can refer to.
And usually, the only way to set your stop loss is based on the equity left in your account — a surefire way to lose it.
“Rome was not built in a day, and no real movement of importance ends in one day or in one week. It takes time for it to run its logical course.”
So here’s the thing:
Trends need time to reverse after trading in its original direction. It needs to sucker in “the latecomers to the party” till there is no one left to buy — and that’s when it goes in the opposite direction.
2. You’re entering on the first pullback
Now, another mistake traders make is attempting to trade the first pullback.
This means you go long when you see the market rallies after a huge decline. But often, this type of rally is only a retracement of the existing trend.
Here’s what I mean:
You’re probably wondering:
“Why do traders do this?”
Because of the fear of missing out (FOMO).
You don’t want to miss the next big move, thus you enter as soon as the markets show a sign of reversal. Unknowingly, this sign is usually a retracement of the existing trend.
And even if you catch the bottom in the markets, it’s unlikely you’ll hold the trade for long.
Why?
Think about this…
Prior to this trade, you’d probably tried to catch market bottoms often.
And while doing so, you’d have suffered multiple losses along the way — and this hurts your psychology.
So, when you finally catch a bottom in the markets, you won’t hold the trade for long as you’ll experience the fear of losing (from your earlier trades).
This makes you exit your trades quickly and you end up missing the big move.
Now, let’s move on…
The 4 stages of the markets and why it matters
Now before you can identify trend reversal, you must understand the 4 stages of the markets (a technique I learned from Stan Weinstein).
Why?
Because this gives you warnings that market conditions are about to change — which lets you plan trading decisions ahead of time.
The 4 stages of the markets can be broken down into:
- Accumulation stage
- Advancing stage
- Distribution stage
- Declining stage
Let me explain…
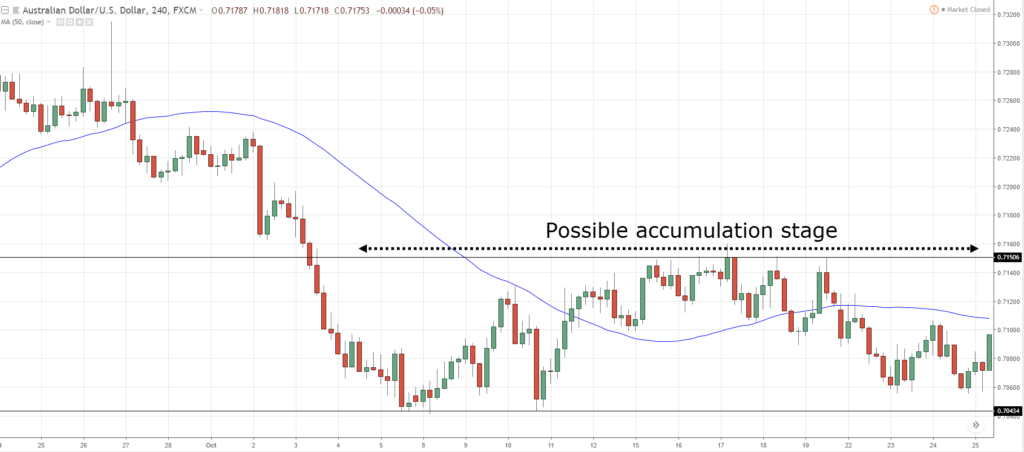
1. The accumulation stage
The accumulation phase looks like a range market in a downtrend.
However, from an order flow perspective, the buyers and sellers are in equilibrium (that’s why the market is in a range instead of a trending market).
Generally in the accumulation stage:
- The ratio of bullish to bearish candles are close
- The 50-period moving average is flattening out
- The price whips back and forth around the 50-period moving average
As time goes by, stops will gradually build up beyond the range as traders long near the lows and short near the highs of the range.
An example:
Now…
There’s no guarantee that the market will reverse after trading from here.
But it alerts you to the possibility that the bears are getting weak and the bulls could take control and push the price higher above the highs of the range.
And when this occurs, it leads us to the next phase…
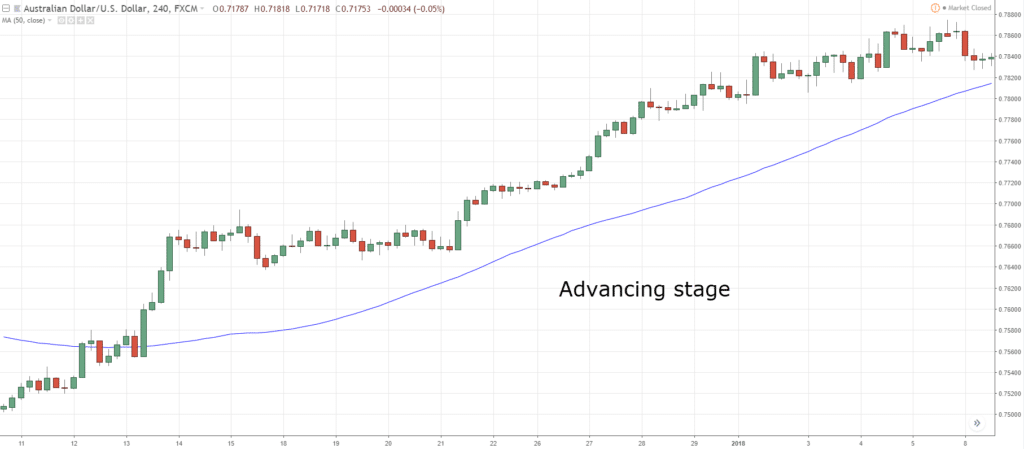
2. The advancing stage
The advancing phase is essentially an uptrend with price making higher highs and lows.
From an order flow perspective, the buying pressure overwhelms the selling pressure (that’s why the market is trending higher).
Generally in the advancing stage:
- There’s more bullish than bearish candles
- The bullish candles are larger than the bearish candles
- The price is above the 50-period moving average
- The 50-period moving average is pointing higher
An example:
Now…
The advancing stage eventually will need to “take a break” because the early buyers will take profits and sellers will look to short the markets as prices are at attractive levels.
When this occurs, it leads us to the next phase…
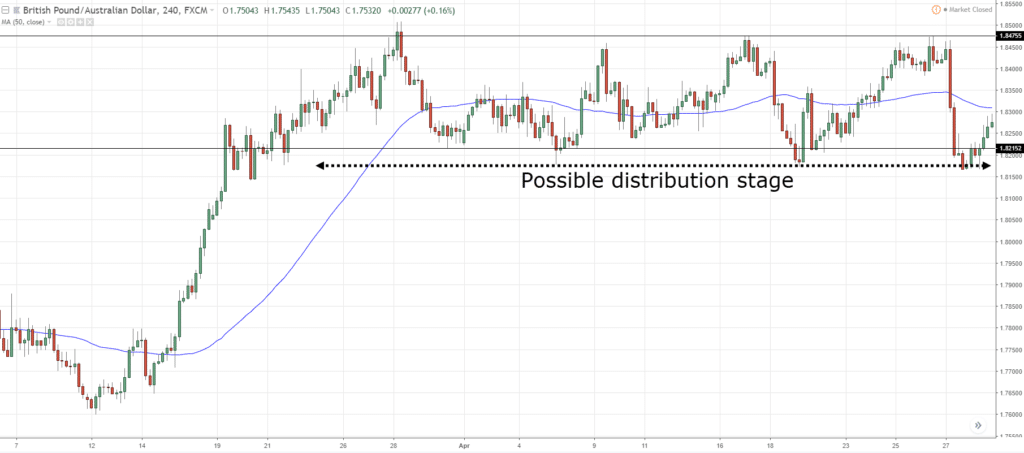
3. The distribution stage
The distribution phase looks like a range market in an uptrend.
It tells you the buyers and sellers are in equilibrium (that’s why the market is in a range instead of a trending market).
Generally in the distribution stage:
- The ratio of bullish to bearish candles are close
- The 50-period moving average is flattening out
- The price whips back and forth around the 50-period moving average
As time goes by, stops will gradually build up beyond the range as traders long near the lows and short near the highs of the range.
An example:
Now…
There’s no guarantee that the market will reverse after trading from here.
But it alerts you to the possibility that the bulls are getting weak and the bears could take control and push price lower below the lows of the range.
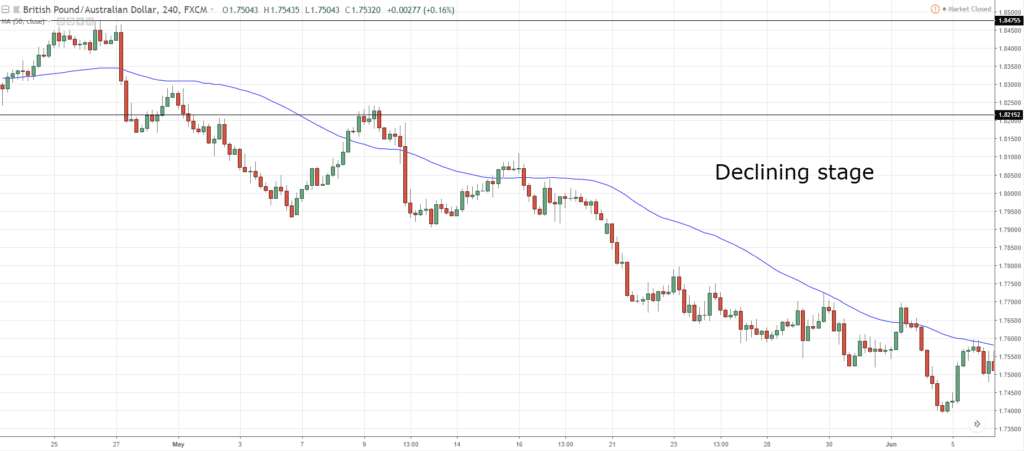
4. The declining stage
The declining stage is essentially a downtrend with price making lower highs and lows.
Generally in the declining stage:
- There’s more bearish than bullish candles
- The bearish candles are larger than the bullish candles
- The price is below the 50-period moving average
- The 50-period moving average is pointing lower
An example:
Now, the declining stage eventually will need to “take a break” because the early sellers will take profits and buyers will look to long the markets as prices are at attractive levels.
When this occurs, it leads us back to the accumulation phase.
How to identify trend reversal like a pro
Now you’re wondering:
“But Rayner, how do you know if the market will break higher of the accumulation stage, and not just continue trading lower?”
That’s a great question.
The secret is this…
You want to identify an accumulation stage that leans against the Support on the higher timeframe.
Here’s how to do it:
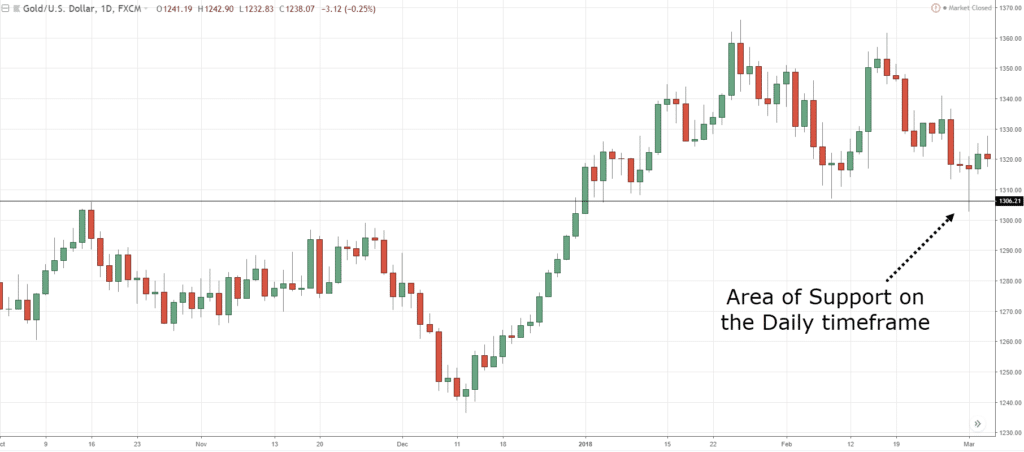
- Identify Support on the higher timeframe (e.g. Daily)
- Identify an accumulation stage on the lower timeframe (e.g. 1 hour)
Let me explain…
1. Identify Support on the higher timeframe (Daily)
Look the market to approach Support on the Daily timeframe; the more significant the level, the better.
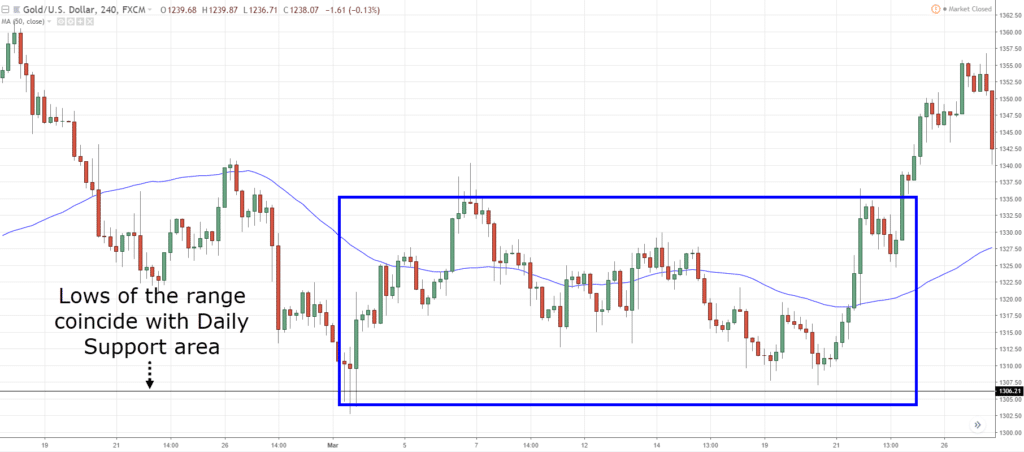
2. Identify an accumulation stage on the lower timeframe (1-hour)
Then, go down to the lower timeframe and identify an accumulation stage.
What you want to see is for the lows of the accumulation stage to lean against Support on the higher timeframe.
As a general guideline:
If you identify Support on the Daily timeframe, then you can identify an accumulation stage on the 1 to 4-hour timeframe.
Or, if Support is on the Weekly timeframe, then you can identify an accumulation stage on 4-hour to Daily timeframe.
Trend reversal trading setups that work
Now, there are 3 ways you can trade this setup:
- Support & Resistance
- The Breakout
- The Pullback
Assuming you’re using the Daily and 1-hour timeframe combination, these setups will be found anywhere between the 1 to 4-hour timeframe.
Let me explain…
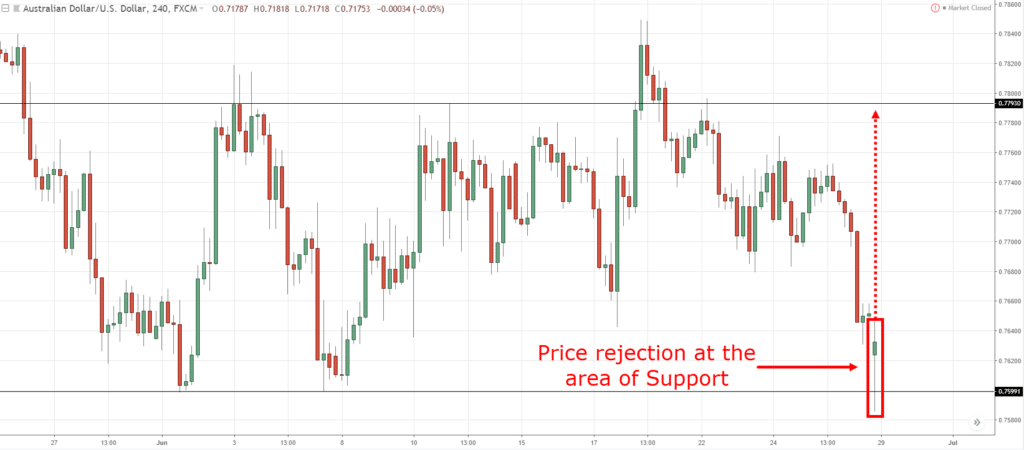
Support & Resistance
If you haven’t realized by now, the low of an accumulation stage is an area of Support (plus it’s leaning against the higher timeframe Support).
So, if you’re expecting higher prices, won’t it make sense to go long at this area?
Here’s what I mean…
Pros:
This setup offers a very favorable risk to reward as you’re entering in the earliest stage of the move. Imagine, your potential reward if the market breaks out of the accumulation stage?
Cons:
The price may not re-test Support thus not giving you an entry signal.
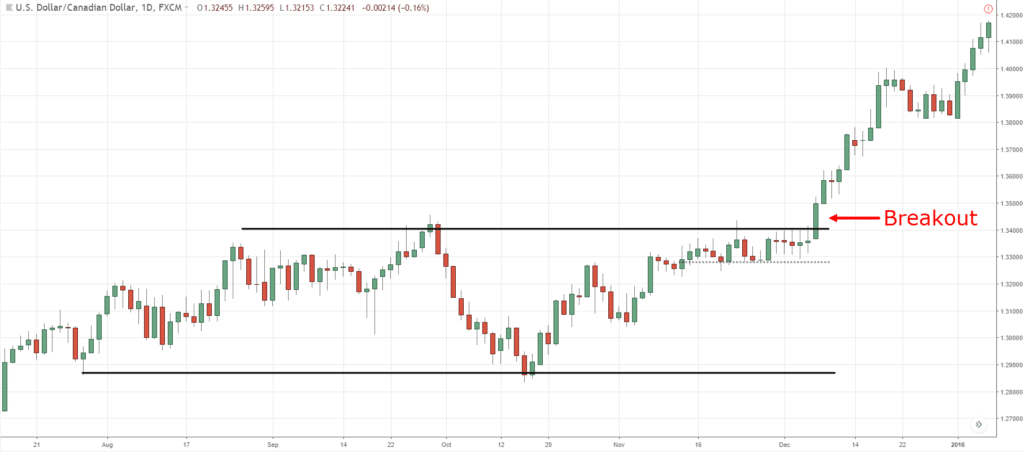
The Breakout
Alternatively, you can wait for the price to breakout higher and then enter the trade.
An example:
Pros:
You will catch every move as the market transit from an accumulation stage to advancing stage.
Cons:
It could lead to a false breakout.
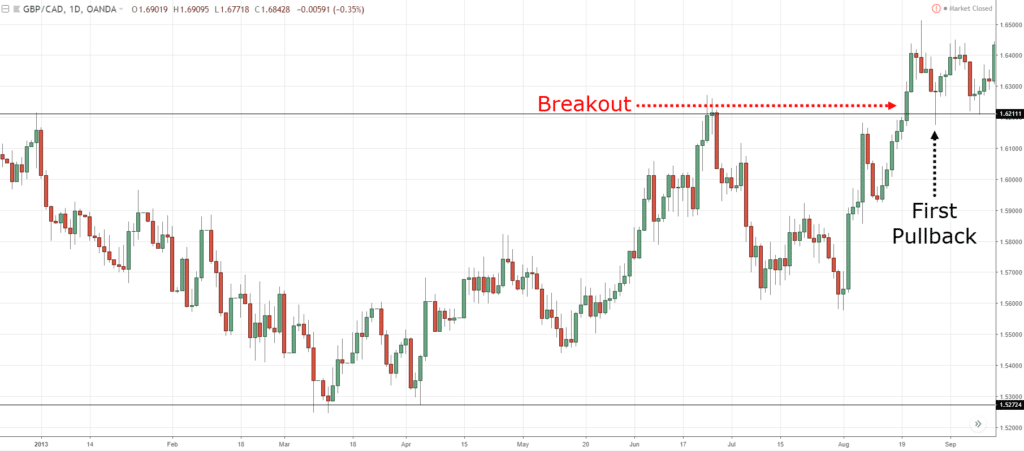
The Pullback
Lastly… you can wait for the pullback to occur before entering the trade. For example, when the price retraces to previous Resistance turned Support, and forms a bullish reversal candlestick pattern.
Here’s what I mean:
Pros:
This setup offers a favorable risk to reward as you’re entering at an area of value (previous Resistance turned Support).
Cons:
The pullback might never come and you risk missing the move.
Next, you’ll discover how to time your entries, stops and exits when trading trend reversal.
Read on…
Trend reversal trading: Entries, stops and exits
So now the question is…
How do you time your entries in trend reversal trading?
Well, there are two ways to go about it…
- Limit order
- Reversal candlestick pattern
I’ll explain…
1. Limit order
You can set a limit order and enter without “confirmation”.
The good thing is you have a favorable risk to reward on your trades as your entries are near the highs/lows.
The downside is it’s psychologically difficult to buy when the market is falling (and you need the experience to know which levels are worth trading).
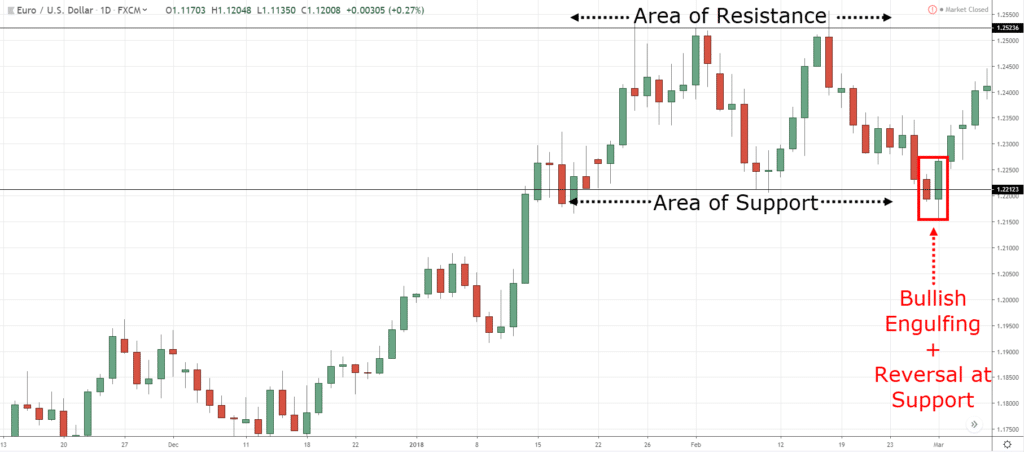
2. Reversal candlestick pattern
Or, you can use reversal candlestick patterns to time your entry (like Bullish Engulfing, Hammer, etc.).
So, you’ll enter a trade only after the market shows signs of reversal. However, you risk entering at a much higher price.
Here’s an example…
Bullish reversal candlestick pattern at Support:
Moving on…
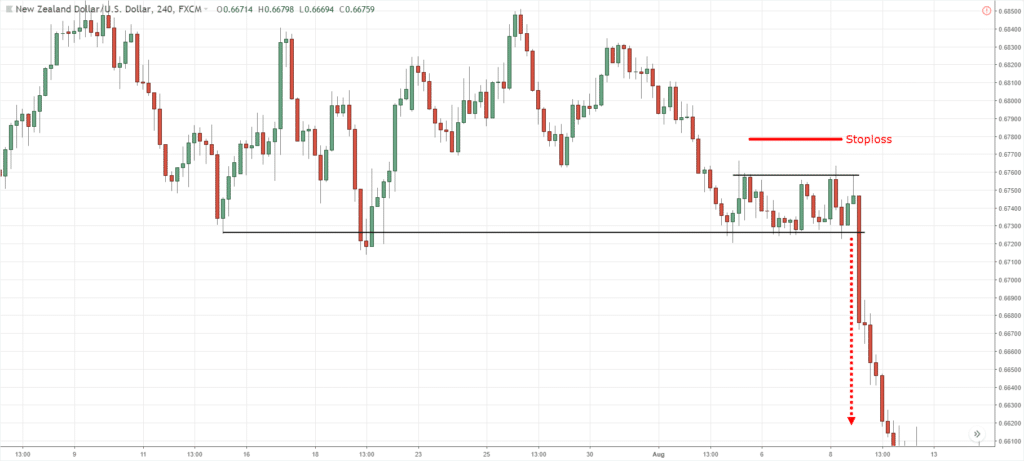
How to set a proper stop loss in trend reversal trading?
When it comes to stop loss, you want to place it at a level that invalidates your trading setup.
This means if your stop loss is hit, then the trend reversal patterns are “broken” and there’s no reason to stay in the trade any longer.
Here’s an example…
Let’s say you buy the breakout of Resistance.
Clearly, if the breakout is real, the price shouldn’t return into the range or else, it’s a failed breakout.
This means you can set your stop loss below Resistance where the price shouldn’t return to.
If it does, you know your trading setup is invalidated and it’s time to get out of the trade.
Here’s what I mean…
Now if you want more details on setting proper stop loss on your trend reversal patterns, then go watch this training below…
Next…
How to exit your winning trades
Now, your exits depend on your goals.
What do you want to accomplish — capture a swing or ride a trend?
Capture a swing
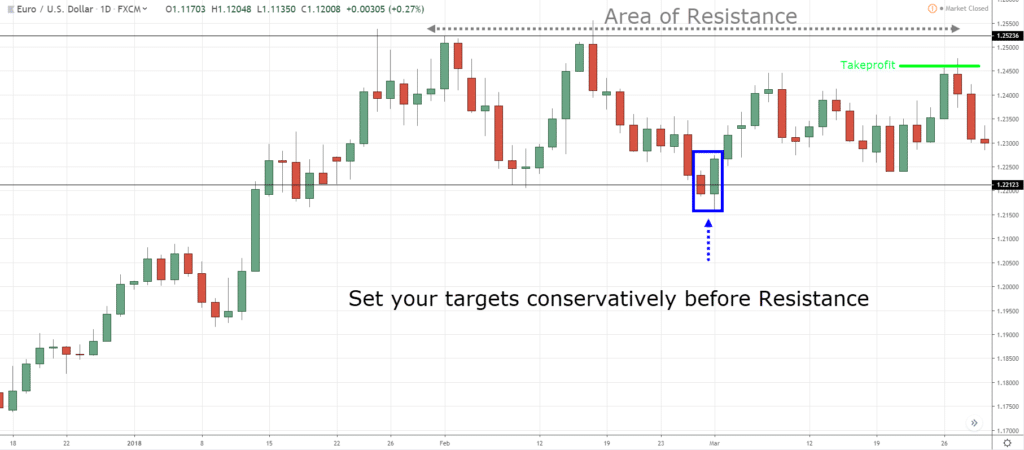
If you want to capture a swing, then you can exit your trades before opposing pressure steps in.
For example:
If you’re long, then you want to exit your trade before Resistance or swing high.
Here’s what I mean…
Ride a trend
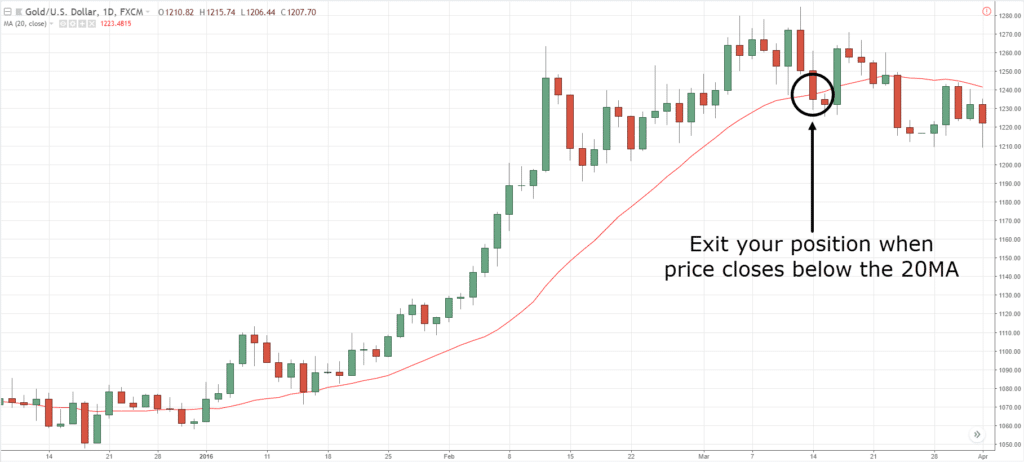
And if you want to ride a trend, then you can trail your stop loss as the market moves in your favor.
For example, you can trail your stop loss using the 20MA.
Here’s an example…
Does it make sense?
Great!
Summary
In this trend reversal trading strategy guide, you’ve learned:
- Never catch a falling knife or trade the first pullback of a downtrend
- Understand the 4 stages of the market so you know when the price is likely to make a trend reversal
- Trend reversal trading setups: Support & Resistance, the Breakout, and the Pullback
- You can enter on a limit order or wait for a candlestick reversal pattern to time your entry
- You should set your stop loss at a level where if reached, your trading setup is invalidated and you’ll get out of the trade
- There are 2 ways to exit your winning trades, capture a swing or ride the trend



Tutorial seems good, Even I tried bear flag trading blog, it works and it is good that I got one more strategy and practicing it. But I’ve a doubt.
How to scan or find the stocks which are trending reversal or formed bear flag…?
Fibonacci retracement tool may help you to findout exact reversal points.
I don’t know of such tools…
Then how do you find these kind of trend reversal stocks ??
Manually scanning the stocks for market structure, I guess
hi Rayner! Which platform includes donchian channel indicator?
TradingView
Do u have done any video on Fibonacci retracement? If no can u do it
……great article Rayner!!
Cheers Gavin!
Thank you very much Mr Rayner for a well elaborated Reversal Trading process.
You’re welcome, Ananth!
Excellent article on the Reversal Strategy Rayner , appreciate your time and dedication to helping traders, God Bless
Cheers Mike
Great strategy indeed. Keep up the good work!
I will!
As always you the BEST
Cheers
this was very help to me.Thanks
You’re welcome!
Thank you Sir
You’re welcome!
I understand everything expect the take profit i don’t know how to take profit
These post will help with your exits…
https://www.tradingwithrayner.com/set-stoploss/
https://www.tradingwithrayner.com/2-how-to-know-when-is-the-best-time-to-exit-your-trades/
Simply great elaboration
Thank you!
Excellent article really liked it. The structure of article is great!
Thank you!
Good lesson…helpfull to newbie like me…thanks master ray…
My pleasure, Iko!
Informative, simple to follow, realistic.
Thank you, Shapour.
Nice blog Rayner you are really super man good bless you..
Cheers Rahul
Hi Rayner..im truly happy that i came across your expertise in trading, you’ve helped me by broadening my knowlegde and how i view and trades the markets, keep up the awesome work my friend. thank you!!
You’re welcome, Linda!
Really great stuff; thanks and God bless
Thank you!
love your info. Putting it all into practise.
Awesome let me know how it works out for ya!
thumbs up for you Rayner ,you are great
Cheers bud
Thanks for sharing this information with us. I really appreciate your work. Keep it up.
You’re welcome!
GREAT TEACHING BY RAYNER, AM GRACEFULLY AND GRATEFULLY FOLLOWING.
I LOVE TO PRACTISE MY LEARNING WITH A DEMO ACCOUNT, PLS ENABLE ME WITH ONE AND I WILL BE MORE GRATEFUL. THANK YOU.
I have just noticed your site and it looks beneficial. I will be checking out your site regularly.
Cheers
need scalping technique sir
Thank u very much
My pleasure!
Sir Amazing support..you are doing Excellent
kindly share trend reversal PDF please..
You are just God sent .
I appreciate your work, you changed my mentality as a trader.
I wish I can hug you now.
Glad to help out!
Thank you for this piece, it highly intriguing and no doubt it will further fine tune my trading skills.
Hey Colinbitx,
I’m glad to hear that!
Hey Rayner your books are really helping me. I would love if you can send all books to me so that I can ready even without internet.
Hi Dube,
Thank you!
YOU ARE MISSING 5 OR 6 CHARTS TOWARD THE END OF THE ARTICLE. IT IS OBVIOUS. YOU CALL FOR CHARTS AND IT IS BLANK. NO CHART. SOMETHING WENT WRONG. YOU QUIT TOO EARLY. SOMEONE DID NOT INSERT THE CHARTS. A BUNCH OF THEM ALL MISSING. THE CHARTS JUST END AND NO MORE CHARTS IN THE ARTICLE. PLEASE FIX IT. SO EVERYONE CAN READ IT PROPERLY
Hi Rayner. With regards to the accumulation and distribution stages. What if if a reversal pattern appears. Do you agree that its a trap?
This was extremely helpful Mr. Rayner. Even though I am in the IM Academy, I appreciate what I have learned from you!
Awesome, Nyles!
Keep winning.
Thank u for the article, well understood. I’m a beginner in this trading battlefield could u recommend ur trusted trading platform, F.Y.I I live in Indonesia.
Hey Syanti,
Please write to,
support@tradingwithrayner.com
Cheers.
Excellent Sir
Thanks!
Thanks a lot Rayner world best teacher
It’s our pleasure, Nakul!
Thanks for sharing… I’d found an important lesson that might enhance and compliment my trading strategy in forex …thanks a lot trading with rayner
Glad we could help, Jun!
I like these teachings they give me confidence to enter in the market
Hey there, Sibongile.
Jarin here from TradingwithRayner Support Team.
I am happy to know it boosts your confidence. Focus on the process and keep on learning.
Cheers!
I can’t thank you enough for all the lessons over here and on telegram. You are my hero. But can you please elaborate more on multiple timeframe analysis? For instance, identify accumulation stage on the high timeframe and that of low timefram, I’m lost on that.
Hey there, Mohammed!
Jarin here from TradingwithRayner Support Team.
Here is a link that may help you Identify the accumulation stage:
https://www.youtube.com/watch?v=eddj9v1CfA4
https://www.youtube.com/watch?v=muYbMkfLqFY
Hope that helps!
I’m a bit confused on section “2. You’re entering on the first pullback” Isn’t the first pullback where you look to enter if you missed the first move?
Man I have been re reading ur guides,now they building Superman in me
Wow, That’s great to hear!
Cheers!