Trend Line is one of the most versatile tools in trading.
You can use it in day trading, swing trading or even position trading.
However, most traders get it wrong.
They draw Trend Lines looking like this…
I know I’m exaggerating, but you get my point.
That’s why in today’s post, you’ll learn:
- What is a Trend Line and how does it work
- How to draw a Trend Line correctly (that most traders never find out)
- How to use Trend Line to identify the direction of the trend — and tell when the market condition has changed
- How to use Trend Line to better time your entries
- The Trend Line Breakout strategy
- How to ride massive trends using a simple Trend Line technique
- How to use Trend Line and identify trend reversal
Or if you prefer, you can watch this training below…
What is a Trend Line and how does it work
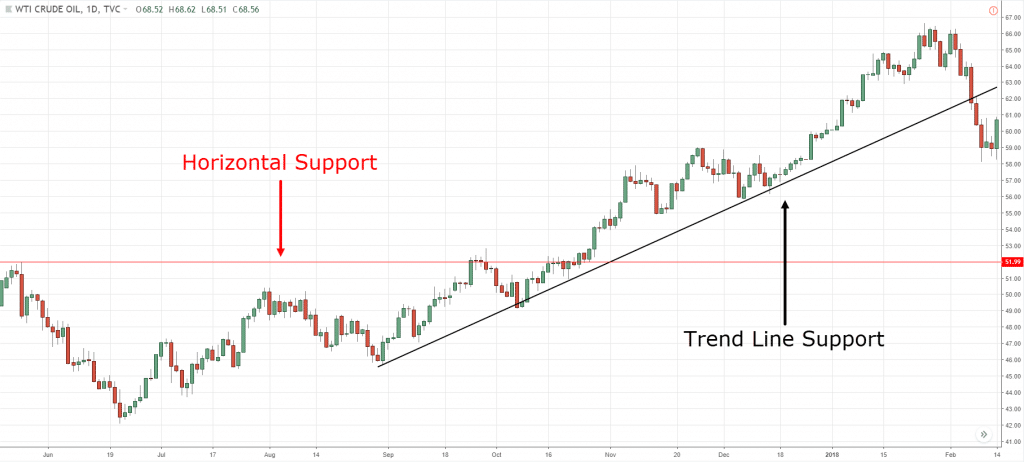
You know Support and Resistance are horizontal areas on your chart that shows potential buying/selling pressure.
And it’s the same for Trend Line.
The only difference is… a Trend Line isn’t horizontal but sloping.
Here’s a Trend Line example:
So here’s my definition of it:
Upward Trend Line: “Sloping” area on the chart that shows upward buying pressure.
Downward Trend Line: “Sloping” area on the chart that shows downward selling pressure.
Now before I dive into specific Trend Line strategies and techniques, you must first learn how to draw a Trend Line correctly.
And that’s what I’ll cover next.
So read on…
How to Draw a Trend Line correctly
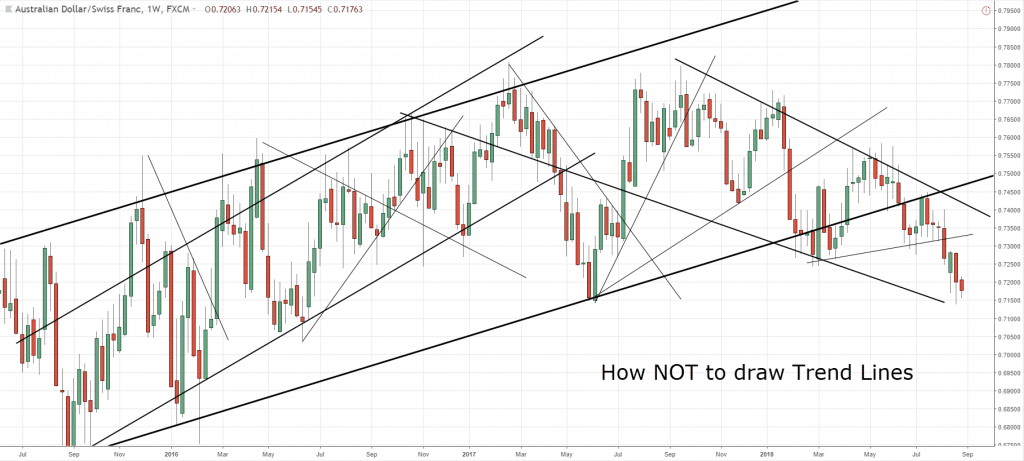
First, let’s learn how NOT to draw your Trend Line.
Here’s a bad example:
Clearly, this is garbage.
How do you know which Trend Lines are important? And which types of Trend Lines to ignore?
You’ve no idea.
So listen carefully:
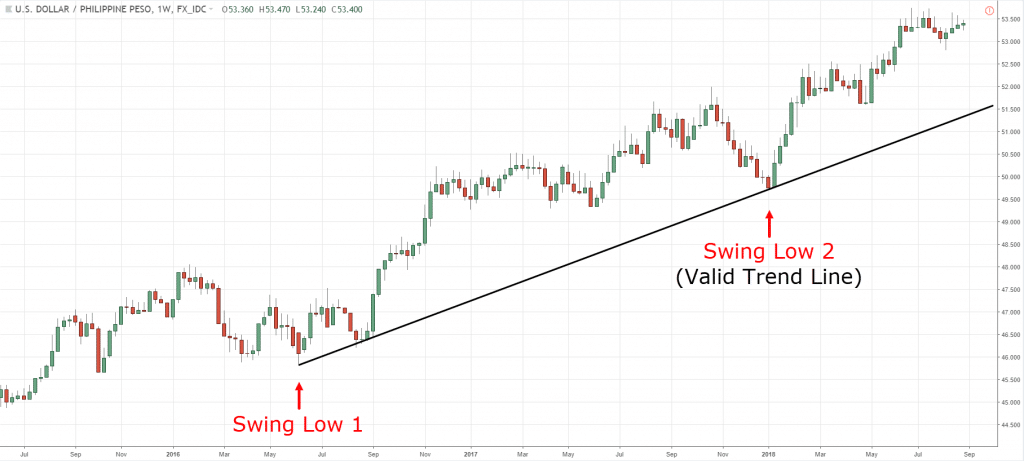
Here’s how to draw a Trend Line correctly…
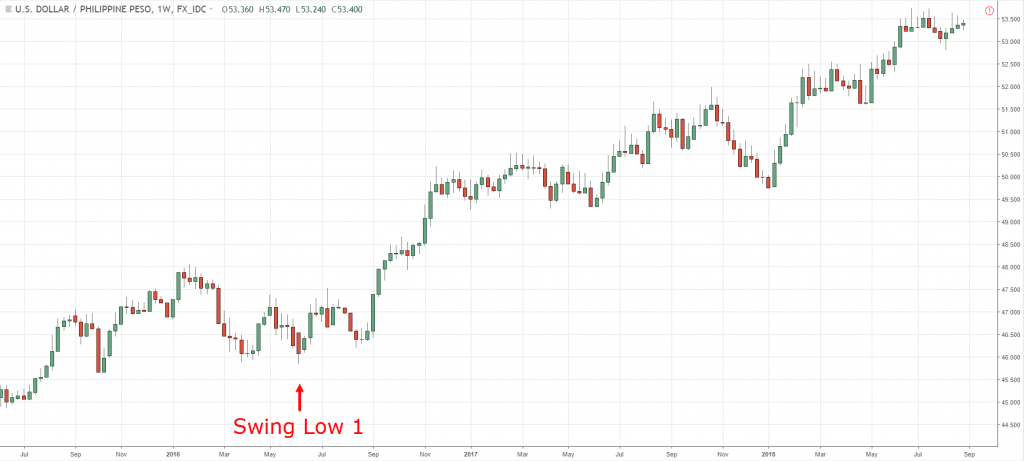
- Focus only on the major swing points and ignore everything else
- Connect at least 2 major swing points
- Adjust it so that you get the most number of touches (whether it’s body or wick)
Here’s a Trend Line example:
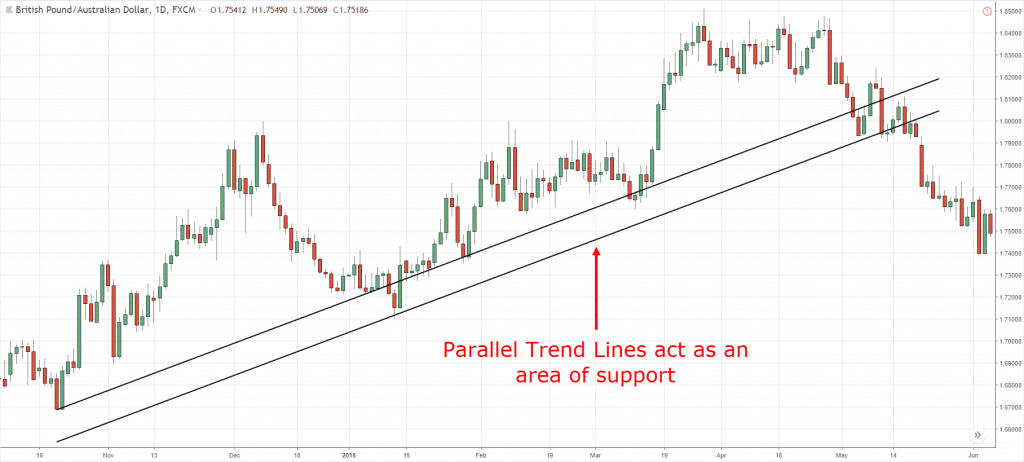
Pro Tip:
You can draw 2 parallel Trend Line to define the area on your chart.
Here’s an example…
Now…
Unlike Support and Resistance where you can just draw once and leave it, Trend Line needs “adjustment”.
This happens when the price breaks the Trend Line and then recovers — and you need to “adjust” the Trend Line to fit the recent price action.
Moving on:
You’ll learn how to use Trend Lines to improve your trading results…
How to use Trend Line to identify the direction of the trend — and tell when the market condition has changed
All you need to do is draw your Trend Line and ask yourself…
“Is the Trend Line pointing higher or lower?”
If it’s higher, then the market is in an uptrend (and vice versa).
An example:
But that’s not all.
Because a Trend Line can also alert you when market conditions are changing.
How to use Trend Lines to know that?
By paying attention to the steepness of the Trend Line.
For example:
If your Trend Line is getting flatter, it means the market is moving into a range condition.
And if your Trend Line is getting steeper, it means the trend is becoming stronger (or possibly going into a buying climax).
Is this important?
Heck yes!
Because if you know market conditions are changing, you can adjust your trading strategy accordingly.
And not use the same “trick” for all market conditions — which is a recipe for disaster.
Next…
Trend Line Trading: How to better time your entries
If you want to find good trading opportunities, then you must trade near the Trend Line.
This allows you to have a tighter stop loss on your trades — which improves your risk to reward.
But that’s not all…
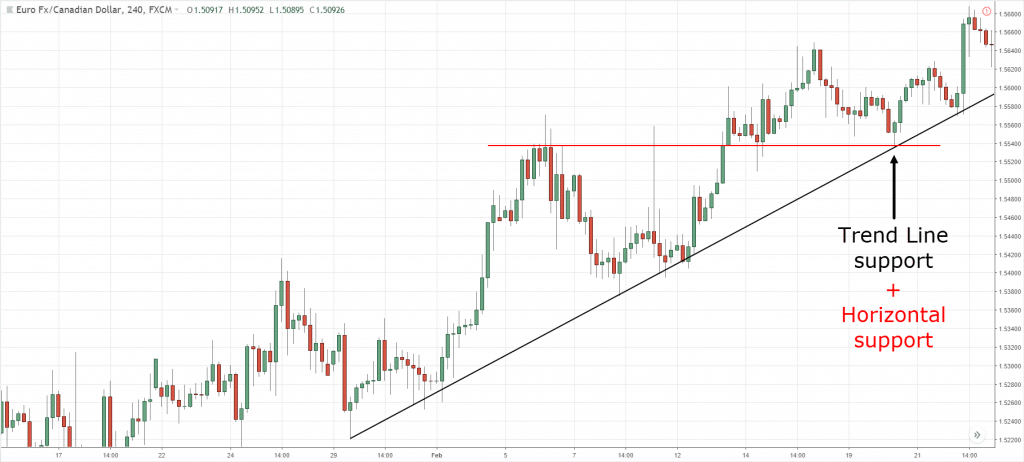
Because if you combine Trend Line with Support and Resistance, that’s where you find the best trading opportunities.
Here’s what trendline trading essentially means…
Now you might wonder:
“So when do I enter a trade?”
Well, you can use reversal candlestick patterns (like the Hammer, Bullish Engulfing, etc.) as your entry trigger.
This means you’re only entering a trade when the market has “bounced off” the Trend Line and likely to move higher.
Here’s an example:
This is powerful stuff, right?
The Trend Line Breakout Strategy
Here’s the deal:
It can be difficult to time your entries in a trending market because the pullback can be deep or shallow.
I’ll explain…
If the pullback is deep and you enter your trades too early, you have to suffer a lot of “pain”.
But if the pullback is shallow and you enter your trades too late, you risk missing the move.
So, what’s the solution?
Introducing The Trend Line Breakout technique.
Here’s how this fits into your trendline trading strategy…
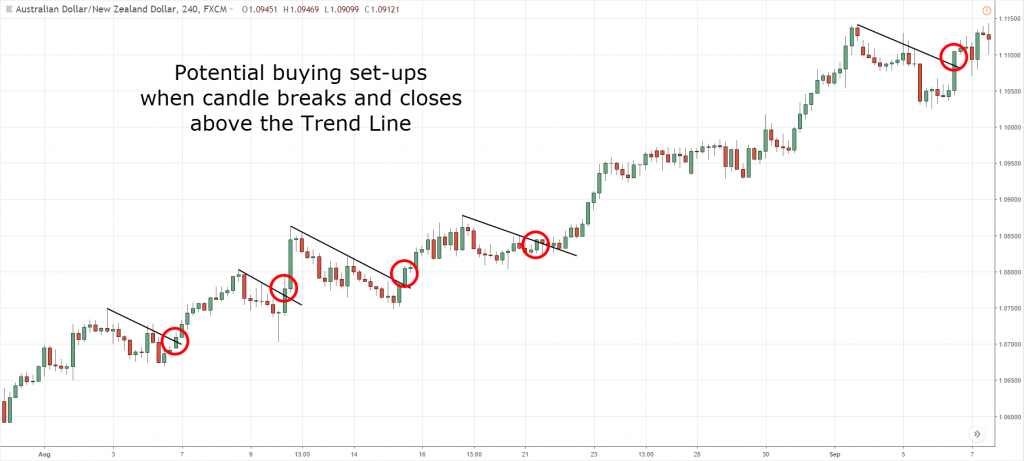
- Wait for a pullback in an uptrend
- Draw a Trend Line connecting the highs of the pullback
- If the price breaks the Trend Line, then enter the trade
Here’s an example:
Here’s the logic behind it…
If the price breaks above the Trend Line, it tells you the buyers are in control and the trend is likely to resume.
If it doesn’t, then it means the sellers are still in control and you want to stay on the sidelines till the buyers regained control.
Does it make sense?
How to ride massive trends with this simple Trend Line technique
Here’s how:
- Draw an upward Trend Line
- Trail your stop loss below the Trend Line
- Exit the trade if the price closes below the Trend Line
Here’s an example…
However…
This technique won’t work well when the trend goes parabolic because you risk giving back a lot of open profits.
You’re wondering:
“How do I know when a trend is parabolic?”
Here are 2 things to watch for…
- The trend lines get steeper (almost like a straight line)
- The range of the candles get larger
If #1 and #2 occurs, then the market is likely to be in a parabolic move.
And in such cases, you want to trail your stop loss on the current market swing and exit the trade if the price closes below it.
Here’s an example of a parabolic trend where the types of trend lines are that of increasing steepness…
Next…
Trend Line Trading: How to use Trend Line and identify trend reversal
Has this ever happen to you?
You see, the price break above the downward Trend Line and you think to yourself…
“The market is about to reverse higher because the Trend Line is broken.”
The next thing you know, the market heads lower, and the downtrend resumes itself.
Wtf, what’s going on?
Well here’s the deal:
Just because a Trend Line breaks doesn’t mean the trend is over.
Recall:
You’ve learned that a Trend Line needs regular “adjustment” as the market tends to have such a false breakdown.
So the question is…
How do you identify a trend reversal (to the upside)?
Well, here’s a 3-step technique you can use to improve your trendline trading strategy…
- Wait for the price to break above the Trend Line
- Wait for a higher low to form (this tells you the sellers have exhausted themselves)
- If the price breaks the swing high, the market is likely to reverse higher (the buyers are now in control)
Here’s an example…
Now if you want to learn more, go read this post… How to Identify Trend Reversals without any Indicators
Conclusion
So here’s what you’ve learned:
- When you draw a Trend Line: 1) Focus on the major swing points 2) Connect the major swing points 3) Adjust the Trend Line and get as many touches as possible
- The steepness of a Trend Line gives you clues about the market condition so you can adjust your trading strategy accordingly
- The Trend Line Breakout technique helps you time your entry in a trending market
- You can use a Trend Line to trail your stop loss and ride massive trends
- If a Trend Line breaks, wait for the re-test and see if it holds. If it does, the market is likely to reverse in the opposite direction.
Now over to you…
How do you use Trend Line in your trading?
Leave a comment below and share your thoughts with me.






Really really helpful! Big thanks for all this trading guide! You are superb! More power and keep those goid trading stuff coming!
Yahooooooo
You’re welcome, Liz!
it’s much better than investopedia, (thumbs up)
Thank you, John.
I appreciate it.
Thank you very muchfor your lessons through them I understand more the market l am improving my trading strategy and fill at ease. I understand candlestick formation, I watched tour lesson about support ans résistance I started to implement it , I am making some profits. I really appreciate all your lessons every ils clear and easy to understand.
Awesome to hear that, Serge!
Hey, Rayner your posts are really really helpful.
Can you post more on steepness stuff? Like when a trendlines is getting steeper or flatter what does it mean and how to use it. Please take your time and post it at your own convince . It’s a request. Thank you 🙂
I’ll look into it, cheers.
Hi Rayner, great teachings as usual. I do have a question though; I’ve noticed that all the examples you’ve shown are based on the daily charts. Is this also applicable to hourly charts also?
Hey Edward
The principles and concepts can be applied the same.
Hi Rayner,
Arithmetic or logarithmic? Which do you use or recommend?
Thanks
I use the default one on most charting platforms which I believe is log.
One of the best articles on trendlines I’ve ever came across. Keep up the good work going, Ryner!
More power to you!
Thank you, Chirag. I appreciate it!
Hello Rayner
Hey hey!
This article is worth reading. It makes trading look so easy. Thank you.
Cheers Yana
You answered all the question in my mind Sir Rayner..Thank you very much..May the god bless you more with your kindness…
You’re welcome, Kim!
This is my absolute favorite way to trade and to look at a chart.
Add in a little structure from the upper time frames and we don’t need much else on the chart.
Awesome to hear that, Ken!
Great, very useful for real trades, but can you please relate volume at the time of trendline breakout , how to relate volume ro identify false breakout about trendline?
Thanks un advance
I’ll look into it as a future topic, cheers.
I really like the way you teach it opens my eyes every time. God bless you
I’m glad to be of help!
Wonderful 🙂 thanks a lot
My pleasure!
The analysis on trendline was pretty transparent, You filter out a lot of noise in your explanation. Thank you RAGNER.
Cheers Toby!
Great Tutorial. Many thanks
My pleasure!
Rayner, power stuff that you teach. I am applying technique you had written and of cos from youtube video
Thanks a lot
You’re welcome!
Good One Sir, With a little support from the higher timeframe and candlestick confirmation we can nail the entry or exit. Thanks a ton
You’re welcome!
This is quite insightful Rayner. Can’t wait to try it out. Many thanks for the good work of helping traders worldwide. Blessings…
Cheers
thanks Raynor.am better everyday.be blessed
Awesome to hear that!
Wow that is great Thanks very much you are the best and i don’t have to pay that is the greatness
Cheers
Hi Rayner
Thanks for explaining the drawing and trading using trend lines in such lucid manner.
Subject to your approval, if i may add that to further refine the outcome once the trend lines are drawn we may apply line chart to check the number of touches within the trendline. This will further validate our thought process.
Thanks buddy once again.
Thank you for sharing, GPS.
Your all the articles are very informative I read all the lessions you experienced and then share to very nice sir….thanks
You’re welcome!
Have been using trendlines myself, for years. I find that there are very few people who use it. Thank you for the additional insight!
You’re welcome, LIla!
hi rayner u explain clearly i understand
one more douth when go to live market i am confusing to draw trend line give solution
thanks a lot
Cheers
thank you
My pleasure!
Its really amazing to read your article, its really helps me a lot. Thank you Mr. Rayner
You’re welcome, Adrian!
Hi
Very good information
Amazing rayner i learned alot from you really thankyou so much keep posting this type amazing topics really helpfull for traders
I’m glad to help, cheers
Working with you is not it just need time and willingness
very smart, the idea of the fact that you are using the breakout to enter for the higher time frame, I love it
Cheers
I must tell you, you have been a great inspiration to me and I can only say a very big thanks.
My pleasure!
Thank you You’re Superb, this is very helpful
Glad to hear that!
Hi Rayner
Your explanation are very useful
Thanks a lot
My pleasure!
Hi.. Very well explained sir.. It will help to edge a Trader’s skill..
Sir can you post this kind of knowledge on Neo Wave..
Hello Reyner – I have been following for last 2 months now. The above knowledge about trendlines is really good. However, the mistake I have done is that if a support or resistance is tested thrice, I feel that the respective support or resistance is getting weak and there is a chance of breakout. Is this correct?
My take is that the more test a level is tested within a short period of time, the greater the likelihood it’ll break.
Very nice
cheers
Guide me about day trading and tell me which time frame is better to entry specially tell me about crudeoil
Nice one Ryner. Very simple to understand..
Cheers
Thank you so much. This helped me so much
Cheers
Very useful.Thanks Rayner
You’re welcome!
Awesome concept This is a life changing guidance
My pleasure!
Thanks alot, really really helpful. Looking for more.
Cheers
It is very useful to trade by using trend line , thanks….
My pleasure!
Your writings on price action are excellent. I wish I had come a across your articles long back. Just wanted to know, your trend line examples are based on 1day chart.Is trend lines based on 15 minutes time frame work out well?
Hi Nitin,
You are welcome!
On a lower timeframe, it would be a very short term.
Cheers.
I want to learn trandline strategy
Very very simple and informative
Cheers
thanks for all this trading guide
My pleasure!
Hey Rayner, drawing a trendline is easy in off-market.
I appreciate it if you make videos on trendline breakout or pullback strategy in live market.
Check this out… https://www.youtube.com/watch?v=hLRLtY6BzeU
This blog’s first picture is not an exaggeration…! I just got hang of it after reading this blog !!! hmmmm!!!
Very good teaching
Glad to help!
Hey Super R,
I’m new here… just old. Hope you and your team are well. Look, I’m trying to decide on which mentor to go with. The guy that teaches the simple 3/4bar rules..(Jared Wesley ). Or Vector Vest . I get too frustrated with straight investing and want to learn about trading in simple terms . Trends make sense. I don’t mind sitting in front of a computer 3/4 hours . But I want to keep it simple . I will be using a portion of my 401K $$ … let’s say (100K). I’ve only bought and sold stock over the years on “best guess”, I have put in stop losses but not more than that. So, Jared, Vector Vest, or yourself? Can you help me decide?
Sir, Massive learning experience.It definitely change the way I look for swing / positional trading opportunities.Concept is good. But please let me know it works well on DAILY or WEEKLY chart ?.
Hey Ramesh,
Yes, it does.
Short and sweet easy to follow. Thanks.
Hey Dennis,
You are most welcome!
Since I have started to watch your videos on YouTube and reading your books and I seen good improvement when I trade, thanks for being a good help we appreciate your good work.
Hey Wonder,
Thank you!
Although I’m still trying to understand and keep somethings you’ve taught in mind, but I must confess that your preciseness in keen and helpful. Thanks Rayner.
Hey Ebimobo,
Keep it going!
Cheers.
Really big thanks understood very well thank you teo
Hi Munna,
You are most welcome!
Hi, Thanks for the info, can you help me can I add 20-day moving average in 60 mins chart along with trendline for a swing trade.
Hi Mithlesh,
You can but you need to identify the trend from a higher timeframe so you don’t trade blindly.
Check this post out…
https://www.tradingwithrayner.com/200-day-moving-average/
Excellent Tutorial easy to follow and exciting to learn, I will put into practice what I have learned.
Thank you.
Hi Justin,
I’m so glad to hear that!
Cheers…
Do all these techniques apply to shorter time frame like 2-4 hours?
Hi Kim.
Yes, it does.
Check out this post.
https://www.tradingwithrayner.com/course/how-to-use-multiple-timeframes-and-improve-your-trading-entries/
can you please share on volume?
Thanks a lot Rayner I’ve been following you and I’ve came to a point where my trading have now improved,I can say you the king of everything when comes to trading,you actually know most of things in trading.Thanks a lot for your help.Ive learned a lot when it comes to price action.
Hi Sanele,
I’m glad to hear that!
Cheers.
Awesome explanation and ready to eat it.as always thanks a lot.god bless you
Hi Guruprasad,
You are most welcome!
Cheers.
Hey brother this is the BEST and most concise explanation on trend lines and entry points. So many people make it confusing. Thank YOU!
Hi Brendan,
Thank you!
Cheers.
I learned a lot from you sir thanks God bless you sir.
Hi John,
You are welcome!
Cheers.
Thank you brother
Hi Prasanth,
You are most welcome.
Cheers.
U ar great sir…I hv learned a lot from you and believe I m still going to get a lot from yr lessons
You are welcome, Siane!
Thanks Rayner, you just made trading easier. The various resource in your platform are wonderful and easy to understand. God bless you and more wisdom for this great exploit.
You are welcome, Philip!
Very very informative, but what are the general time frames these entry and exit evaluation’s based on? This is very excited to learn
No facebook or twitter please
This is Tremendously Great! Power Knowledge dropped here. I before now, never knew somethings until you explained it. So I’ve added greatly to my Trend Line knowledge. Massive Thanks.
Glad to hear that, Paschal!
This was so helpful once again Thank you so much
All I can say is God bless you for Sharing your knowledge FOC
You are most welcome, Perpetual!
[…] Support & Resistance can also be in the form of Trendline or Trend […]
I love your content and the way you teach I’m having a lil problem with understanding the way you’re using the trend line in adjusting it can you help me
Like on the example you used you have a horizontal support Lin with the trend line but the beginning of that line was once a resistance first how does this give you break out action off of which line
Thank you Rayner for your post. Please what time frame do you use to read charts on trading view in order to identify a pattern.
Hey Frances,
Rayner use the 4H/Daily/Weekly
Cheers.
thank you very much bro
this helps me alot
Time to entry and exit. Real powerful staff. Should had learn it earlier. At least I gain more knowledge on this strategy. Great Guru Mr. Rayner. Hopes to learn more from you.
Awesome, JC!
Thanks I love it its highly educative I look for ways to applied it thanks
Thank you, Dayo!
Affirmative ..I always admire you way of teaching..you make it easy ..I have learned a lot from your article..
I’m glad to hear that, Ifenna!
Beautiful piece and I’ll love to learn more
It is an excellent technique.
Glad to hear that, Ashok!
[…] can use tools like Support and Resistance, Moving Average, Trend line, […]
It is really helpful to me. Thank you so much for getting the learning points from it. I really appreciate all your topics and videos that make me easy to understand well.
Glad to hear that, Thandar!
You’re the best, thanks for the simple and easy to understand explainations!
You are most welcome, Lisi!
Thanks trend lines have helped me alot and now my profits have increased in just one week Really Reiner is blessing to me.
Thank you, Ahimbisibwe!
We’re glad you find it useful!
Cheers!
Thank you for sharing wisdom nuggets
You are most welcome, Jasmin!
I can use this to become a better trader
happy to help, Sven!
Nice concept on trend line. When the price breaks the trend line, the role reversal of trend line takes place. Is it not so? The retracement of the break-away price back to the trend line reverses the role of the trend line. For example, a trend line working as a support, becomes resistance to the break-away price retracement. If the retracement is between 0.5 and 0.6 of Fib number, the upward rise or downward fall of the price will be very strong and steep. In this context, I would like to know whether there is a screener or scanner to identify such upward/ downward moves of stocks on a daily basis. Please share your expert comments. Thanks in advance Rayner.
Wonderful .big thanks
It’s our pleasure, AN!
Sir, Thanks a lot for share such a deep knowledge.
You’re very much welcome!
This awesome, and nice technique, thanks so much you are the teacher…
You’re welcome, Kenneth!
This is just
Great knowledge Rayner, thank you for your kindness explanation.
You’re most welcome, Ahmad!
This is so helpfull
Glad to know you find our materials useful, IDDY!
Thank you leaned something today.
Glad to hear that, Mohammad!
Great explanation , Rayner when you start a trend line ( lets say uptrend) where is the point of start ? Is it from the lowest low or is the first support from the breakout ? Thank you for the lesson
Hi Doru!
Rayner draws a trend line by connecting at least 2 major swing points.
For more info, here is a link on how to draw a trend line:
https://www.youtube.com/watch?v=BONTuuxhujk
Hope that helps! Cheers!
Hello Mr Rayner, I’ve been following your tutorial on youtube and I find your explanations very helpful. I’m a beginner in Fx World and I’m working towards becoming a Pro of my own. Thanks for your support, continue providing us with more tutorials. God Bless you.
Hey there, Rombo!
Jarin here from TradingwithRayner Support Team.
Thank you for your kind words. If you are new to trading, you might wanna check our Academy. This will help you big time in your trading career.
Here is the link:
https://www.tradingwithrayner.com/academy/
Cheers!
The results is clear big boss , the analysis is working.
That’s a piece of good news, John!
I wish you all the best!
Ray Er congratulations you seem very appreciated and followed, in the video mentioned you talk about media 50 and micro trend line, can this method work with a 15 Min timeframe? finally, is it correct to merge only the decreasing shadows that are found (for example, above the average 50) to enter the pull back and restart? ditto if you go down with candles below the average .. always looking for a break of the micro trend line
Power if trendlines,explained so well
Thank you, Sabarish!
You are the best
Thank you!
Please boss. I want to make it in this forex
Hey there!
If you are a beginner in trading, I highly recommend you go through Rayner’s free course in his Academy. This will also help you big time to understand the basic in forex.
Here is the link:
https://www.tradingwithrayner.com/academy/
Cheers!
thumps up Rayner. this one is soo powerful
Thanks, Ciuga!
Rayner, after the break of a downward trendline, do we use lower timeframe for swing high to be made or we use higher tf?
This was really helpful. Thank you so much
Hi, Phronesis!
We’re glad to know it help you. We wish you the best!
Cheers!
Draw an upward Trend Line? FYI – You have a downward trendline NOT an upward trendline in your example. I’m surprised no one noticed.
Sir Sometimes trendline breaks and after some time it retest but after retest there is one Candle shows us volume with larger candle but next candle is return to hit stop loss why is it happen..and may i know that on which time frame we can take retest entry..
Veary beutiful
Thanks, Rajinder!
One of the best and simple explanation.great rayner
Thanks, Aravindhan!
Wonderful
Thanks, Subrata!
Great work my leader, well articulated.
Glad you like it, Desmond!