The 200 day moving average (MA) is one of the most followed indicators.
Just tune in to financial news and you’ll hear stuff like…
“The S&P has broken below the 200 day moving average — it’s a bear market!”
“You should buy when the price cross above the 200 day moving average.”
“Apple just closed below the 200MA — time to sell.”
But here’s the thing:
How does it help you as a trader?
It doesn’t.
Instead, it toys on your emotion and causes you to buy/sell at the wrong time.
But don’t worry, we’re going to change all that.
Because in today’s post, you’ll discover…
- What is the 200 day moving average and how does it work
- How to use the 200MA and increase your winning rate
- How to better time your entries when trading with the 200MA
- How to ride massive trends without getting stopped out on the retracement
- How to identify the correct market cycle so you don’t get caught on the wrong side of the move
Sounds good?
Let’s get started now….
What is the 200 day moving average and how does it work?
The Moving Average (MA) is a trading indicator that averages the price data, and it appears as a line on your chart.
Here’s how it works…
Let’s assume over the last 5 days, Apple shares closed at 100, 90, 95, 105, and 100.
So, the 5-period MA is [100 + 90 + 95+ 105 +100] / 5 = 98
And when you “string” together these 5-period MA values together, you get a smooth line on your chart.
Now the concept is the same for the 200 day moving average.
The only difference is you look at the last 200 days of price data which gives you a longer-term moving average.
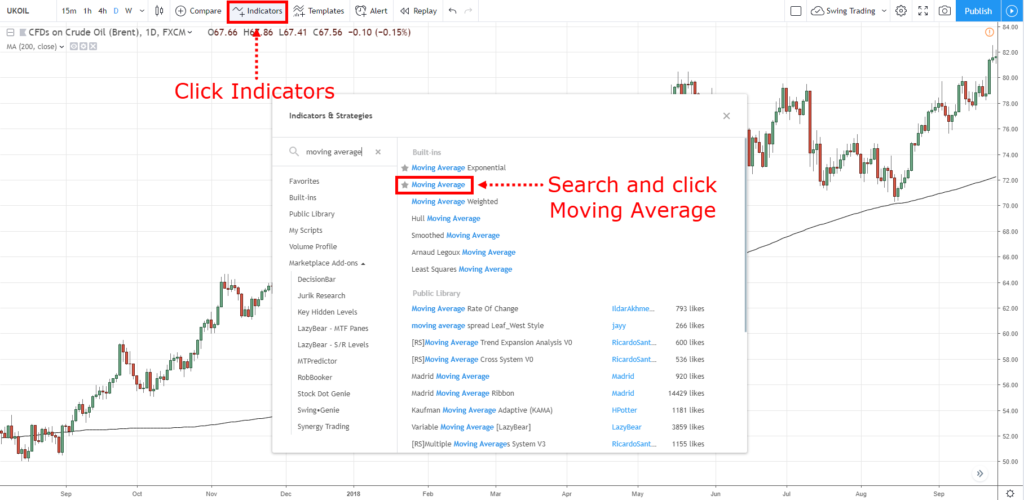
Here’s how to plot 200 day moving average (on TradingView):
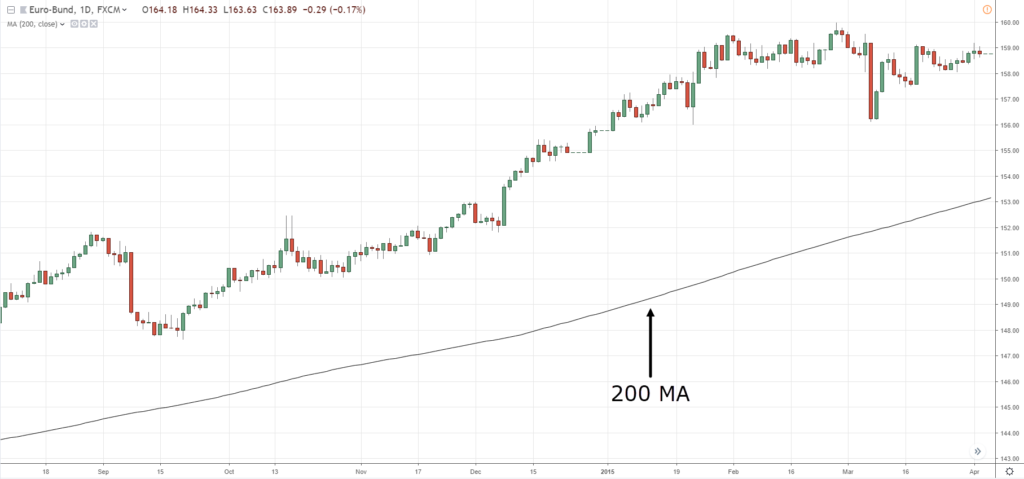
And here’s how it looks like: A 200 day moving average chart
Now, there are different types of moving average like exponential, simple, weighted, etc.
But you don’t have to worry about it because the concept is the same (only the way it’s calculated is slightly different).
Let’s move on…
How to use the 200 day moving average and increase your winning rate
Here’s the thing:
The 200 day moving average is a long-term indicator.
This means you can use it to identify and trade with the long-term trend.
Here’s how…
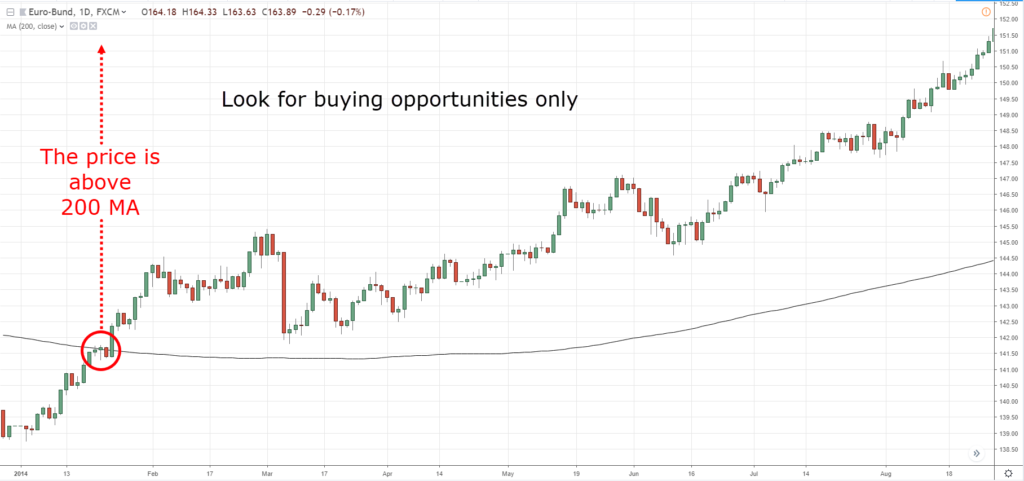
If the price is above the 200 day moving average indicator, then look for buying opportunities.
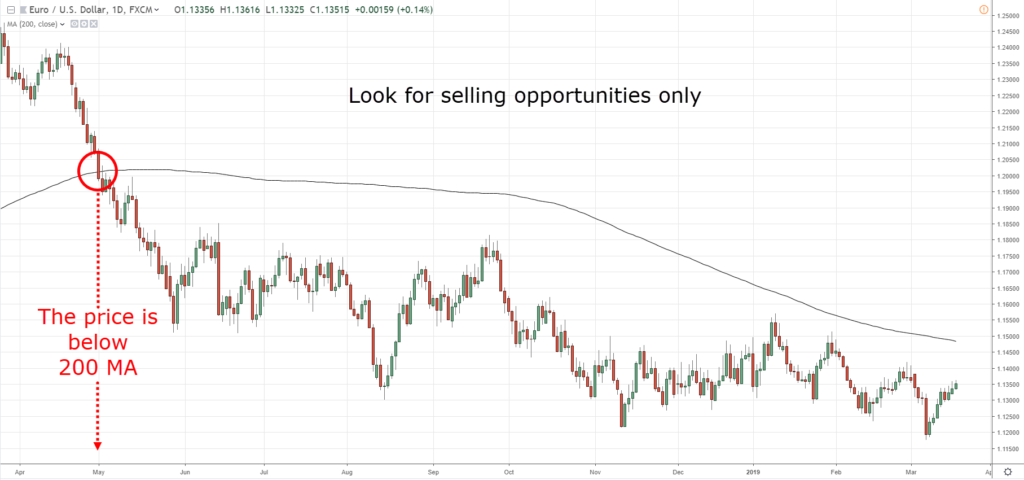
If the price is below the 200 day moving average indicator, then look for selling opportunities.
An example:
Pro Tip:
If you’re trading stocks, you can refer to the index to get your trend bias.
So if the S&P 500 is above the 200 day moving average, then look for buying opportunities on US stocks.
This simple 200 EMA strategy will increase your winning rate and reduce your drawdown.
How to better time your entries when trading with the 200-day moving average indicator
You’re probably thinking:
“Okay it’s not difficult to identify the trend with the 200 moving average. But when is the right time to enter a trade?”
Here are a few techniques you can use…
- Support and Resistance
- 200MA bounce
- Ascending triangle
- Bull Flag
I’ll explain…
1. Support and Resistance
Support — an area on your chart where potential buying pressure could step in.
Resistance — an area on your chart where potential selling pressure could step in.
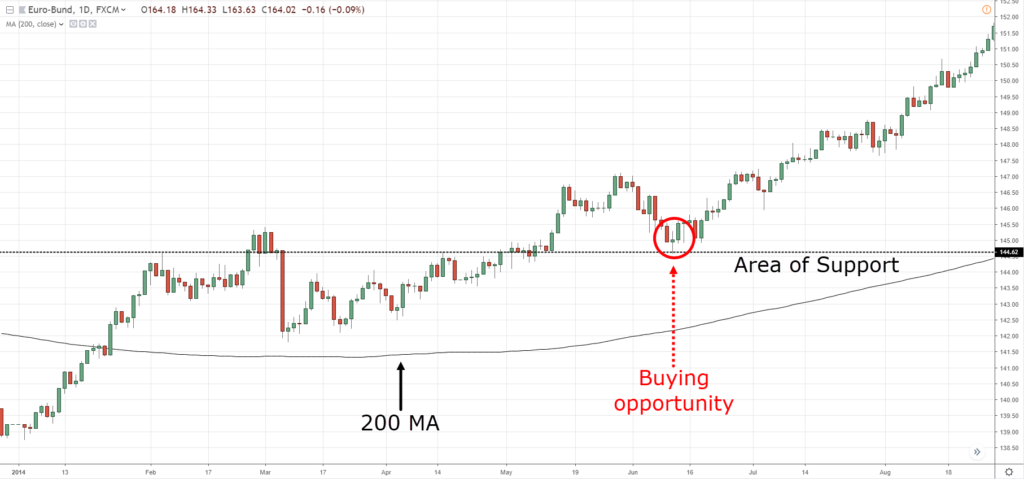
So, if the price is above the 200 day moving average, you can look for buying opportunities at Support.
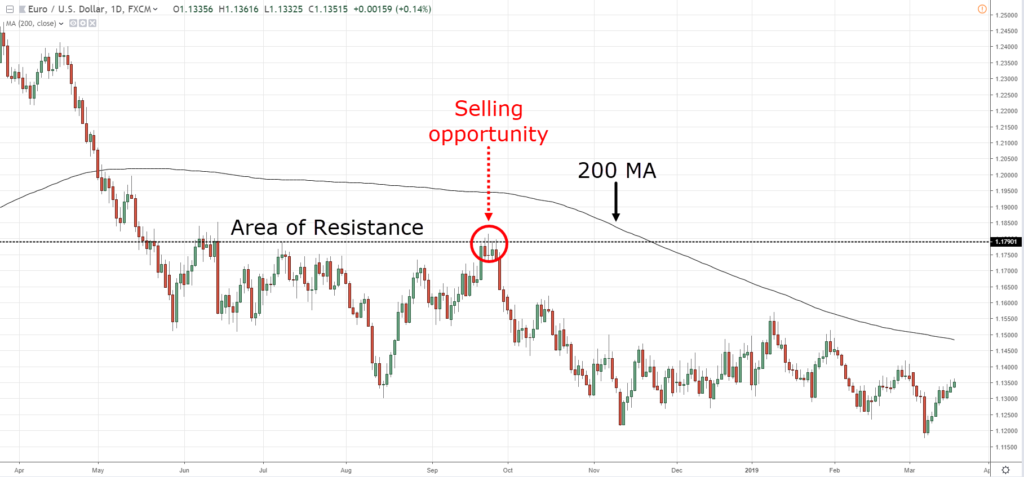
Or if the price is below it, you can look for selling opportunities at Resistance.
Here’s what I mean…
2. 200MA Bounce
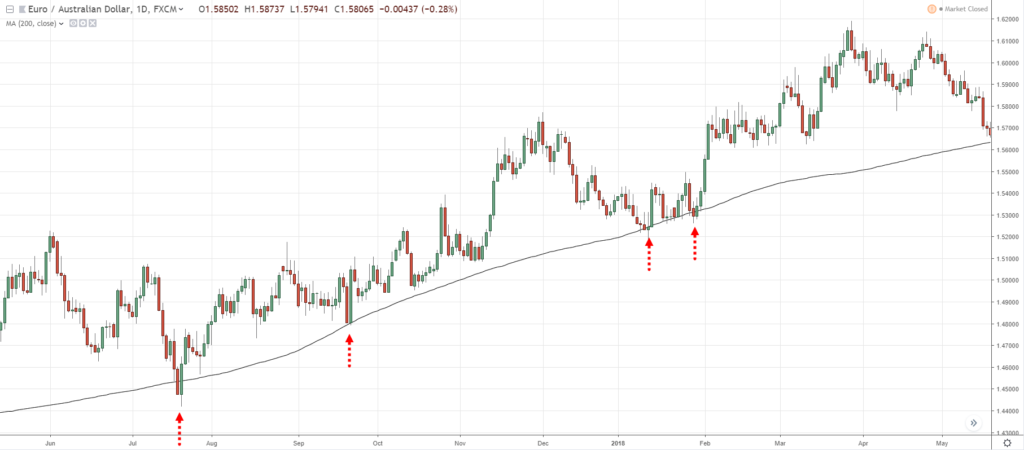
In a weak trend, the 200 day moving average can act as an area of value.
You’ll notice the price approach the 200MA and then “bounce” away — and this presents an opportunity to enter the markets.
Here’s an example:
Pro Tip:
You get higher probability trades when the 200MA also coincides with nearby Support/Resistance.
3. Ascending Triangle and Descending Triangle
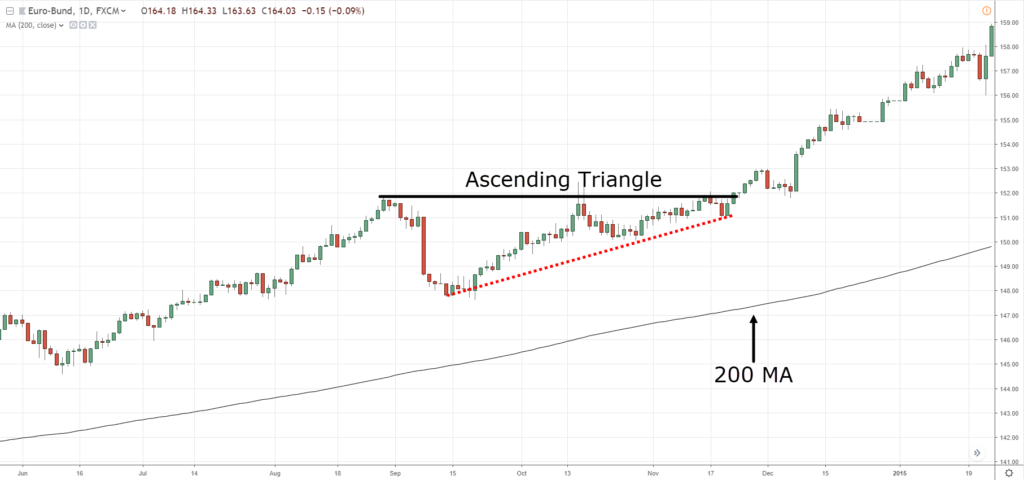
The Ascending Triangle is a bullish chart pattern.
It’s a sign of strength as the buyers are willing to buy at higher prices (despite coming into Resistance).
So in an uptrend (the price above 200MA), you can look for an Ascending Triangle and buy the breakout.
And in a downtrend, look for a Descending Triangle and short the breakdown.
An example:
Pro Tip:
The longer the Ascending Triangle takes to form above the 200 moving average, the stronger the breakout.
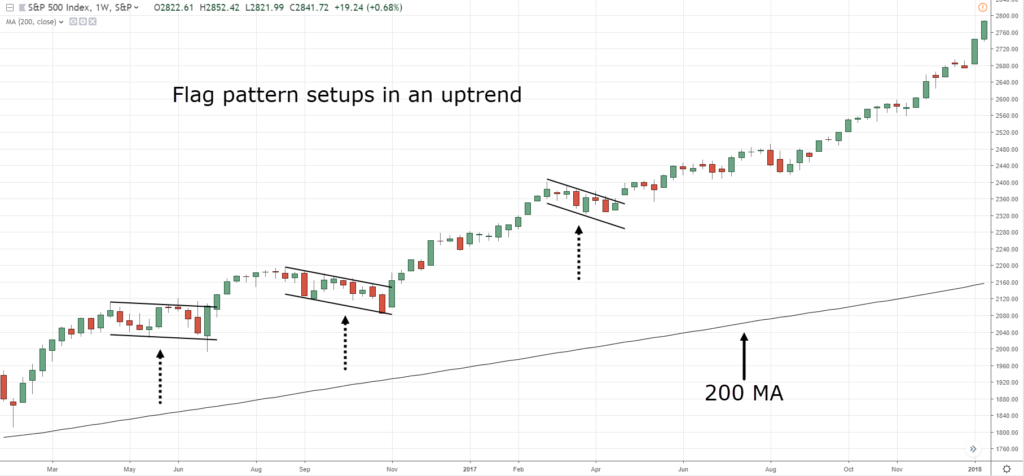
4. Bull Flag
The Bull Flag is another bullish chart pattern.
It’s a sign of strength as the buyers are in control and the sellers have difficulty pushing the price lower (that’s why you have small bodied candles on the pullback).
So in an uptrend, you can look for a Bull Flag pattern and buy the break of the highs.
And in a downtrend, look for a Bear Flag pattern and short the break of the lows.
Here’s what I mean…
This simple 200 moving average strategy makes your trading more objective as you’ll always know which side of the market you are in and where to enter with the flag patterns.
Sounds good, right?
Pro Tip:
The best flag pattern to trade is when the price just broke out of a range (usually the first pullback).
200-day moving average: How to ride massive trends without getting stopped out on the retracement
Here’s a fact:
If you want to ride massive trends in the market (the kind that gets other traders drooling), then you must give your trade room to “breath”.
Having a tight trailing stop loss won’t cut it.
Instead, you must give it a buffer.
And one way is to trail your stop loss with the 200-day moving average.
This means if you’re long, then you’ll only exit the trade when the price closes below the 200MA.
Or if you’re short, then exit the trade only when the price closes above the 200MA.
Here’s what I mean…
Pro Tip:
If you want to ride short-term trends, you can trail with the 20MA.
If you want to ride medium-term trends, you can trail with the 50MA.
How to identify the correct market cycle so you don’t get caught on the wrong side of the move
Here’s a fact:
The market is always changing.
It moves from a range to trend, trend to range, and etc.
You can break it down into 4 stages:
- Accumulation
- Advancing
- Distribution
- Declining
I’ll explain…
(This is important so please study it)
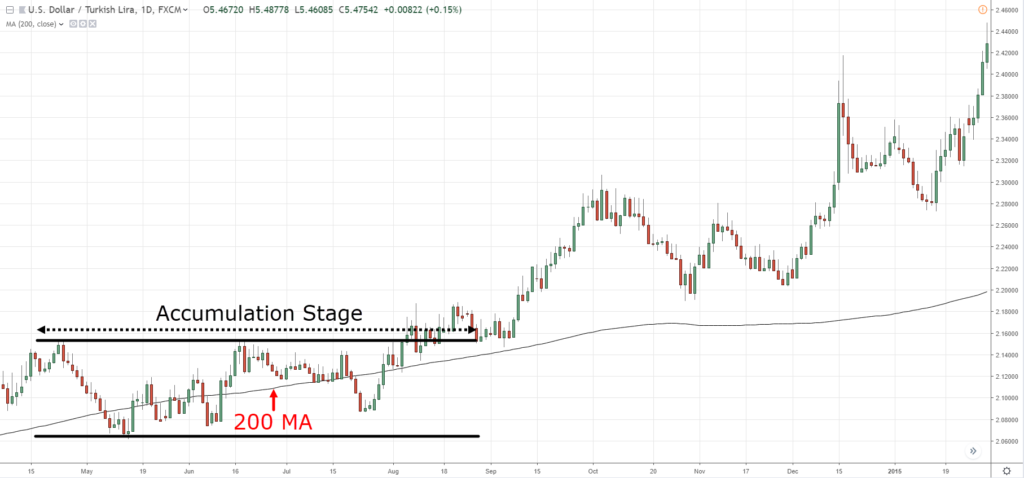
1. Accumulation stage
The accumulation stage occurs after a downtrend.
It looks like a range market with obvious Support & Resistance.
You’ll see the 200MA flatten and the price might “whipsaw” around it.
This tells you the buyer and sellers are in equilibrium and the market is undecided.
Here’s an example:
So, what this means is that if the market is undecided…
A 200-day moving average strategy wouldn’t work during this stage.
Now…
In an accumulation stage, the market could break out in either direction.
If it breaks down lower, the downtrend continues (and you can look for shorting opportunities).
But if it breaks higher, then it’s the start of an uptrend which brings us to the next stage…
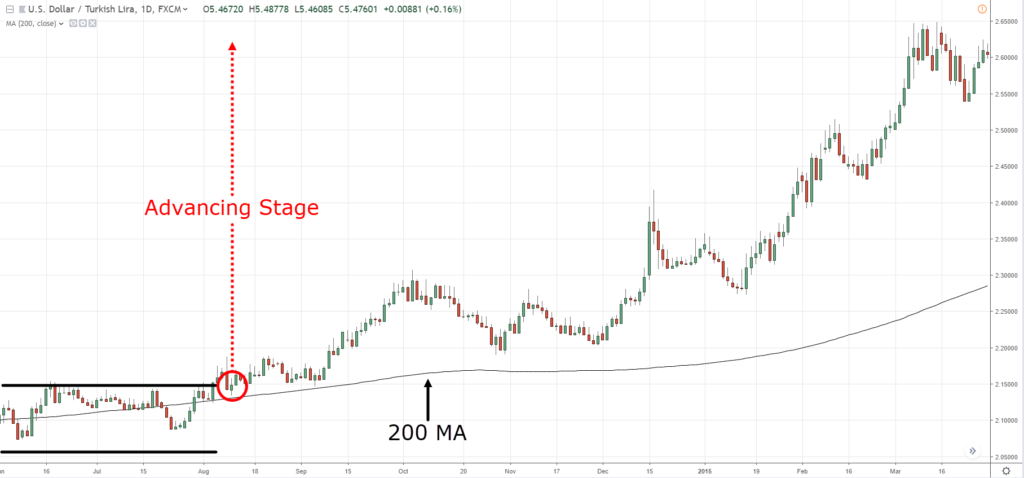
2. Advancing stage
The advancing stage occurs when the price breaks out higher of the accumulation stage.
It looks like an uptrend with higher highs and lows.
At this point, you’ll see the price above the 200MA and the 200MA starts to point higher.
Here’s an example:
Now…
In the advancing stage, the path of least resistance is towards the upside, so you want to be a buyer (not a seller).
There are a few ways you can trade the advancing stage…
- Buy the first pullback of the accumulation stage
- Wait for a pullback towards previous Resistance turned Support
- Look for a pullback towards the Moving Average
If you want to learn more, check out The Trend Trading Strategy Guide.
Next…
3. Distribution stage
Here’s the thing:
Markets don’t go up forever.
Eventually, sellers would come in to push the price lower.
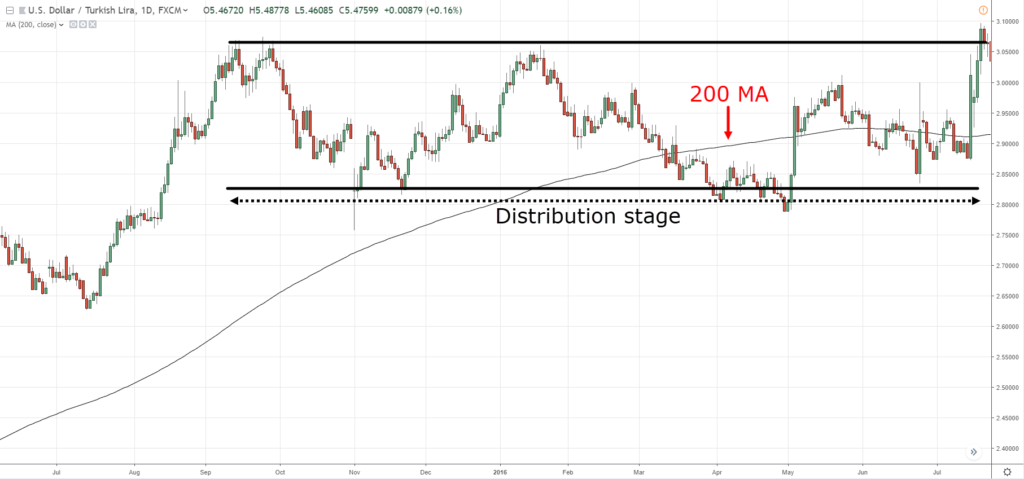
And the first sign of weakness is in a distribution stage.
It looks like a range market in an uptrend and you’ll see the 200MA flatten and the price might “whipsaw” around it.
This tells you the buyer and sellers are in equilibrium and the market is undecided.
Here’s an example:
Now…
In a distribution stage, the market could break out in either direction.
If it breaks out higher, the uptrend continues (and you can continue to look for buying opportunities).
But if it breaks lower, then it’s the start of a downtrend which brings us to the next stage…
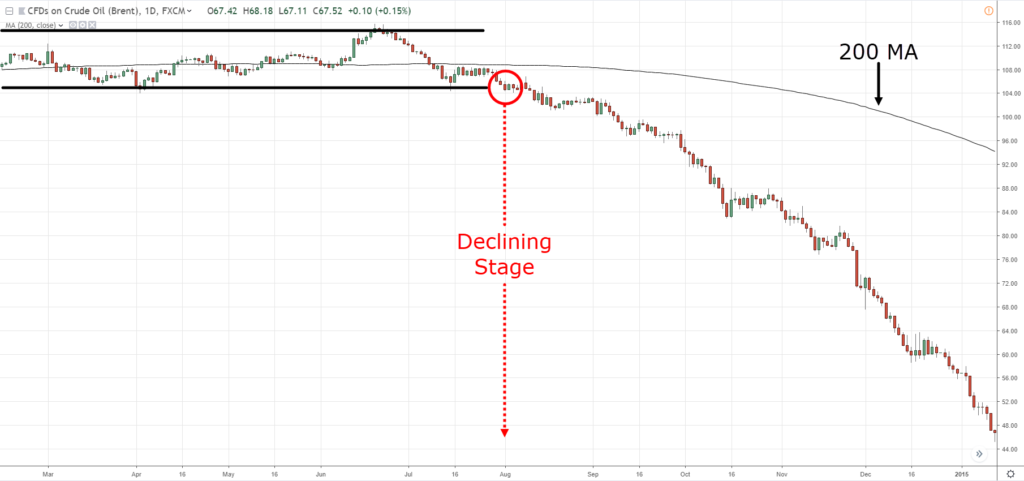
4. Declining stage
This is the final stage of the market cycle.
The declining stage occurs when the price breaks down of the distribution stage.
It looks like a downtrend with lower highs and lows.
At this point, you’ll see the price below the 200MA and the 200MA starts to point lower.
Here’s an example:
Now…
In a declining stage, the path of least resistance is towards the downside, so you want to be a seller (not a buyer).
Likewise:
A declining stage doesn’t go on forever.
It’ll come to a point where the price is low enough to attract buyers.
And that’s where the market transit back to stage 1 — the accumulation stage.
One last thing…
The 4 stages of the market is more art than science.
Sometimes it’s not clear which stage the market is in no matter what kind of 200 EMA strategy you use.
When that happens, your best bet is to move on to another market which makes more sense.
Conclusion
Here’s what you’ve learned today:
- The 200 day Moving Average (MA) is a long-term trend following indicator
- You can use the 200MA as a trend filter. Look for buying opportunities when the price is above it and selling opportunities when the price is below it
- You can time your entries by trading at Support and Resistance, Moving Average, or chart patterns
- You can trail your stop loss with 200MA and ride massive trends
- The 200MA helps you identify the 4 stages of the market so you can better time your entries and exits
Now here’s what I’d like to know…
How do you use the 200 day moving average in your trading?
Have you used a 200 moving average strategy before?
How did it go?
Leave a comment below and share your thoughts with me.



You shall be my mentor. Your teachings made it so easy to follow.
Thank you Rayner.
Cheers Sam
Thanks for showing me the light on the 200 day moveing average i learn so much
My pleasure!
I brought your book on price action it’s wonderful
Glad that you like it, Ayub!
moving 200ema can used H4 time frame or not sir
Hi Kimsary,
Yes, you can use it on the H4.
very useful guide.
Thank you!
I need this in PDF please Ray
I don’t have it.
Whenever are not present options to download a web page/document as a pdf file, and these are most of the cases, in one of the popular web browsers, if you use e.g. Google Chrome, Brave, Mozilla Firefox (I don’t know if Apple Safari has this option, although I would expect it), click on ‘Share’ -> ‘Print’->’As Pdf’, then you are presented a dialog window to save (download) the PDF file resulting from the output of the web page you are looking at. Once downloaded, check in the location/folder used for downloads (that can be also modified).
Do you use volume indicator in any of your trading systems. If yes, kindly share and explain how to use it. Thanks.
I don’t.
Hey hey what’s up my friend.
Nice one Rayner.
Kindly look at number 4 – declining stage; I believe you meant the 200MA should be pointing lower and price below it.
Cheers man!
Thank you for point out, Rex.
Fixed!
very useful,i never use 200ma.
as im still learning u will be my personal mentor somewhere this year.
I don’t offer personal mentoring.
Your style of teaching is with a difference – down to earth. I will want you to mentor me in becoming a successful trader.
I don’t offer mentoring, cheers.
I Use Moving Average For Taking Profit & Stop Losses
Thnx For This Major Guide I Really Enjoyed It ❤❤
Awesome to hear that!
Very useful Rayner, you restored hope on trading. Big Thanks
Cheers Jenny!
You are very genuine, and the best by far! Keep it up and you will surely have many million followers pretty soon. Thanks a lot for breaking down apparent complex problems/challenges to simple understandable steps!
I appreciate your kind words, Ozoma!
Very many thanks sir i am just the learner investing takes time for me as begginer.. Awesome you as mentor thanks
Cheers bud
Thanks , it’s one of your best
Thank you and you’re welcome!
Very easy to understand. Thank you reyner
My pleasure!
you make things so simple and easy to understand, you are an expert
Cheers Rajen
What you mentioned is for a Daily Trade pattern for Long term. If I trade on M15 or H1, should I just look at 20MA or 50MA? Thanks!
There’s no best MA to look at irrespective of the timeframe.
It depends on your goals and what you want to use the indicator for.
A 200MA on the 1-hour timeframe is simply an 8MA on the daily timeframe (200 / 24).
Except your wrong about it translating to an 8hr on 2 respects. First, 200/24 does not equal 8. Also all the charts on Webull show 7 candle wicks per day on the 1-hr chart (if you don’t show extended hours [if you show extended hours it will change depending at which stock you look at, cause not every stock has the same extended hours]). So unless Webull is broken or does charts different than every other brokerage platform, **your 200MA on the 1-hour timeframe is simply 28.57MA on the daily timeframe.**
But even then if you switch between the two timeframes you’ll get different averages cause most MAs use the closing costs on each candle wick as their input data. So each daily candle on the daily chart has a closing cost that isn’t equal to the average of the 7hr closing candles within that given trading day.
thks
cheers
Hi Rayner. I’m a newby still doing Demo Account. I have really been struggling, until I am across your site. I religiously studied all your material. Then started Demoing again, what a difference. I’ll demo for two more months, then go live on a small account. Living in South Africa the end of day New York charts is midnight for us. I get up every morning at 05 00 and do my trading. Any other suggestions. ta James
1. You can sleep a little after midnight after new york close.
2. Trade other markets which have a more favorable timezone.
3. Trade other timeframes besides the Daily.
I have been following yoy for quite some time now. Your teachings are quite spectacular. Thanks Rayner you taught me a lot.
I’m happy to help!
Really enjoy learning about trading from you. Looking forward to seeing more from you, Mr.Rayner.
Cheers Adez!
Super I m learning more from you thank you.
Cheers Teja
I AM PROFITABLE RIDE ON YOU
if u use the 200ma on the dax german30 it was well under the 200 ma before x mas so i shorted but it did the opposite it went up from jan till now making 200ma not very usefull have a look at chart
There’s no guarantee in trading because if there is, it won’t be called trading.
Thank you Rayner. I will try it out for a while and journal my progress and take it from there.
Awesome, keep me updated!
i would like to know how to set a stop loss and take profit once you enter a trade at support/resistance level with price above or below 200MA and what time frame is suitable for this strategy also is a 200 SMA or 200 EMA
You can check out this post on stop loss… https://www.tradingwithrayner.com/stop-loss-order/
There’s no best timeframe because it doesn’t exist.
I used 200EMA but again it doesn’t matter, the concept is what matters.
Rayner, your explanations are great, but you didn’t give an explanation on how to exit for intraday traders. Some of us have equity that only allows for intraday trading, I find that when/if I enter a trend using all you’ve explained, I don’t know how to exit or when to exit within the same day. This has been my challenge. How do I set take profit targets as an intraday trader?
These post will help with your exits…
https://www.tradingwithrayner.com/set-stoploss/
https://www.tradingwithrayner.com/2-how-to-know-when-is-the-best-time-to-exit-your-trades/
Hello Ryner,
I use the 200 Day EMA as a trend indicator, whether i should basically buy or sell. Even in smaller time units, i allways pay attention to the 200 day Ema to identify the main trend. So i can see in smaler units of time well pullbacks and enter the short term.
Thanks for sharing!
Nice explanation God bless you
Please how do I trail with the 200MA, Do I have to measure from current price to the 200MA and trail with the points in the measurement?
You can hold your trade as long as the price didn’t close beyond the 200MA.
Hi, coach Rayner (yes, I’m claiming you as my coach LOL). Thanks for the information you are sharing on your blog and your YouTube channel. I am really learning a lot from them. You are the real deal! Keep it up!
Glad to help, Josh!
My man you really know your stuff, as a newbie this has been an eye opener for me…as someone who just started out, having you on my corner its gonna be fast learning trip
Cheers
Eraa of value
This is very simple and easy to follow… I love the way you teach. Stay blessed Rayner… I am your fan…
I appreciate it, Char!
Can 200MA be used in the 1hr chart/ for short term trades? If no, which moving average is best for scalpers?…
Thank you Rayner for existing. Cant praise you enough for all the knowledge and tips you are sharing with us!
Glad to be of help!, Rafi!
I never use 200Am,but with this lesson I will try it today
Awesome, let me know how it works out for you.
I am so grateful for your advise and teachings. I have been off and on trading but I decided to full stick to it and I feel lucky to come across this website. Thank you so much.
cheers
hello Rayner, it needs to be in same trend of 200 EMA for h4 and d1 time frame, if i want to make entry on h4 time frame?
There are no hard and fixed rules here.
The 200MA serve as a guide to what the long-term trend is doing (on the timeframe you’re trading on).
If you enter on H4, it pays if it’s aligned with the Daily timeframe too.
THANKS SO MUCH BRO.
I can never stop re-reading this stuff here 1year since I started following you and it doesnt get better….cheers from Uganda…
Cheers bud
Thank you
My pleasure!
Your technings was super and good warking also easy to read.
Glad to hear that!
Can we use the 200ma for one hour timeframe
Very useful thing my dear friend
Great guide.i find out very informative.thats why many had envy you and even discredit in some of the review online and saying that you are a joke and scam. thank you Rayner for sharing your knowledge to many novice trader like me. Your unconditional sharing helps us a lot and made our trading better than before.
Glad to help out, Bert!
can we use 200EMA strategy on “30mins”time frame for Intraday trading i.e. for day trading?
Hey Rayner,
I tried 200EMA strategy on “30mins”time frame for Intraday trading
(day trading) but I observed If you miss correct entry time then It nothing worthful. How to fix it?
On my mt4,I go to settings,click on the(f)sign,scroll through and select MA. On the MA,I adjust the period to 200 and finally click OK.
Now when price is above it,its a signal to look for long buying positions, but when price is below it,its a signal to look for a selling positions. I can choose to go long or short in either case .
Learning a lot
Awesome!
Wow Rayner fantastic ,I love more ur teaching intelligent, thank u Rayner, Rayner is our future Rain money in our account confirm .
Good trading idias so very much thanks.
My pleasure!
Thank you for this lesson..
Your lessons have been so much inspiring and helping…I cant wait to get on with your Pro package…Much love from Nigeria
Cheers Daniel
Any time frame analyasis for trade in 200 ma
All your teachings makes sense to me thanks Mr rayner
I’m glad to hear that, Peter.
Thank you Rayner. Am still learning. This was very worthwile
Hi Roelien,
You are most welcome!
Simple and Superb explanation of MA..
I’m glad to hear that, Shreenivas.
Thank you Rayner. Your No BS advice has helped me so much. I’m new to trading at 64 years old, but reading your articles has given my confidence a great boost. Thank you again. Tom in Dublin
Hi Tom,
You are most welcome!
Three reasons why I wasn’t successful in trading.
1. I didn’t listen to you!
2. I didn’t listen to you!
3. I didn’t listen to you!
Hmmmmmm……
Rayner, you are truly a blessing to all traders that are beginning and Confused!!! God Bless! I finally have a light at the end of the long dark tunnel I’ve been blindly crawling through.
Warmest Regards
Hi Jeff,
I’m glad to hear that!
I use the 200 on the 5 minute chart. I either trade a bounce off the 200 or I use it as a profit taking target when the chart shows a reversal signal that will return to home base, usually after the 20 and 50 flatten and have been broken and the price is far departed from the 200.
For a 200 day MA strategy, I would not trail my trade with the 200, as most of your earnings will be eaten by the time it crosses the 200 to exit. I don’t hold a trade that long 🙂 I’d maybe trail it with the 50 or the 20 after a bounce off the 200. That applies to all time frames I might trade, although 5 minute is my current favorite.
5 minute let’s me get out of the market after a couple hours of trading and not worry about what happens overnight. Stress free. 10-40 pips a day is all I look for.
I often toy with the idea of adopting longer term strategies. Especially when I read your articles talking about 4 hour chart etc. But I don’t think I’m brave enough to enter with that high a risk on forex. The price doesn’t seem to get out of it’s danger zone fast enough. 5 minute allows me to enter with 10-50 pip potential, and I never lose more than 10 pips on a good trade that failed. Even if my trade was incorrectly entered and I’m long instead of short by mistake, I still won’t lose more than 20 pips. 25 if the market really wants to teach me a lesson. But entering a 4 hour chart signal I could lose 100 pips if I’m wrong, and usually the 4 hour signal that attracts me doesn’t show up when I’m looking at the chart. But on 5 minutes I always find 1-3 trades between 8-11am New York time.
I do find it frustrating though that many big moves seem to happen between 4-6am during EU trading hours while I’m asleep. I miss gorgeous entries that make 70 pips while sleeping and trade the scraps at the end of the EU trading day. But I don’t plan on trading at 4am so it is what it is.
Love your articles and information! A lot of it has made me a much better trader these past few months! Your website has been a blessing.
Hi Mike,
Interesting!
I’m glad to hear that…
Great insights, Mike. I am a newbie located in the UK. Maybe, I will benefit from the gorgeous entries you are talking about during the early hours in EU hours. Let me know if you can share some insights with me. My email is: callybatigol@gmail.com
Very helpful explications!!! Thank you so much.
Best regards from Germany.
Hi Achim,
You are most welcome!
Thank you very much, great information. You are the best
Hi Pascual,
It’s my pleasure!
Cheers…
Superb .. Thank you very much for this … 🙂
Hi Elango,
You are most welcome!
I’ll be applying it the way you shared above.
Thank you for presenting it so simple.
Thank you Rayner.
Hi Manoj,
Glad to hear that!
Hello Rayner, your write-ups on Moving Average and others, have been helpful. I look forward to reading more and as well, to meet you. You have being a lovely development to Forex Trading, its bunch of beginner and even the professionals that still holds their Trading fundamentals very essential. My humble regards to all your splendid works! Cheers.
Hi Farouk,
You are most welcome!
Cheers…
In love of this 200am
Thanks Ryaner you’re a good teach
Hi Linathi,
You are most welcome!
I’m in big confusion regarding Ascending and descending triangle . In some books Ascending triangle is mentioned as bearish and vice versa . I’ve also backtested and found that descending triangle break out at major supports in the higher side gives great upward moves ! Pls clarify
Hi Rayner,
If the Pullback Stock Trading System goes for free, why do we still to pay a printed version to be delivered and not distribute through a downloadable PDF copy? I am sure this should be a better distribution channel and environmental friendly. It would be just like your other materials made available to us via the latter channel.
I hope you can revert and allow us to download this precious treasure soonest. Your effort to share and prepare these materials and supporting advice shall not go unnoticed!
We appreciate your attention and understanding on the matter.
Thanks.
Hi Max,
The major aim is to leave something physical in the world more like a legacy.
Cheers.
Woww good sharing …..
Hi Mayur,
You are welcome!
Thanks Rayner. If this is art then you are a gallery.
It’s really a a nice stuff Rayner.
Hi Ngetich,
Thank you!.
You the best teacher of the market
Lots of love
Lee the good work
Just want to know whether you have a webinar so we do analysis together
Hi Micheal,
You are most welcome!
Cheers.
i am using 200 MA in my trading system its very useful thank you rayner
Hi Nandha,
I’m glad to hear that!
Cheers.
Thanks so much for taking the time to share these tips with us Rayner. I really like your explanations and I’m learning (little by little). Hopefully one day I will actually become consistently profitable and then you’ll hear my cheers.
Hi Dona,
I’m glad to hear that!
Cheers.
Thank you Mr Rayner, I have learnt alot following your tutorials and updates. I’m hoping someday I can meet you in person.
I becoming a better and consistently profitable trader. Thanks one more for the selfless service.
Hi Ofoegbu,
I’m glad to hear it!
Cheers.
do you have any note of how you trade using 200 and 20 ma on both short & longer time frames, when profiting daily and also for long term ? thanks for this good works, am ambled.
Hi William,
Check out this post.
https://www.tradingwithrayner.com/200-day-moving-average/
perfect, which book sould i buy to have this topic in it ? how do i buy ? is it possible to have here in turkey ?
Thanks for giving us this value for free Rayner
You are welcome, Eugene!
Smart guy
Thank you so much Rayner.
You are most welcome, Piera!
This 200MA apply to all such as force,crypto and shares?
Hi Bryan,
You can check it all out on your chart.
Cheers
hello sir your learning strategies are usefull to me and demonstrate into trading thank you
Thank you, Naresh!
Thanks for the updates so cool
Cheers, Pagouo!
You are the BEST!
Thank you, Akiii!
Rayner which timeframe we should consider when we apply 200 MA?
Hi AD,
Your daily timeframe.
Cheers.
The 200MA forms part of my trading strategy conditions – but when price is above, sell when it’s below. And it’s thanks to you I even have a strategy! Thanks man.
Glad to hear that, Dan!
What is the preferred time frame of 200 MA for intraday and Swing trading ?
Hi Shashi,
Use the Daily timeframe.
Cheers.
Wow, what a clarity this article has brought. Thanks for providing Pro tips.
You are most welcome, Ghanshyam!
You have brought life into me by your teaching. Trading forex was like a nightmare and mirage to me. Now you have made everything possible and simple to me. The bone shall rise again.
Thank you Mr. Rayner and God bless the day I found you.
Awesome, Obinna!
Sir i want this book how can i buy this book
This is, from experience, a very very effective strategy. I would add that if you are buying the break up stops should be placed below the last MAJOR swing low before price moved up to cross the 200, vice versa for sells. I utilise a 1% risk across the stoploss. Profit target should be at least 2risk, best of luck all and thanks Rayner for posting
Which moving average help to day trading?if you can plzz make a video or write a article about it…….anyway thank you so much sir..i studied many things from you❤️
i just recieved the pullback book last thursday…thanks sir my trade last friday 3profit 1loss using your pullback strat…thanks
Awesome, Mark!
I am huge fan of 200 MA. You gave an additional strength to my strategy.
I’m glad to hear that, Dinesh!
Rayner ..you are the best
Thank you, Sandeep!
After blowing my account this morning i lay on bed thinking what could be the best strategy for milking the market. I went to the charts with my fone on a slide position and gosh! I saw the wonders of 200 ma. Then igooled 200 ma and came to this webset and opened my eyes how 200 ma could be a great tool when trading forex.Thanks alot.
Awesome, I’m happy you appreciate it, Chipiliro!
How about something on how to trade Binary Option?
Hi Kainaneh,
Rayner does not trade the Binary options.
Cheers.
Thank You So Much Rayner This Is So Informative And Helpful
Hey Emmanuel,
You are most welcome!
Cheers.
hi …i watch your YOUTUBE videos and i love the way you explain .keep doing the good work …..cheers
Thanks for watching our Youtube videos, Vikas!
Keep on learning!
Cheers!
Thank you Rayner for explaining 200 MA so nicely.
hey there, Satendra!
Jarin here from TradingwithRayner Support Team.
You’re welcome! Hope it helps you to better time your entries and exits!
Cheers!
Everyday am learning New things
Glad to hear that, Stuart!
Thanks so much Raynor. I searched for 200 ma confirmation of a trend and you gave me so much more. You are the best. Thanks again.
Hey there, Debra!
I am glad it helped you!
Cheers!
You just revealed the hidden key to the gold chest, I appreciate your good works keep it up bro.
Thanks, Kenneth!
I look for buying opportunities. When “the price” is above 200MA on my 4hr entry timeframe at the same time, above the daily timeframe. And vice versa for short entreis. Otherwise, I move to other markets.
Thank you for sharing, Mohammed!
Very informative,thnks rayner..
You are most welcome!
Thank you sir, you are the best thing that has ever happened to me in this world of trading, without you, I don’t know what I would have done, you brought so much light to me and I will continue to be grateful to you
Hey there, Chinonso!
We appreciate your warm words! Thank you for supporting TradingwithRayner!
Cheers!
Sir your teaching has been a support and my footrest on this journey of forex market, I don’t miss a day going through your previous classes on YouTube as a beginner, indeed you are a pro,
Thank you for your kind words, Onyeanula!
We wish you all the best.
Cheers!
Hi Rayner great strategy on trend following, my only question is how to set trailing stoploss on MT4 using 200MA? hope you can enlighten me…..thanks!
Hi, Jovel!
Jarin here from the Tradingwithrayner support team.
You can go to indicators, choose the moving average, and set it to 200 MA. If you’re long, then you’ll only exit the trade when the price closes below the 200MA.
Or if you’re short, exit the trade only when the price closes above the 200MA.
Hope this helps!
Since the time I have tried to know the use of MA it’s so tough for me but today I understand it so much thank you so much more knowledge in Jesus name
You are most welcome, Oyewole!
Rayner I want buy signal from you. How can I get it
Hi, Nura!
Jarin here from TradingwithRayner Support team.
You might be interested in Rayner’s Pro Traders Edge! for more info, you can check it here:
https://www.tradingwithrayner.com/pte/
Hope this helps!
Wonderful,.I like this
Thanks, Dominic!
I have been following you for a while and I can say what you give freely is GOLD. Others will give this at cut throat price. Am yet to be consistent in my profits but this has deepened my hope. God bless you
Thank you for your kind words, Eric!
Thank you Teo! Are the 200 MA strategies the same for SMA/EMA/SMMA regardless time frame?
Yes. EMA is simply more responsive compared to SMA, because of the way the EMA is calculated.
But in the grand scheme of things, the concept is what matters more and not whether you should use EMA, SMA, WMA, etc.
Hope this helps!
Very Supportive
Thanks, Om!
Your explanation on usage of 200MA is very impressive. I will help me how to time my entry trigger & exit from my trade.
Thank you, Alexander!
Glad to know this helped you with timing your trades more effectively!
Cheers!