According to most textbooks:
Whenever you spot a Hammer candlestick pattern, you should go long because the market is about to reverse higher.
And that’s what you do.
But the next thing you know…
The price immediately reverses and you get stopped out for a loss.
And you wonder to yourself:
“Wait a minute, isn’t a Hammer candlestick a bullish signal?
“Why did the market reverse against me?”
“I thought I know how to trade hammer candlestick!”
“What’s going on?”
Well, let me tell you a secret…
A Hammer candlestick pattern doesn’t mean jackshit (and I’ll explain why later).
But first, let’s understand what a Hammer candlestick pattern is about…
What is a Hammer candlestick pattern?
A Hammer is a (1- candle) bullish reversal pattern that forms after a decline in price.
Here’s how to recognize it:
- Little to no upper shadow
- The price closes at the top ¼ of the range
- The lower shadow is about 2 or 3 times the length of the body
And this is what a Hammer means…
- When the market opens, the sellers took control and pushed price lower
- At the selling climax, huge buying pressure stepped in and pushed price higher
- The buying pressure is so strong that it closed above the opening price
In short, a hammer is a bullish candlestick reversal candlestick pattern that shows rejection of lower prices.
Now, this is important.
Just because you see a bullish Hammer candlestick doesn’t mean you go long immediately.
Here’s why…
The truth about Hammer candlestick (that most gurus don’t even know)
Are you ready?
Here you go…
- A Hammer is usually a retracement against the trend
- The Hammer doesn’t tell you the direction of the trend
- The context of the market is more important than the Hammer
Let me explain…
1. A Hammer is usually a retracement against the trend
Recall:
I said the Hammer candlestick pattern doesn’t mean jackshit.
And here’s why…
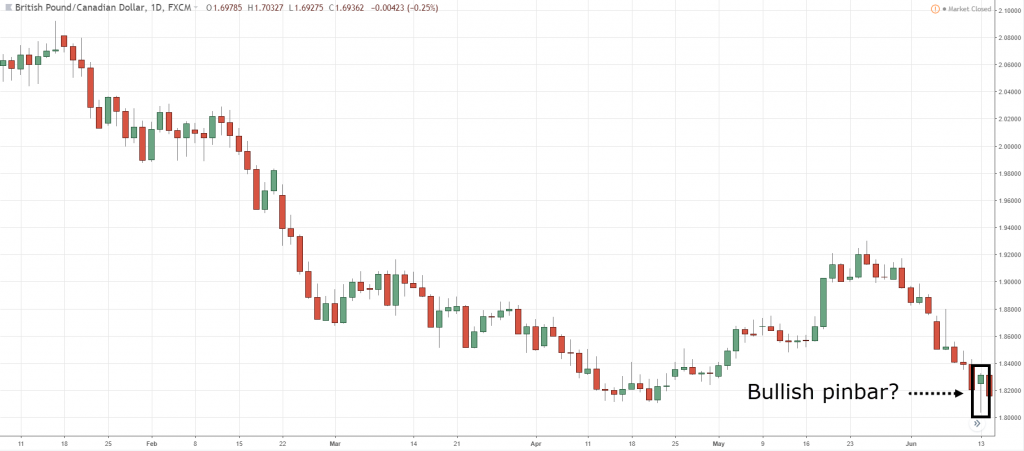
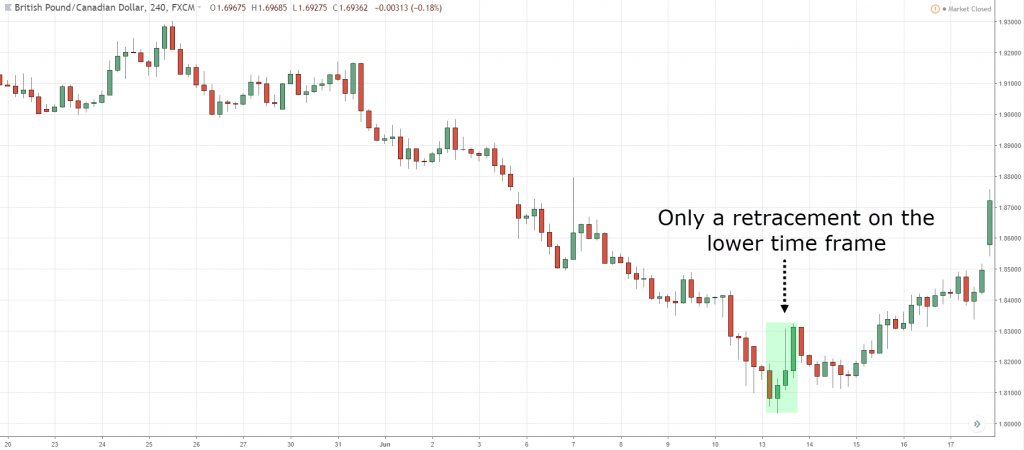
The Hammer is usually a retracement against the trend (on the lower timeframe).
Here’s what I mean…
This means if you randomly spot a Hammer and go long, you’re likely trading against the trend.
It’s no wonder you get stopped out and lose money consistently.
2. The Hammer candle doesn’t tell you the direction of the trend
Now…
A big mistake traders make is thinking the trend will reverse when a Hammer is formed.
Wrong!
Here’s why…
A trend is made up of a series of candles (possibly 100 or more).
Now let me ask you…
What are the odds of the trend reversing because of one candlestick pattern?
Slim.
So, if you want to know the direction of the trend, ask yourself…
“Is the price moving higher or lower?”
Don’t look at an individual candlestick pattern to tell you the direction of the trend.
3. The context of the market is more important than the Hammer
Now you’re probably wondering:
“What is the context of the market?”
It refers to the market condition like whether the market is in an uptrend, downtrend, sideways, has strong momentum, etc.
And this matters, a lot.
For example:
If the market is in an uptrend, it’s likely the price will move higher (regardless of whether there’s a Hammer, or not).
Likewise, a Hammer can appear in a downtrend, but the price is likely to move lower since the market is in a downtrend.
Now…
You’ve learned the truth about the Hammer candlestick that most traders never find out.
And you’re probably wondering:
“So how do I trade the Hammer candlestick pattern?”
Well, that’s what you’ll discover next.
Read on…
Hammer candlestick trading strategy (My proprietary trading formula)
Here’s the deal:
You don’t want to trade any candlestick pattern in isolation.
Instead, you want to trade it within the context of the market (as mentioned earlier).
So the question is… how to trade hammer candlestick?
Well, here’s a simple formula that works.
I call it the T.A.E Formula.
Here’s how it works…
Trend – Trade in the direction of the trend
Area of value – Trade from an area of value
Entry trigger – Identify an entry trigger
Let me explain…
1. Trade in the direction of the trend
If you trade in the direction of the trend, you increase the odds of your trade working out.
You might be thinking:
“How do I define the trend?”
Well, you can use a Moving Average Indicator to help you.
Here’s how…
- If the price is above the 200MA, then have a long bias
- If the price is below the 200MA, then have a short bias
Next…
2. Trade from an area of value (AOV)
AOV is an area on your chart where buying/selling pressure is lurking around (E.g. Support & Resistance, Trendline, Channel, etc.).
The key thing is to enter your trades close to an AOV.
Here’s why…
- A favorable risk to reward (as your stops are tighter)
- Potential buying/selling pressure to push the price in your favor
- Stop loss harder to get triggered it’s “protected” by market structure
Next…
3. Identify an entry trigger
The purpose of an entry trigger is to identify a repeatable pattern that gets you into a trade.
So, once the conditions of your trading setup are met, you’ll look for an entry trigger to enter a trade.
It can be a Hammer candlestick or any other bullish reversal candlestick patterns.
Now, this is important…
You don’t want to trade entry triggers in isolation.
It’s only AFTER the conditions of your trading setup are met, then you look for an entry trigger.
Does it make sense?
Great!
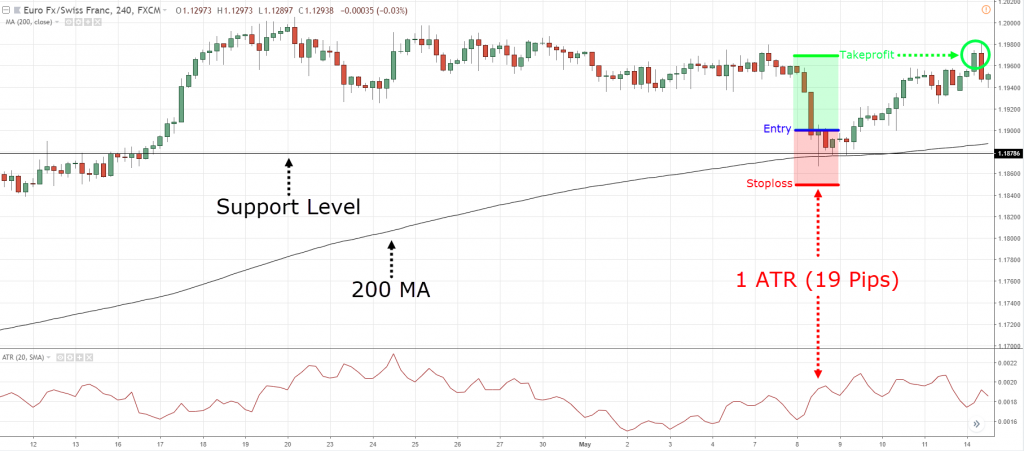
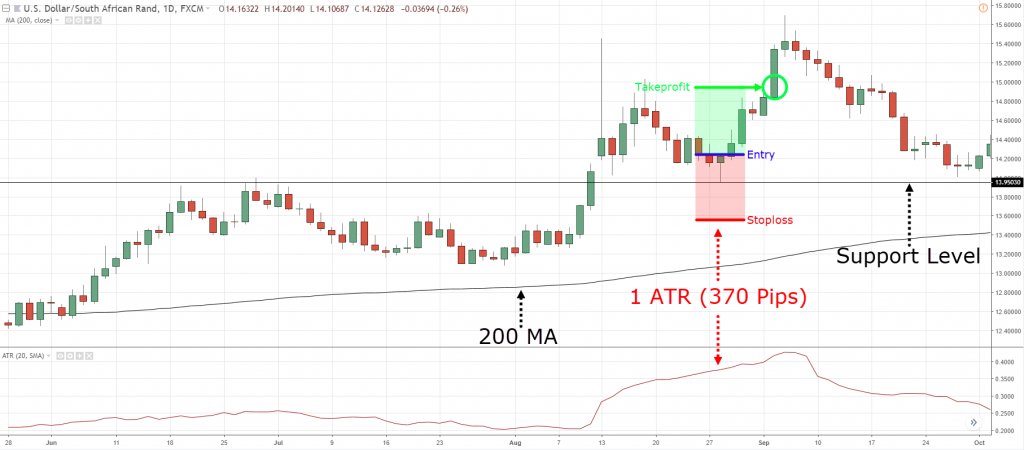
Now let’s look at a few examples to see the T.A.E Formula in action…
T.A.E. winning trade on EUR/CHF:
T.A.E. winning trade on USD/ZAR:
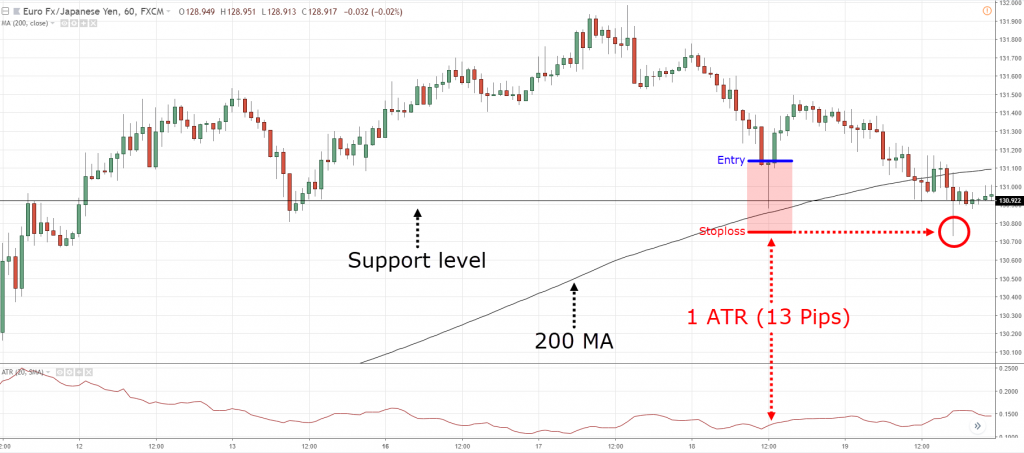
T.A.E. losing trade on EUR/JPY:
And those are the meat of the hammer trading strategy.
Bonus Tip: The Break of Structure Technique
Here’s the deal:
The Hammer candlestick pattern is a powerful entry trigger.
And if you were to trade it, your stop loss is at least the range of the Hammer (or more).
But won’t it be great if you can reduce the size of your stop loss and improve your risk to reward?
This means if your original Hammer trade has a 1:2 risk reward ratio, then after applying this technique, you’ll have a 1:5 risk reward ratio (or more).
Sounds awesome?
The let me introduce to you the Break of Structure technique.
Here’s how it works…
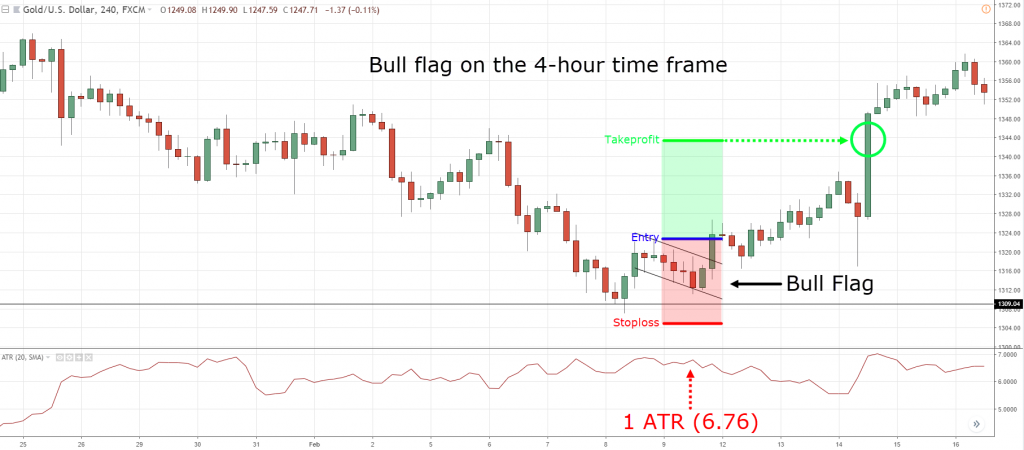
- Identify a trading setup using the T.A.E Formula (daily timeframe)
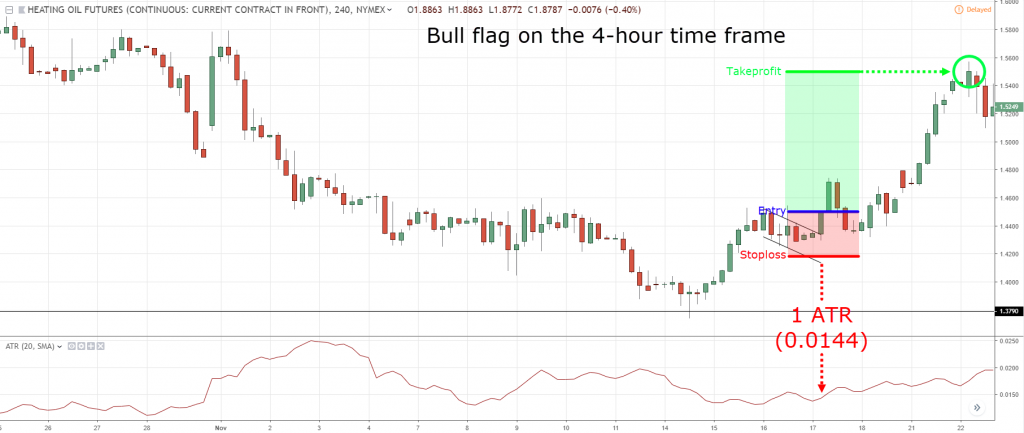
- Go down to the 4-hour timeframe and look for a Bull Flag pattern
- Buy on the break of the swing high
- Set your stop loss 1 ATR below the swing low
Here’s what I mean…
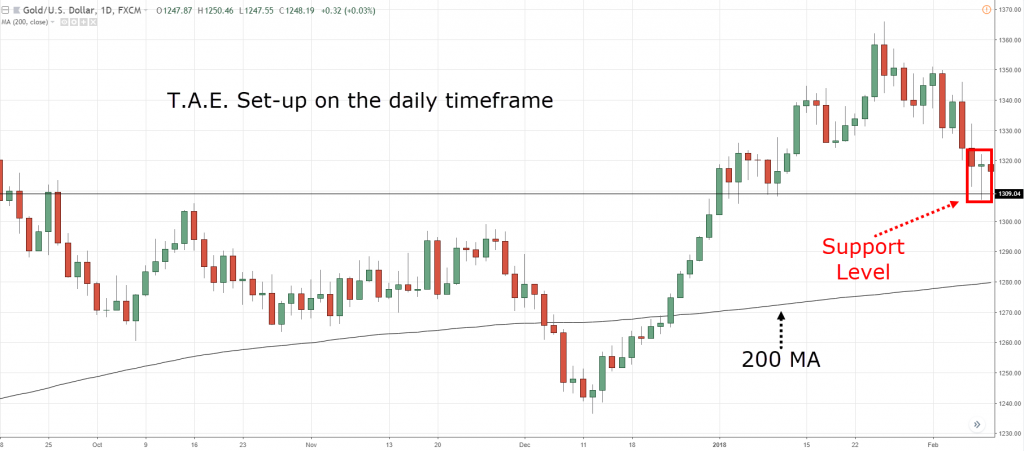
T.A.E. Set-up on XAU/USD:
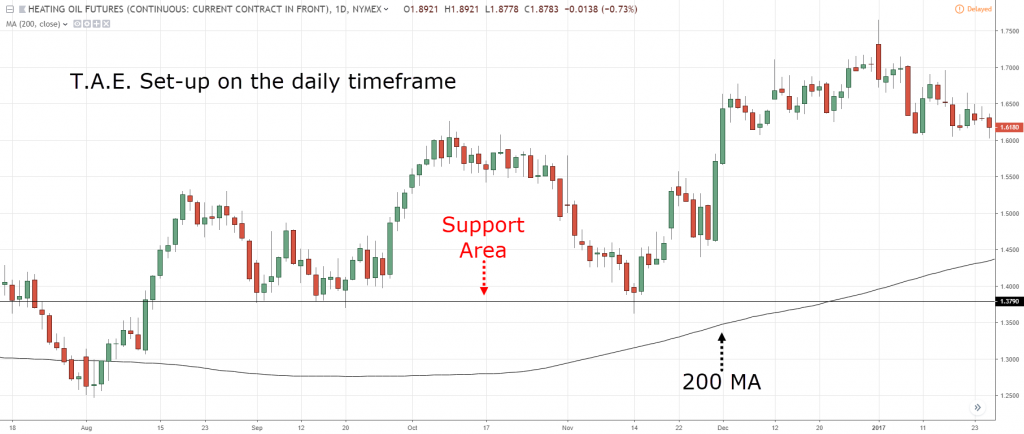
T.A.E. Set-up on HO1! (Heating Oil):
This is powerful stuff, right?
Once you’ve mastered this technique, you can consistently find insanely profitable trading opportunities (that most traders never find out).
Conclusion
So in this hammer trading strategy guide, you’ve learned:
- A Hammer is a (1- candle) bullish reversal pattern that forms after a decline in price
- 3 things you must know about Hammer: 1) it’s usually a retracement against the trend 2. It doesn’t tell you the direction of the trend 3. The context is more important than the pattern
- How to use the T.A.E Formula to find high probability trading setups
- The Break of Structure technique that allows you to find insanely profitable trading opportunities
Now here’s what I’d like to know…
How do you trade the Hammer candlestick pattern?
Leave a comment below and share your thoughts with me.


As always very insightful. Just one observation, in your very first chart example on the bullish pin bar on the daily .. had you entered long the next trading day on the 14th at around 1.82 you would have actually been profitable by the 17th at 1.87.. so for this example wasn’t the best chart as despite it being a retracement on the Lower Time frame (4hrs) a swing trade on the hammer worked as one would expect. Nevertheless, in context you succeeded in adding an extra dimension to the hammer which I wasn’t aware of. Thank you Raynor.
Thanks for sharing, Noel.
Cheers
Very informative and helpful teaching materials on the hammer which I tend to use
I definitely gain from your sharing
Awesome to hear that, Dom!
This is great stuff how frequently do you post or send these insightful ideas. Do you do webinars at times ?
I don’t do it anymore.
But I just might do it again, cheers.
I have steered clear of single candlestick patterns for a while now due to having lost money by doing what you advised not doing at the beginning of your post. However, this has opened my eyes up to using single (at least the powerful ones) candlestick patterns to basically give a queue to keep your eyes peeled for something to happen in the near future and to not so much assume that the reversal or continuation (depending on the pattern and market sentiment) is going to give an immediate 1 to 2 day action. Thank you so much for this post Raynor you have opened my eyes up to so much already and you make many other things more clear when it’s jumbled in my head. Thanks for all of your valuable information it has increased my knowledge tremendously and cleared a lot of things up.
You’re welcome, Jeremiah.
I’m glad you find it useful, cheers!
Awsome !!
Cheers
Valuable information
Thanks!
Valuable information. Thank you Rayner!
My pleasure!
Thanks, Rayner, but what is your trading time frame?
Could you elaborate on this topic for shorter time frames, like 1H.
Hammer pattern is pretty indicative on 1H time frame and l if you catch early you could collect quite some PIPs in day-trade, even if it is a retracement move.
I trade off the 4-hour and daily timeframe.
cheers
Awesome… thanks prof godbless
Cheers
Hi Rayner
I am only a new trader but l have learnt a lot from your strategies especially the candle stick patterns have been so beneficial in my trading since l started subscribing your videos.
I really appreciate your generously giving.
Keep it up.
Awesome to hear that!
Rayner whats the meaning of jickshit?
but anyway the lesson was heplful man big up bro
Very nice
Cheers
Hi, I know you Trader on 4h TF.
But can this work on a lower timeframe like 15min?
Would very much appreciate your comments.
The concepts and principles can work on the lower timeframe.
Thanks for sharing very imformative…I learned a lot form your watching always your video
I’m happy to hear that!
Very nice sir great things facts you explained nicely…thanks sir keep your flag high
Thank you, Manoj!
An hammer pattern can be traded when it forms on your structure.
Great teaching in a very simplified way. Thanks so much Teo. My understanding of forex is improving with your team detailed teachings.
You’re welcome!
what if my software don’t show 4hrs chart?
Hi! I would like to know what is the difference between the 4 hour chart, and the Daily chart. I know all about the general stuff, but I would like to know about the differences in trading.
Maybe you could do a video if you find the subject pertinent.
Thanks for the teaching professional approach you are using.
I’ll look into it, cheers.
He already did a video about time frame
https://m.youtube.com/watch?feature=youtu.be&v=C3KRwfj9F8Q
Check out that video on YouTube
I wait for the next 2 candle to for up to be very sure after hammer then enter trade
Thanks for sharing, David.
Can I use this strategy on 15mins time frame ?
I notice the hammer head but don’t trade with, I wait till I get a confirmation of the movement when the next candle completes.
[…] Hammer is a (1- candle) bullish reversal pattern that forms after a decline in […]
[…] Hammer […]
Thank’s a zilion…
No big deal, Farid!