What is momentum trading and how does it work?
Momentum trading is similar to breakout trading.
As a momentum trader, you buy only when the price is moving in your favour with the hopes of selling at a higher price.
Here’s what I mean…
Now you’re probably wondering…
Does momentum trading work?
Here’s the deal:
Momentum trading has been around a long time and it’s backed by academic studies like…
And it’s adopted by traders who have profited millions from the markets like Jesse Livermore, Richard Dennis, Ed Seykota, etc.
Now…
There are many ways you can adopt momentum into your trading.
The momentum trading strategies can be used in the Futures market, Stock market, and even Forex market.
So let’s dive in right now…
Momentum trading in the Futures market (a systematic approach)
Now, one of the earliest forms of momentum trading is in the Future market (also known as Trend Following) — and it’s used by the Turtle Traders, Market Wizards, Hedge Funds, etc.
To pull this off, you must follow these 5 principles closely…
- Buy high and sell higher
- Trail your stop loss to ride the trend
- Don’t complicate things, just follow the price
- A losing trade should only cost you a fraction of your capital
- Trade a variety of markets to increase the odds of capturing a trend
If you want more details, check out The Trend Following Trading Strategy Guide.
Now with these principles, you can develop a Momentum trading strategy for the Futures market.
Here’s an example (inspired from Following The Trend by Andreas Clenow)…
Trading rules:
Go long when the price closes the highest over the last 200 days
Go short when the price closes the lowest over the last 200 days
Have a trailing stop loss of 6 ATR
Risk 1% of your capital on each trade
Markets traded:
Gold, Copper, Silver, Palladium, Platinum
S&P 500, EUR/JPY, EUR/USD, Mexican Peso, British Pound
US T-bond, BOBL, BUXL, BTP, 10-year Canadian bond
Heating Oil, Wheat, Corn, Lumber, Sugar
The backtest results:
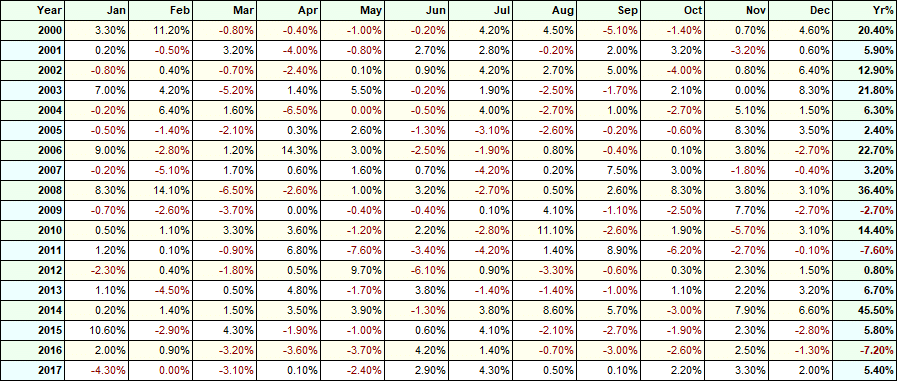
Number of trades: 937 trades
Winning rate: 42.8%
Annual return: 9.89%
Maximum drawdown: 24.12%.
Next, let’s talk about the pros and cons of momentum trading in the Futures market…
The benefits:
- Requires less than an hour per day
- Does well during a crisis
- You don’t need fancy indicators or tools
The downside:
- Long drawdown period
- Require a decent amount of capital
- Expect to be wrong more than half the time
Now, this trading approach is suitable if you want to trade part-time and still beat the markets.
But if you don’t want to trade Futures or don’t have a large capital to start with, then the next trading approach might suit you…
Momentum trading in the Stock markets (a systematic approach)
When it comes to momentum trading in the stock markets, here are a few principles to follow…
- Trail your stop loss to ride the trend
- Have a ranking system to know which stocks to buy
- Trade a portfolio of stocks to remove the idiosyncratic risk
- Buy only if the broader market is in an uptrend, or else stay in cash
And with these principles, you can develop a momentum trading strategy for the stock markets.
Here’s an example of momentum stock trading (inspired from Weekend Trend Trader by Nick Radge)…
Trend filter:
Buy only if the Russell 3000 index is above the 100-week Moving Average (or else stay in cash)
Trading rules:
Go long when a stock hits a 50-week high (if there are too many stocks to choose, select the top 20 that have the largest price increase over the last 50-weeks)
Have a 20% trailing stop loss
Maximum of 20 stocks with 5% of capital allocated to each stock
Markets traded:
Russell 1000 stocks
The backtest results:
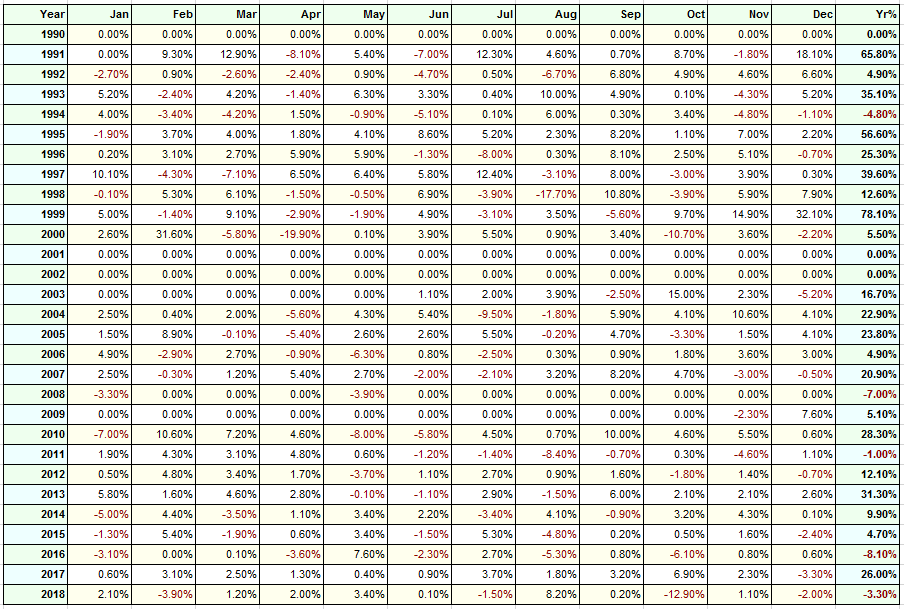
Number of trades: 905
Winning rate: 49.17%
Annual return: 15.70%
Maximum drawdown: 35.08%
Next, let’s talk about the pros and cons of momentum trading in the Stock market…
The benefits:
- It beats a buy and hold approach (higher returns and lower drawdown)
- You’re “protected” during a recession or financial crisis
- Minimal time required, only trade once per week
The downside:
- You can’t do it manually — need trading tools to scan for your trading setups
- Long drawdown period
Now if systematic trading is not for you, then you can tweak the trading approach for discretionary stock trading.
Here’s how it works…
Momentum trading in the Stock markets (a discretionary approach)
Unlike the systematic approach where you’re buying every 50-week breakout, you can choose to be selective with your entries.
Here are a few techniques you can use for discretionary momentum stock trading:
- The breakout with a buildup
- Trend continuation chart patterns
- The Moving Average Bounce
I’ll explain…
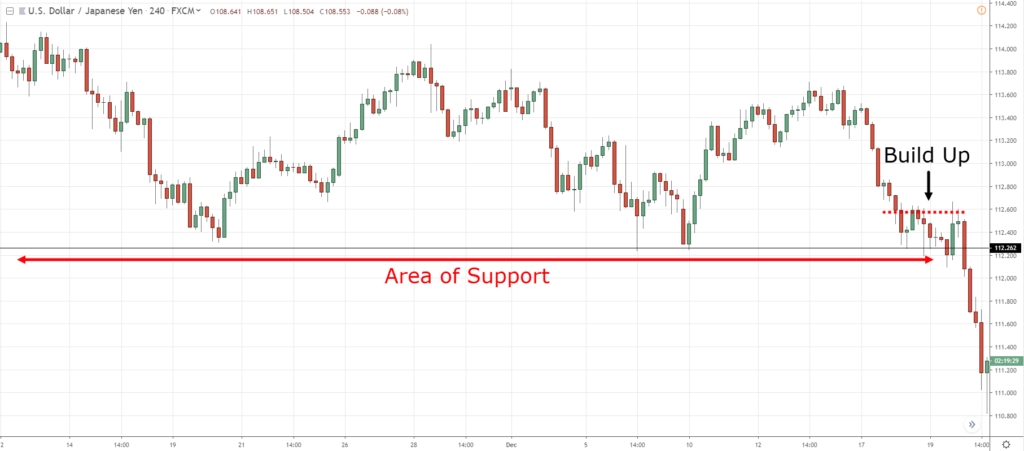
The breakout with a buildup
Here’s the deal…
When you trade breakouts, you want to have a tight consolidation and low volatility prior to the breakout (otherwise known as a buildup).
Why?
#1: Smaller stop loss and larger position size
You know the size of your stop loss is a function of the market’s volatility.
So when volatility is low, you have a smaller stop loss — which allows you to increase your position size and still keep your risk constant (the dollar amount).
#2: Higher R multiple on your trades
And that’s not all…
Because the market moves from a period of low volatility to high volatility and vice versa.
So when you position yourself in a low volatility environment, there’s a good chance volatility could move in your favour.
When that happens, you can achieve high R multiple on your trades — earning 1 to 5 risk reward ratio or more.
Here’s how a breakout with a buildup looks like…
If you want to learn more about breakouts, then watch this training below…
Next…
Trend continuation chart patterns
This is similar to the Forex example you saw earlier.
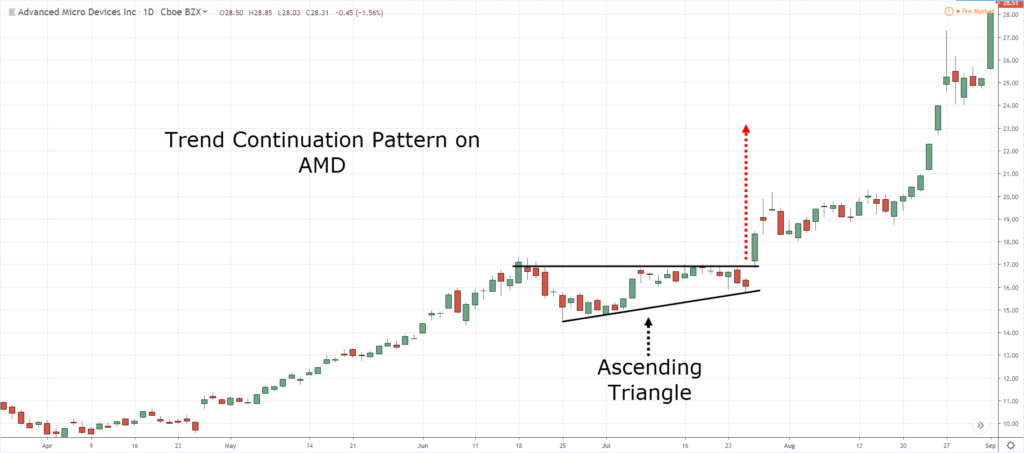
What you’re looking for is trend continuation chart patterns (like Bull Flag, Ascending Triangle, etc.) to trade in the direction of the trend.
Here’s an example…
And finally…
The Moving Average Bounce
Here’s the thing:
In a healthy trend, the market tends to respect the 50-day Moving Average (MA).
This means you can look for buying opportunities as the price retraces towards the 50-day MA.
Here’s how…
- If the price respects the 50-day MA, then wait for a pullback towards it
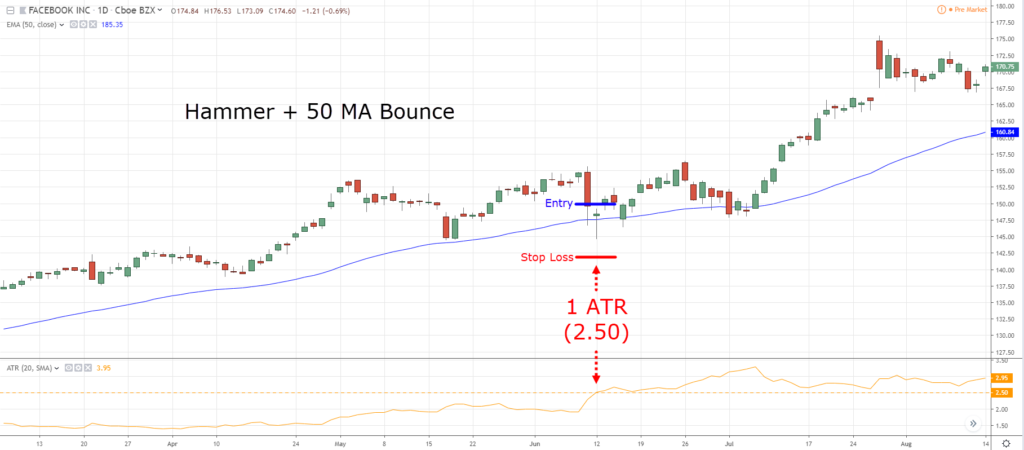
- If there’s a pullback towards the 50-day MA, then wait for a bullish reversal candlestick pattern (like Hammer, Bullish Engulfing, etc.)
- If there’s a bullish reversal pattern, go long on the next open and stop loss 1 ATR below the swing low
An example:
If you want to learn more about The Moving Average Bounce, then check out this training below…
Momentum trading in the Forex market (a discretionary approach)
First, how do you define momentum in the Forex market?
One way to do it is to identify the strongest and weakest currencies.
Then you pair them together and you’ll get currency pairs with the strongest momentum.
Here’s how to do it…
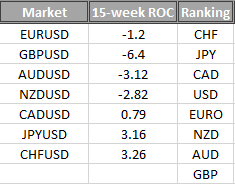
- Calculate the 15-period Rate of Change (ROC) for all major currency pairs (on weekly timeframe)
- Rank the currency pairs from strongest to weakest
Here’s an example:
As you can see, the CHF is the strongest currency (+3.26%) and the GBP is the weakest one (-6.4%).
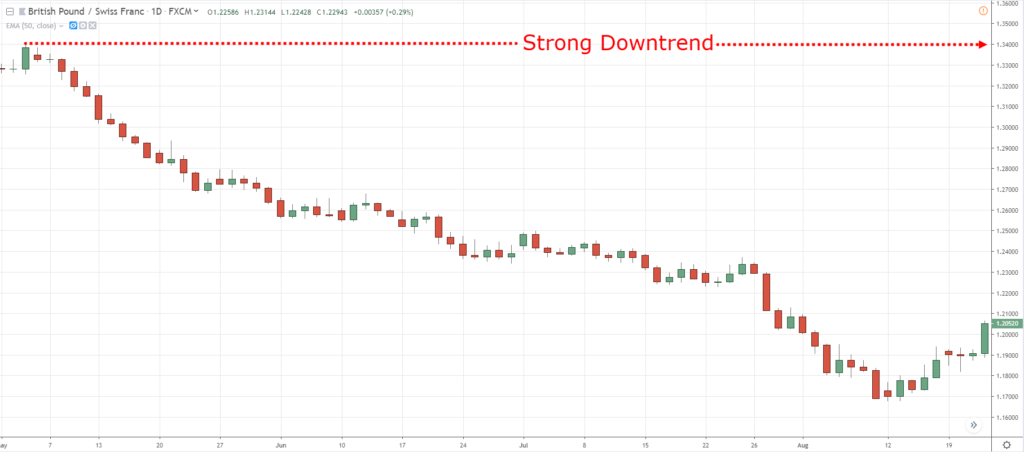
And if you rank the strongest currency against the weakest one, you’ll get GBP/CHF — which is in a strong downtrend right now…
Now you’re probably wondering:
“How do I trade such a market with strong bearish momentum?”
Well, you can…
- Trade the trend continuation chart pattern
- Trade the False Break (on the lower timeframe)
Let me explain…
Trade the trend continuation chart pattern
You might be wondering:
“What are trend continuation chart patterns?”
These are chart patterns which signal the price is likely to continue in the direction of the trend.
These chart patterns include:
- Bull Flag
- Bear Flag
- Ascending Triangle
- Descending Triangle
- Etc.
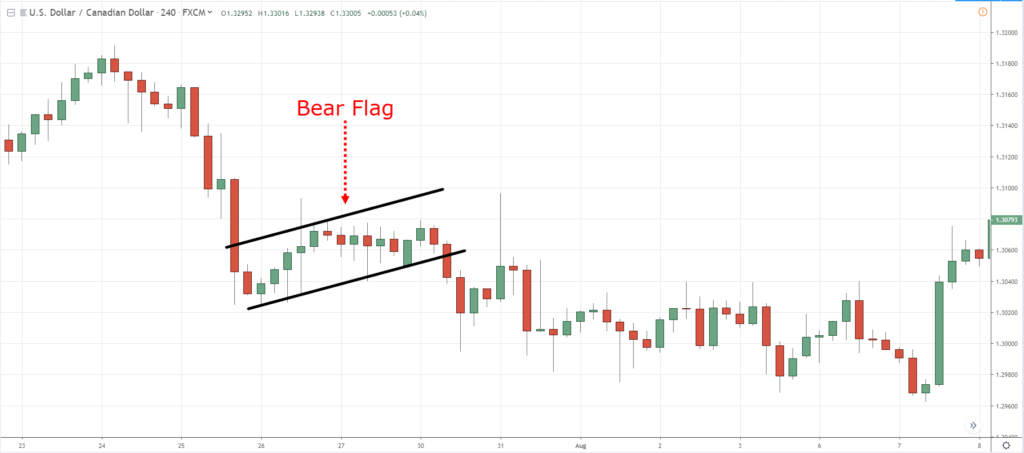
Here’s an example of a Bear Flag pattern in a strong downtrend…
Next one…
Trade the False Break (on the lower timeframe)
Now, this technique requires the use of multiple timeframes.
Here’s how it works…
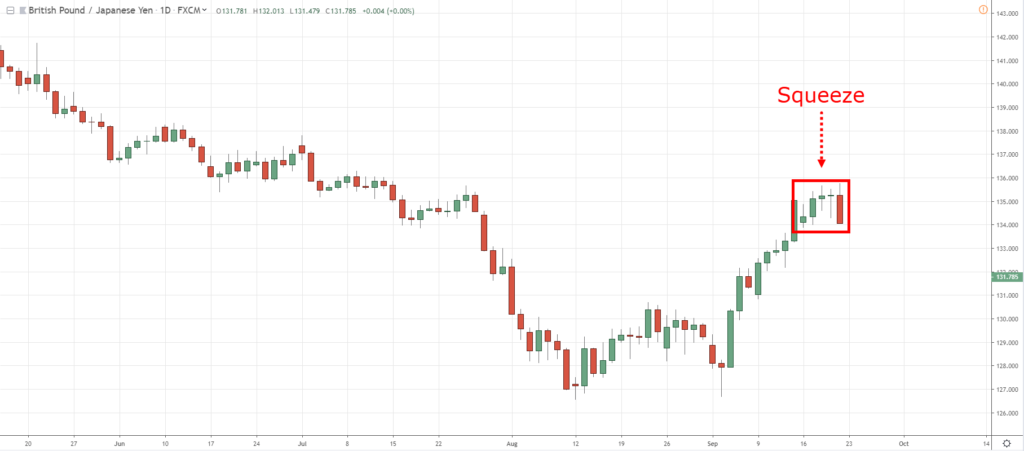
- On the Daily timeframe, you want to identify a tight consolidation where the price looks like it’s getting “squeezed”
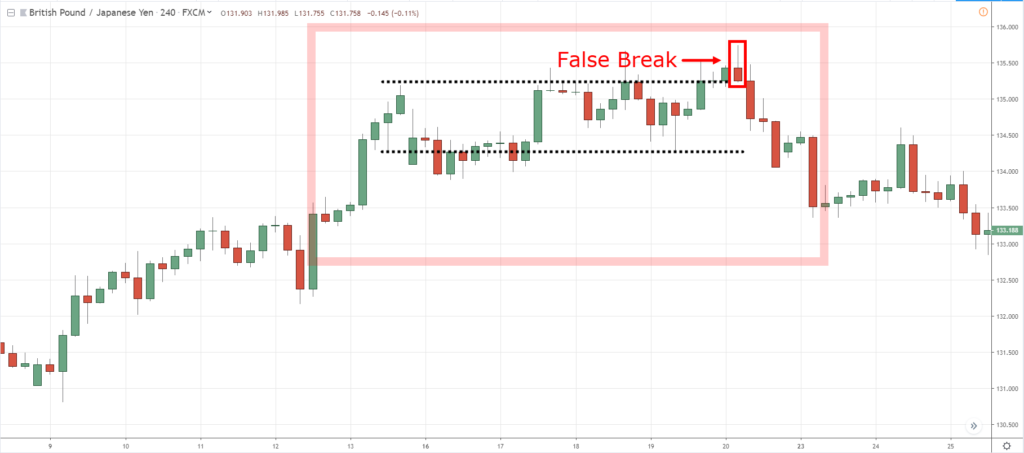
- Go down to the 4-hour timeframe and you should see a range with clear Support and Resistance
- Trade the False Break of Support for long setups (and vice versa for short)
Here’s an example…
Consolidation on GBP/USD Daily timeframe:
False Break on GBP/USD 4-hour timeframe:
Conclusion
So here’s what you’ve learned:
- Momentum trading is about buying high and selling higher (or selling low and covering lower)
- You can apply momentum trading strategies to the Futures, Stock, and Forex markets
- You can combine momentum and trend continuation patterns to find profitable trading opportunities
- Momentum trading has been around for centuries and likely to continue working as long as fear and greed exist in the markets
Now here’s what I’d like to know…
How do you use momentum in your trading?
Leave a comment below and share your thoughts with me.
Next…
Trend continuation chart patterns
This is similar to the Forex example you saw earlier.
What you’re looking for is trend continuation chart patterns (like Bull Flag, Ascending Triangle, etc.) to trade in the direction of the trend.
Here’s an example…
And finally…
The Moving Average Bounce
Here’s the thing:
In a healthy trend, the market tends to respect the 50-day Moving Average (MA).
This means you can look for buying opportunities as the price retraces towards the 50-day MA.
Here’s how…
- If the price respects the 50-day MA, then wait for a pullback towards it
- If there’s a pullback towards the 50-day MA, then wait for a bullish reversal candlestick pattern (like Hammer, Bullish Engulfing, etc.)
- If there’s a bullish reversal pattern, go long on the next open and stop loss 1 ATR below the swing low
An example:
If you want to learn more about The Moving Average Bounce, then check out this training below…
Momentum trading in the Forex market (a discretionary approach)
First, how do you define momentum in the Forex market?
One way to do it is to identify the strongest and weakest currencies.
Then you pair them together and you’ll get currency pairs with the strongest momentum.
Here’s how to do it…
- Calculate the 15-period Rate of Change (ROC) for all major currency pairs (on weekly timeframe)
- Rank the currency pairs from strongest to weakest
Here’s an example:
As you can see, the CHF is the strongest currency (+3.26%) and the GBP is the weakest one (-6.4%).
And if you rank the strongest currency against the weakest one, you’ll get GBP/CHF — which is in a strong downtrend right now…
Now you’re probably wondering:
“How do I trade such a market with strong bearish momentum?”
Well, you can…
- Trade the trend continuation chart pattern
- Trade the False Break (on the lower timeframe)
Let me explain…
Trade the trend continuation chart pattern
You might be wondering:
“What are trend continuation chart patterns?”
These are chart patterns which signal the price is likely to continue in the direction of the trend.
These chart patterns include:
- Bull Flag
- Bear Flag
- Ascending Triangle
- Descending Triangle
- Etc.
Here’s an example of a Bear Flag pattern in a strong downtrend…
Next one…
Trade the False Break (on the lower timeframe)
Now, this technique requires the use of multiple timeframes.
Here’s how it works…
- On the Daily timeframe, you want to identify a tight consolidation where the price looks like it’s getting “squeezed”
- Go down to the 4-hour timeframe and you should see a range with clear Support and Resistance
- Trade the False Break of Support for long setups (and vice versa for short)
Here’s an example…
Consolidation on GBP/USD Daily timeframe:
False Break on GBP/USD 4-hour timeframe:
Conclusion
So here’s what you’ve learned:
- Momentum trading is about buying high and selling higher (or selling low and covering lower)
- You can apply momentum trading to the Futures, Stock, and Forex markets
- You can combine momentum and trend continuation patterns to find profitable trading opportunities
- Momentum trading has been around for centuries and likely to continue working as long as fear and greed exist in the markets
Now here’s what I’d like to know…
How do you use momentum in your trading?
Leave a comment below and share your thoughts with me.


Thanks Rayner. A thorough and interesting article.
You’re welcome, Graham!
Hello, you are the saviour of still non profitable traders
Hi Rayner,
I see most of your trades are positional in nature. You analyse them on daily/ 4hr time frame, how do you protect you position from a gap up and gap down next morning.
Thanks my mentor am asking how do I calculate the 15 week ROC , how do I get that data
Hello Rayner, I have a question.
If a particular stock out of 20 hits SL, in the system, shall I search the Russell 1000 stocks again to fill that 1 position out of my 20 stock portfolio?
Thanks