I love the Average True Range (ATR) indicator.
Because unlike other trading indicators that measure momentum, trend direction, overbought levels, and etc.
The ATR indicator is none of it.
Instead, it’s something entirely different.
And if used correctly, the Average True Range is one of the most powerful indicators you’ll come across.
That’s why I’ve written this post to explain the awesomeness of the Average True Range indicator.
Here’s what you’ll learn:
- What is the Average True Range (ATR) indicator and how does it work
- How to “hunt” for EXPLOSIVE moves in the market before it occurs using the ATR indicator
- How to use the ATR indicator and set a proper stop loss so you don’t get stopped out prematurely
- How to use the ATR indicator and ride BIG trends
- Using ATR to set profit target
- How to identify “exhaustion” moves and market reversals with the ATR indicator
Or if you prefer…
You can watch this training video below with regards to ATR trading:
Or else, let’s get started…
ATR indicator explained — what is it and how does it work
Let’s start with the basics:
What is ATR?
The Average True Range is an indicator that measures volatility.
It’s developed by J. Welles Wilder and was first mentioned in his book, New Concepts in Technical Analysis Systems (in 1978).
Now you might be wondering:
“How is the ATR values calculated?”
Well, it’s done using 1 of 3 methods, depending on how the candles are formed.
Here’s how…
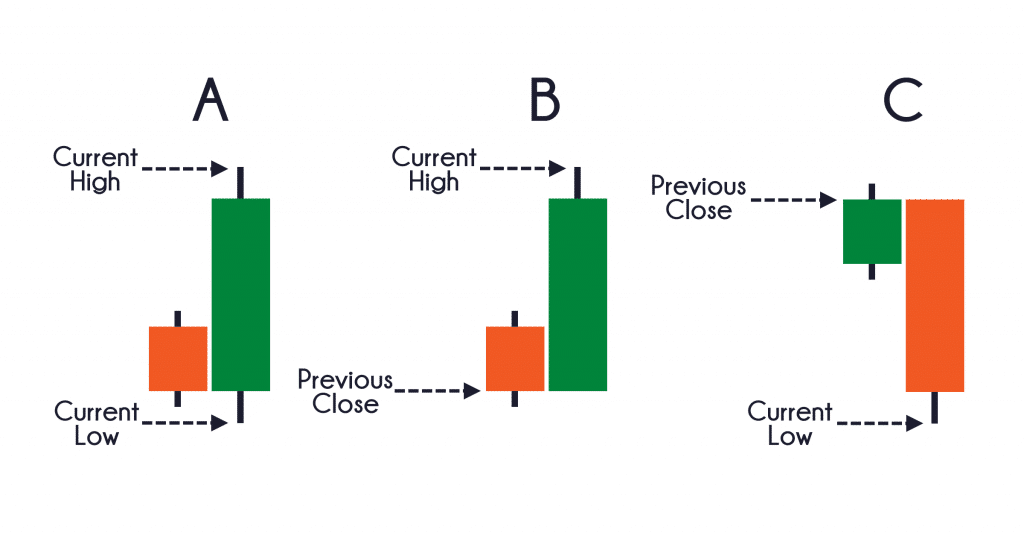
Method 1: Current high less the current low
Method 2: Current high less the previous close
Method 3: Current low less the previous close
Confused?
No worries, just look at the image below…
As you can see:
Example A: The current candle’s range is larger than the previous candle, we use method 1.
Example B: The current candle closes higher than the previous candle, we use method 2.
Example C: The current candle closes lower than the previous candle, we use method 3.
The takeaway is this…
The larger the range of the candles, the greater the ATR value (and vice versa).
Now before we continue, do you still remember what is ATR?
That’s right.
Average True Range.
So remember it as we proceed to the next section!
The ATR indicator is NOT a trending indicator
Now…
A mistake traders make in how to use ATR is to assume that volatility and trend go in the same direction.
Nope!
Recall:
The Average True Range indicator measures the volatility of the market.
This means volatility can be low while the market is trending higher (and vice versa).
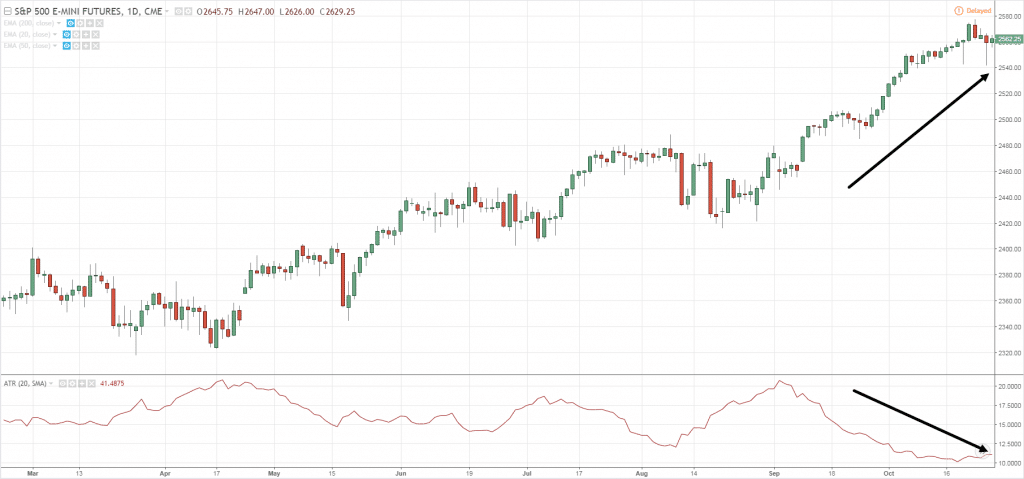
Here’s an example: The S&P is trending higher while volatility is heading lower…
Does it make sense?
Good.
Then let’s move on…
How to use ATR indicator to “hunt” for EXPLOSIVE breakout trades (before it occurs)
Here’s a fact:
The volatility of the markets is always changing.
It moves from a period of low volatility to high volatility (and vice versa).
This means that when the market is in a low volatility period… you can expect volatility to pick up, soon.
So, how do you use this knowledge to find explosive breakout trades for ATR trading before it occurs?
Here’s how…
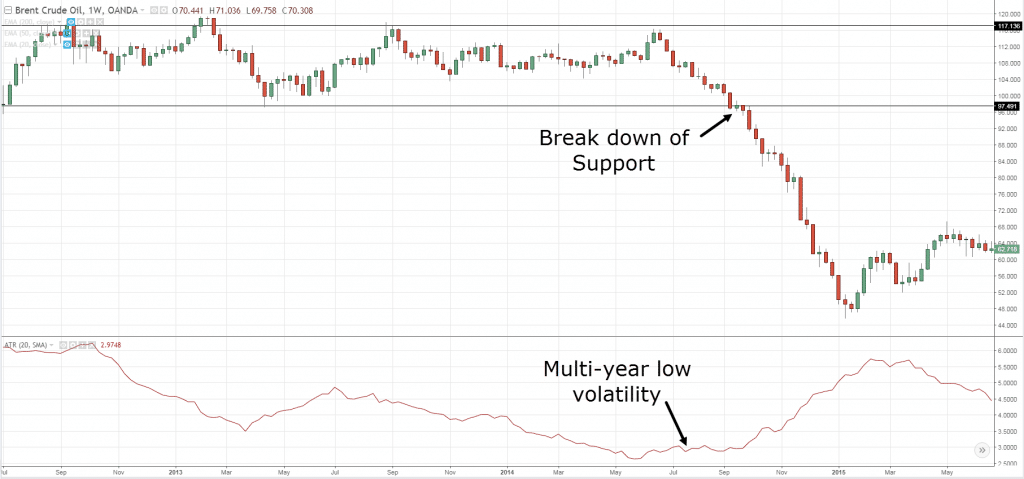
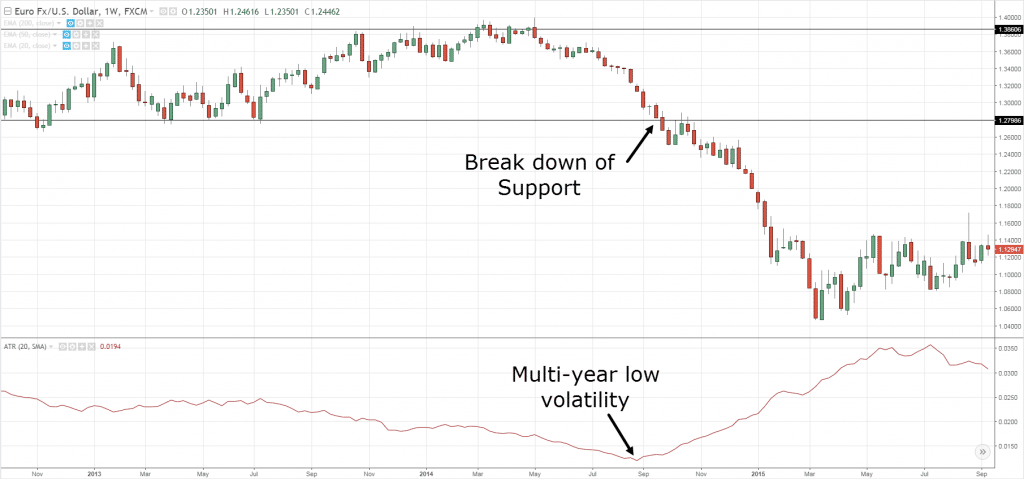
- Wait for volatility to reach multi-year lows (on the weekly timeframe)
- Identify the range during this time period
- Trade the break of the range
Here are a few examples:
Brent Crude Oil multi-year low volatility followed by a break of Support…
EURUSD multi-year low volatility followed by a break of Support…
Do you notice how these explosive moves occur after a period of low volatility?
Pretty cool, right?
This is a hidden technique on how to use ATR.
Are you sick of getting stopped out of your trades prematurely? Here’s how to fix it…
Let me ask you…
Have you ever put on a trade only to watch the market hit your stop loss, and then continue moving in your expected direction?
It sucks, right?
And that’s because your stop loss is “too tight”.
So, what’s the solution?
Give your trade room to breathe.
This means your stop loss should be wide enough to accommodate the daily swings of the market.
Now you’re probably wondering:
“But how much is wide enough?”
“How to use ATR to improve my stop loss objectively, will it actually help?”
Well, here’s how you can use the ATR indicator to help you with it…
- Find out what’s the current ATR value
- Select a multiple of the ATR value
- Add that amount to nearest Support & Resistance level
So…
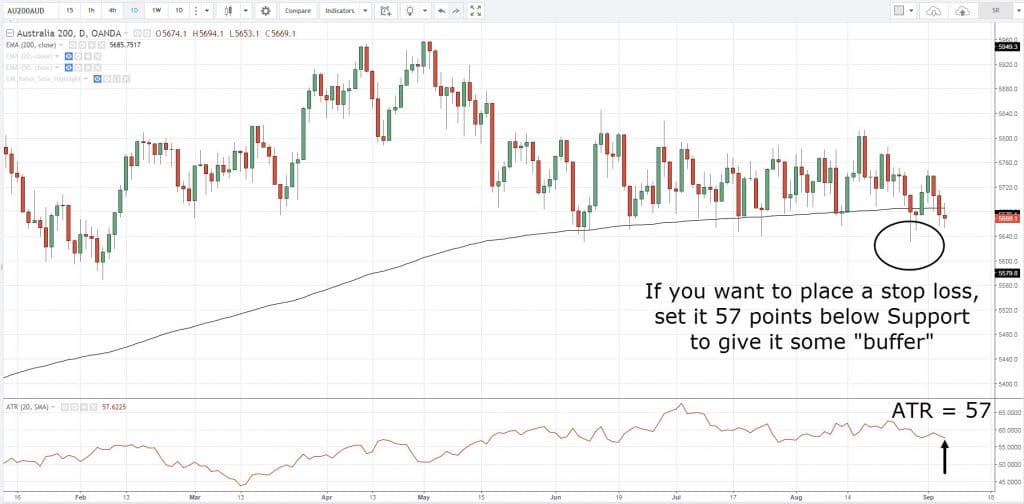
If you are long from Support and have a multiple of 1, then set your stop loss 1ATR below the lows of Support.
Or if you’re short from Resistance, and have a multiple of 2 then set your stop loss 2ATR above the highs of Resistance.
An example:
Need more explanation?
Then go watch this training video below where I’ll explain how to use the ATR indicator to set a proper stop loss – so you don’t get stopped out “too early”.
How to use the ATR indicator and ride BIG trends
Here’s the thing:
If you want to ride massive trends in the markets, you must use a trailing stop loss on your trades.
The question is… how?
There are many ways to do it, but one of the popular methods is to use the ATR indicator to trail your stop loss.
Here’s how…
- Decide on the ATR multiple you’ll use (whether it’s 3, 4, 5 and etc.)
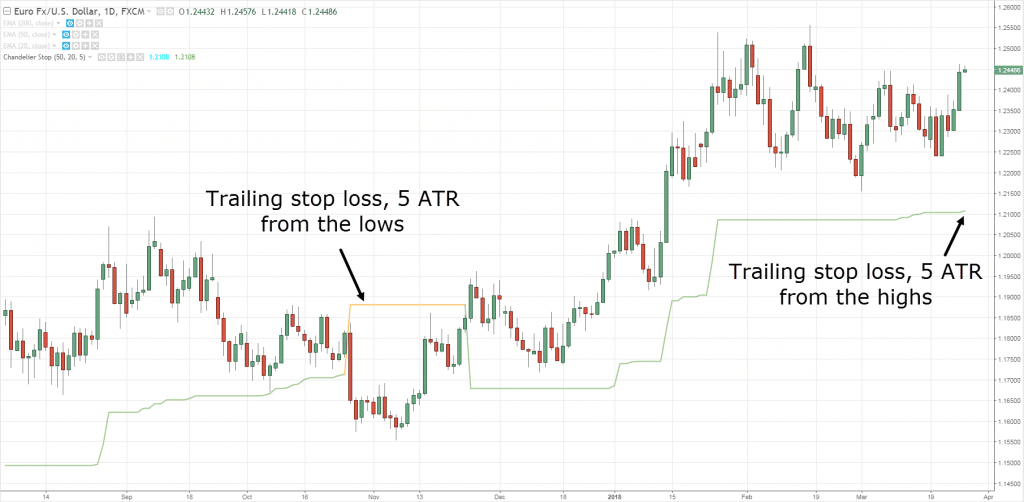
- If you’re long, then minus X ATR from the highs and that’s your trailing stop loss
- If you’re short, then add X ATR from the lows and that’s your trailing stop loss
And to make your life easier, there’s a useful indicator called “Chandelier stops” which performs this function.
Here’s an example of the 5ATR as a trailing stop loss:
Now you’re probably wondering:
“So Rayner, which is the best ATR multiple to use?”
Well, the truth is… there’s no best ATR multiple.
If you use a smaller ATR multiple, then you’ll ride a small trend (and the time held on the trade is shorter).
If you use a bigger ATR multiple, then you’ll ride a bigger trend (and the time held on the trade is longer).
So which approach suits you best?
Only you can answer that question yourself.
Moving on…
Using ATR to set profit target, here’s how it works…
Now if you don’t want to ride trends, you can also use the ATR indicator to set a target profit.
Here’s how it works…
You know the ATR indicator tells you how much a market can potentially move for the day.
So…
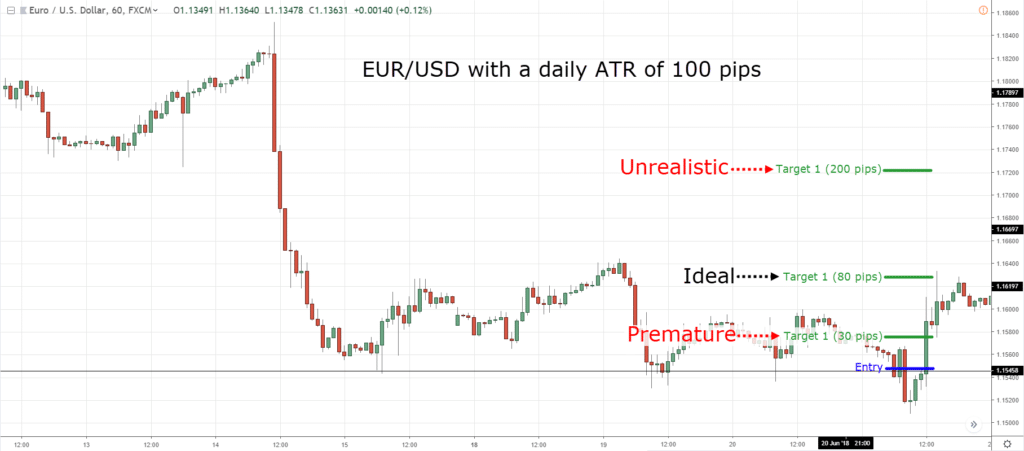
If EUR/USD has a daily ATR of 100 pips, it moves an average of 100 pips a day.
This means if you’re a day trader, you can have a target profit of about 100 pips (give and take) and there’s a good chance it’ll be hit.
Of course, you don’t want to “blindly” set a 100 pips target profit.
Instead, combine it with market structure (like Support & Resistance, swing high & low, etc.) so you know where the price might reach for the day.
Here’s an example:
Let’s say EUR/USD moves an average of 100 pips a day, again.
You went long at support and you’re not sure where to take profits.
There are 3 possible Resistance levels: 30 pips away, 80 pips away, and 200 pips away.
Which do you choose?
The 30 pips target is likely to be hit within a day but you’re leaving money on the table as the market could move 100 pips a day.
The 200 pips target is unlikely to be hit within a day (as it’s more than the ATR value).
The 80 pips target is your best option as it’s within the daily ATR value (and offers more than 30 pips).
Here’s what I mean…
Three possible targets on EUR/USD 1-hour:
- Identify the daily ATR value
- When you set your profit target, combine it with market structure and ensure the distance is less than the daily ATR value
Pro Tip:
If you trade longer-term, you can refer the weekly or monthly ATR value.
Next…
How to find “exhaustion” moves and time market reversals
I’m sure you agree nobody can work “forever” without exhaustion.
After an hour or so, most of us will need a break to recharge.
But wait.
Why am I telling you this?
Because the market is just like you, it can only “work” for so long before taking a break.
This means there’s a good probability the market will “exhaust” itself after hitting its limits.
Now you might be wondering…
“How do you tell what’s the limit?”
Well, you can find out using the Average True Range indicator.
Here’s how…
- Identify the current ATR value
- Multiply it by 2
- If the market moves 2 times the ATR value, then it could be “exhausted”
Now, I don’t suggest you trade this concept in isolation.
Instead, combine it with Support & Resistance and you’ll find yourself identifying market reversals ahead of anyone else.
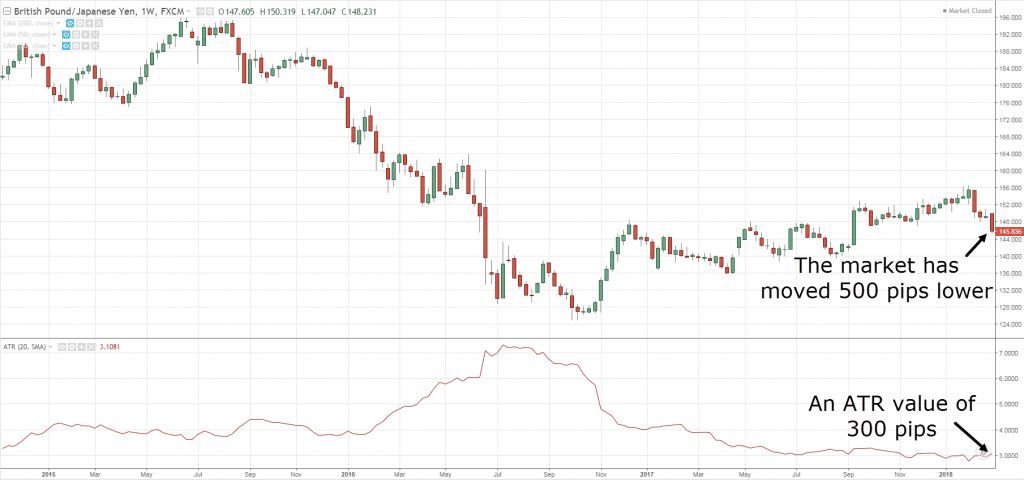
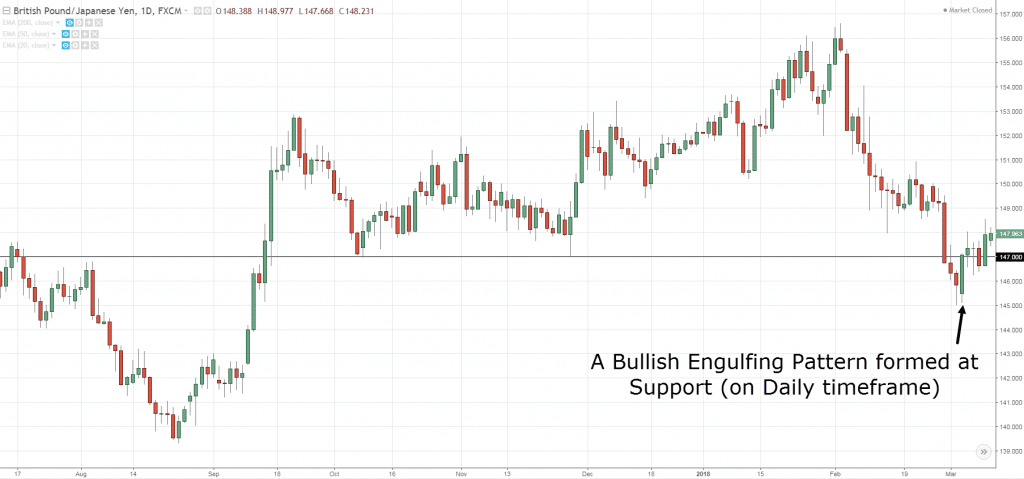
Here’s an example: GBPJPY has a weekly ATR value of 300 pips…
And now, you realized GBPJPY has moved 500 pips (close to 2ATR) and it came into an area of Support.
Then, it forms a large Bullish Engulfing pattern on the Daily timeframe.
Now… what do you think will happen?
Well, I can’t say for sure.
But you have an “exhaustion” move, the price coming into an area of Support, and a Bullish candlestick pattern that signals the market could reverse higher.
Conclusion
Here’s what you’ve learned:
- The Average True Range (ATR) is an indicator that measures the volatility of the market
- You can use the ATR indicator to identify multi-year low volatility because it can lead to explosive breakout trades
- You can set your stop loss 1 ATR away from Support & Resistance so you don’t get stopped out prematurely
- If you want to ride a trend, you can trail your stop loss X ATR away from the highs/lows
- When the market hits 2 ATR or more within a day, it tends to be “exhausted” and could reverse
Now here’s my question for you…
How do you use the Average True Range indicator?
Leave a comment below and let me know your thoughts.


Thanks for this sir Rayner, but where do i get the best ATR indicator your help plz
It’s available for free on most charting package.
Very interesting !
But what settings are you using in ATR indicator ?
On his charts it shows he is using 20 SMA
I use 20 period
Ema? Or Sma?
EMA
Thanks Rayner for this piece. Very informative. But please, some of us learn better by watching. So please could you do a YouTube video explaining how to use this ATR practically. It will be greatly appreciated. Cheers
I’ll look into it…
Your example or illustration concentrated on Year-Low or Multi-Year Low and then Weekly and Daily. I expected you should’ve given example with lower Time Frames as well or is it only more credible with the higher Time Frames? Reason, we need to know if it’s safe to apply it in Day Trading in the same way you explained here.
The concepts can be applied the same.
You are basically identifying volatility contraction.
Thanks Rayner.
pls kindly make a video, on ATR. Me and my group, do understand your video, more and more.
I’ll look into it…
Hey Rayner,
Wanna confirm one thing. In your video on stop loss placement with ATR you mentioned about 2xATR from entry price but here you mentioned 1xATR from entry price. Any reason for this difference? And which one is best to follow 1xATR or 2xATR?
Regards
There’s no best.
I’m just illustrating the concept, that’s what matters.
Hey,
Ok.. Thanks. Got your point. Thanks for the wonderful video and article.
Regards
What’s cost of book ,if so how much it,can I get it pl reply sir
Hi, Ramesh!
Jarin here from Tradingwithrayner Support team.
For Rayner’s book, you can check it here:
https://www.tradingwithrayner.com/menu-books/
When is the PATI coming out again. I was late to join.
I’ll send an email update again when it’s open.
“When the market hits 2 ATR or more within a day, it tends to be “exhausted” and could reverse”
This is a last point in your conclusion. When you say 2 ATR or more within a day what it means it’s in a day or in a candle ?
The example you given in the weekly chart is showing within a candle. Please explain.
The concept can be applied to daily weekly or monthly timeframe.
Essentially, when the market exceeds 2 times ATR value, there’s a chance it could reverse from it.
Love u sir very helpful
Always a pleasure, Tahir!
Very good information, thanks
You’re welcome, Matthew.
Hi Rayner.
Tank you . Nice article. Very Good explained clear and short.
You’re welcome!
Is there a way to scan/screen for weekly ATR on Think or Swim or Finviz? I can’t find anything to scan for ATR on ToS, and only on the daily for FinViz
Forgot to thank you for your EXCELLENT instructional videos. Your the best!
You’re welcome, Gauranga!
Not that I know of. I do my scans manually.
For exhaustion from which level we have to count
Ex.
Current ATR is 220 on x date and rate will be 1000 so how to count exhaustion value
Is it 1440 level or what
I’m not sure what your question is.
Hello Rayner, what setup do you recommend? When you insert the number, what should it be? I mean automatically it´s 14, so it is for last 14 candles, right? What do you think is the most suited number for swing/position trading?
There’s no best parameter. The concept is what matters.
For USD/THB, the ATR 14 is 0.1256, is that 12 pips?
That would be 120 pips.
Hmm USD/THB one pip is 0.01, and since ATR is 0.1256, shouldn’t it be 12 pips?
Yes, that would be correct. I’m wrong.
i use 2 ATR as my stop-loss, which is about 100-200 pips. In this case, since the ATR is only 12 pips and 2 ATR is 24 pips, should I stick to 2 ATR or increase it to 9 or 10 ATR to make it over 100 pips?
You should use the ATR based on the timeframe you’re trading.
I’m not sure what your strategy is, but for most traders 3 – 4 ATR gives enough buffer for your trade.
Hi Rayner, thanks for the post. Quick question I use yahoo finance charts, and the ATR at my entry point says 0.109 and I want to use a 4x multiplier, so that would be 0.436. And my entry price was $4.16. So then what would my stop loss be? I’m a little confused. Thanks!
If you’re using 4 ATR as your stop loss from entry, then it would be 4.16 – 0.436
Hello Mr Ray, please how do I calculate my entry Price?
This is my first time of getting more confused after reading ur material (usually, I always understand when I read ur material )my problems are how do u get to apply the ATR indicator. You only have explained how the ATR works.
What’s the confusing part?
Thanks
cheers
I really very disappointed about pro traders edge course. I purchased it last week and I didn’t find anything useful I only get one weekly chart video and not more than that all books are paid no any other help no customer service I tried to contact your team about 5 days ago and I am still waiting. Very poor . No price action training videos no breakout
Hi Muhammad
The Pro Traders Edge comes with market analysis published each week.
Also, you get access to our archive of PDF collection, Mean Reversion Trading Strategy, Trading Webinars, Backtest research lab, and much more. So, I’m puzzled if you said you only get the weekly videos.
Lastly, our customer support usually gets back to you within 1 business day and there’s a possibility your email might be in spam or didn’t reach us.
Anyway, I’ve refunded you back your money since you didn’t get value out of it.
Best!
I’m using Investagrams and I can’t seem to get the same ATR setting as you. My ATRs are in decimals. What am I doing wrong?
You might want to check with Investagrams instead.
Hi Rayner
Does it work perfectly with higher timeframe only ?
The concept can be applied across different timeframes.
Please Rayner. Explain how i can calculate the ATR daily pip value of any currency pair. Thanks
i use the daily atr also for targeting intraday levels
Thanks for sharing!
The use of ATR is another tool worth practising for successful trading.If we follow all the articles submitted I have no doubt that one can become a professional trader
Cheers
Thanks Rayner, after listening to an audiobook on Richard Dennis i have always wondered how to have volatility on a chart.
Also I learnt a satisfying method for a stop loss.
Thanks so much.
You’re welcome, Jason!
Hello Rayner,
TradingView, provided by our broker (ZERODHA), doesnt have Chandelier stops, SuperTrend is very close for considering trailing SL. Please do share your thoughts.
This info are gold. thanks.
Hey Daisy,
Cheers.
Thanks for to clear ATR concept.
Hey there,
You are most welcome!
What do we base on a bar (High, Low, Open, Close, or the buy in price) in order to minus ATR?
Its really a great lesson. I must really commend your teaching skills sir, its quite very plane.
Hi Tene,
Thank you!
MR.RAYNER YOU ARE A GREAT, AMAZING, WONDERFUL GENTLEMAN.
Hi S,
Thank you!
Hello,plz can the ATR be used without the moving averages
Hi Kingsley,
You can use the ATR without the moving average.
Cheers.
I have known more knowledge of trading strategy from your online guide and YouTube channel. Thanks .
Hi Premjit,
You are most welcome!
Cheers.
Valuable sharing, Rayner. Many thanks
Hi there Rayner, thank you for all the lessons it has helped me understand a lot about trading. What would you say are
the best levels to use on an ATR Indicator?
good presentation!
Thank you, Joanne!
Hi, thank you for everything I went through all the phases you did, and ended up to the same results you did, and I’m not kidding 🙂 (6 yrs so far)
My only question is, do you put the stoploss x Atr from the entry, or x Atr from the highest/lowest point ?
Thanks a lot.
Hey Tochukwu, you’re doing a great job answering all the comments and building meaningful engagement with people who are grateful for Rayner’s great lessons. Thank you for helping to run a great website.
Awesome, Ted!
Thank you very much.
atr, is avolatility, indicator, and it can help u find reversals, market exhaution, help u determine stops, cud use it to find right take profit area, cusd also help u trail your stops
You mentioned about not to set the stop loss “too tight” and use multiple of ATR as stop loss, example 2ATR. But what if the market go against the trade, won’t it be incurring a higher loss? I thought there are many who say not to risk a trade for more than 2-3% of capital at most? So we use the 2-3% and reverse calculated the lot size to trade base on the stop loss of 2ATR? Example if you have set a higher ATR (eg. 3~5 ATR) stop loss for a trade, what is the risk% of that trade with reference to your capital? Do you have follow a certain % of risk per trade that you stick to?
what parameters should i use. it is default set to 14,Wilders
Love the idea of ATR
But I still lost trying to understand it
Great Teacher, Keep it up and stay blessed. Peace, Shalom.
Thank you, Chris!
Thanks alot shooting stocks Rayner. I’m really growing from these Write ups. God bless your giftings.
I’m stocked at the interpretation of How ATR values are calculated. Please, I don’t really get the meaning of the different methods you highlighted.
• What do you mean by current high less the current low; and the other 2 points?
• Also you said, current candles’ range is larger than the previous, use method 1.
I will appreciate it if basic detail words are use to clearify my confusion than using professional coordinated sentences.
Thanks Mr Rayner for the quick response.
Hello Mr Rayner. I’m still waiting for your response. My second question is ; wjat is the Pip value of 1ATR?. As I was watching your lecture concerning ATR. I don’t know if I heard you clearly when you said 1ATR is 33pips. Is that true or how do I know the Pip value of 1ATR?
Also, is it applicable on all time-frames?
Hey there!
Jarin here from TradingwithRayner Support Team.
It depends on what time frame you are using. To learn more about ATR indicator here is the link:
https://www.youtube.com/watch?v=LBQIkLkU8WY
Hope that helps!
Cheers!
I usually do the same. I add the current candle with the ATR value when im long and add or minus ten points to that sum
Thank you for sharing your insights, Kaveer!
Cheers!