Let me ask you:
Have you ever waited for a pullback that NEVER comes… only to watch the market move higher without you?
It sucks, I know.
But the good news is… it’s easy to fix this problem.
How?
By trading the Bull Flag Pattern.
Now you’re probably thinking…
What’s a Bull Flag Pattern?
Where do I set my stop loss?
How do I trade it?
Where do I enter?
And etc.
Don’t worry, my young Padawan.
I’ll cover all these and more in this Bull Flag Pattern trading guide.
Here’s what you’ll learn:
- What is the meaning of a Bull Flag Pattern and how does it work
- How to trade the Bull Flag Pattern — The First Pullback
- How to trade the Bull Flag Pattern — The Trend Continuation
- How to trade the Bull Flag Pattern — The Breakout
- How to set your entries, stops, and exits when trading the Bull Flag Pattern
- Bull Flag Pattern (trading strategy guide)
Or if you prefer…
You can watch this training video below:
What is the meaning of a Bull Flag Pattern and how does it work
What is a bull flag you may ask?
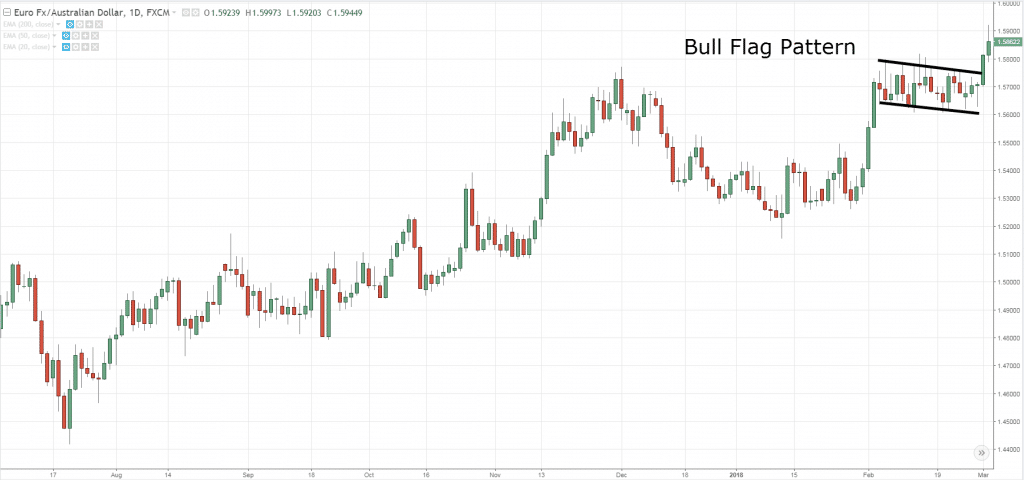
A bull flag is a continuation chart pattern that signals the market is likely to move higher.
Here’s how to spot one:
- Look for a strong trending move higher. This means the range of the candles are more bullish than usual and they tend to close near the highs.
- After the strong move higher, the market needs to take a “break”. Here’s where you can expect a potential Bull Flag to form as the market does a pullback.
- The pullback should consist of smaller range candles (compared to the earlier move). The “tighter” the range, the likely the market will breakout higher.
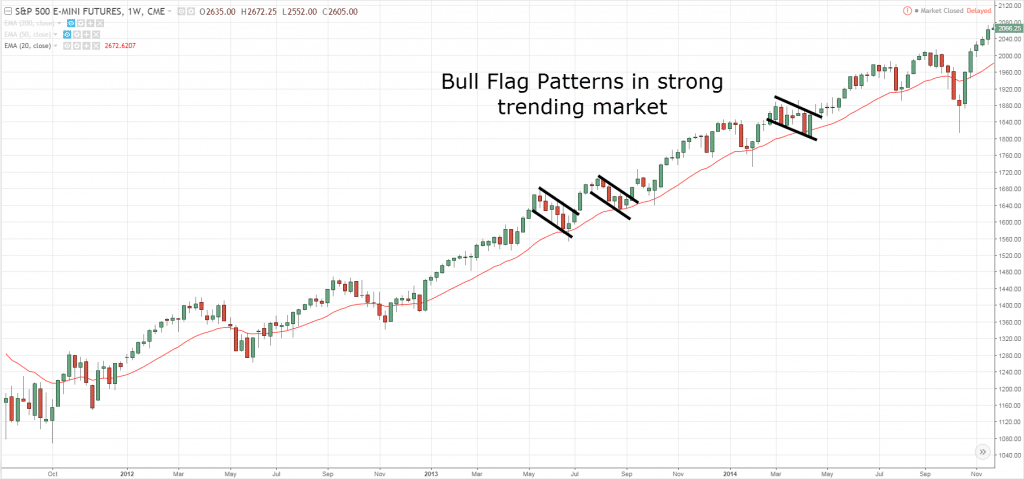
Here’s how a Bull Flag Pattern looks like…
What is a Bear Flag Pattern and how does it work
Now, a Bear Flag pattern is just the opposite of a Bull Flag Pattern.
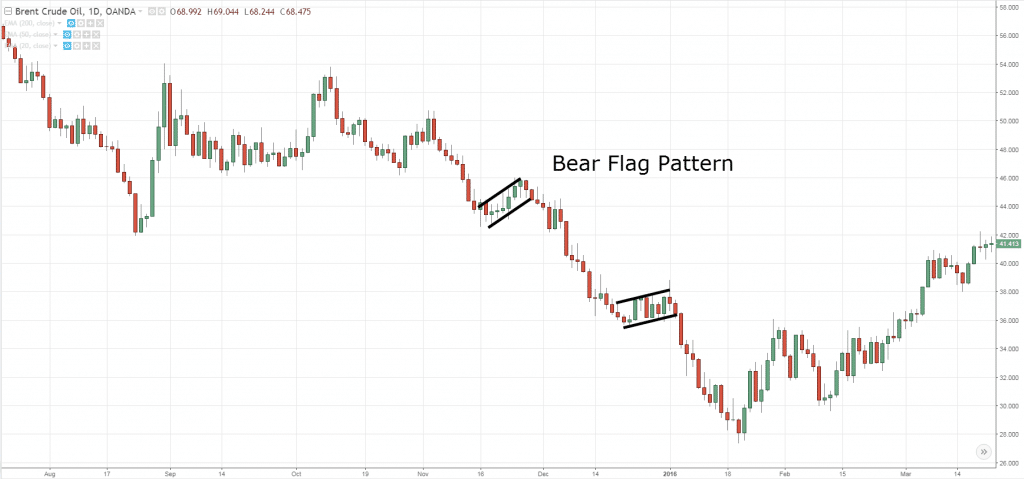
It’s a continuation chart pattern that signals the market is likely to move lower.
Here’s what to identify one:
- Look for a strong trending move lower. This means the range of the candles are more bearish than usual and they tend to close near the lows.
- After the strong move lower, the market needs to take a “break”. Here’s where you can expect a potential Bear Flag to form as the market does a pullback.
- The pullback should consist of smaller range candles (compared to the earlier move). The “tighter” the range, the likely the market will breakout lower.
Here’s how a Bear Flag Pattern looks like…
Now you’re probably thinking…
“Isn’t a Flag Pattern just a pullback in an existing trend?”
Yes, it’s a pullback. But…
The type of price action that exhibits in the pullback is what separates the Flag Pattern from a normal pullback.
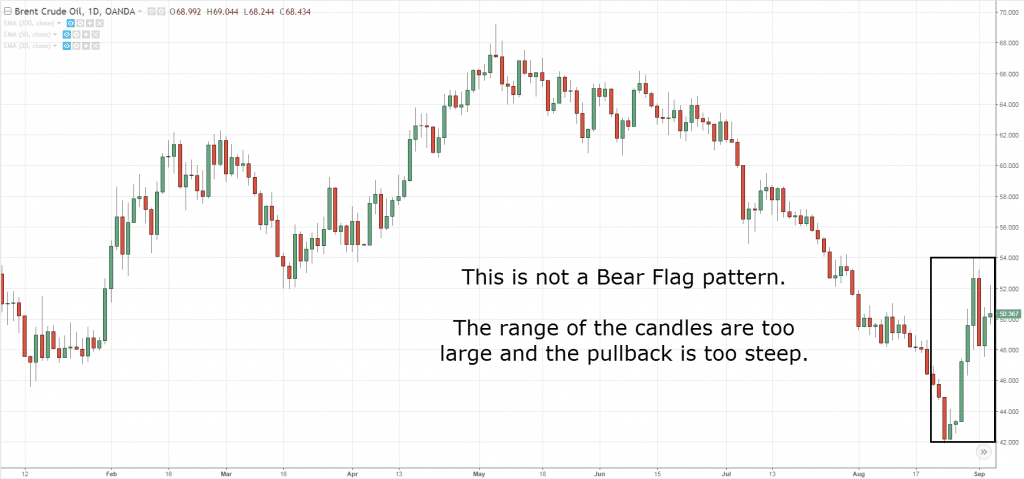
What you’re looking for is a shallow pullback that consists of smaller range candles.
So, if you see a steep pullback with large range of candles, then it’s probably not a Bull Flag Pattern.
Here’s what I mean…
Does it make sense?
Great, let’s move on…
How to trade the Bull Flag Pattern — The First Pullback
You’re probably wondering:
“What’s the heck is The First Pullback?”
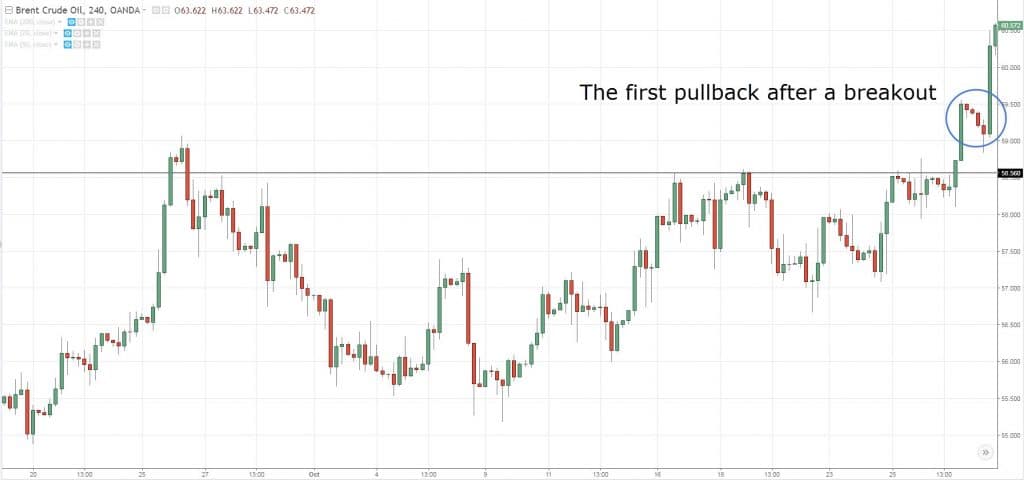
Well, it’s a term I coined when the market breaks out of a range and then does a pullback for the first time.
In my experience, the best time to trade the Bull Flag Pattern is when it occurs just after a breakout.
Why?
Because when the market is in a range, it will have to break out eventually and form a bullish flag pattern.
And the longer it range, the harder it breaks.
So… when the market finally breaks out, traders who miss the move can’t wait to enter on the first sign of a pullback.
These pullbacks usually have shallow retracement as not many traders want to trade against the strong momentum.
And this offers a high probability pullback trade.
Here’s what I mean:
Now you’re wondering:
“How do I find such high probability pullback trades?”
Simple.
Just follow this 4-step process:
- Identify a range market
- Let the market breakout
- Wait for a Bull Flag Pattern to form
- Go long on the break of the highs
Moving on…
How to trade the Bull Flag Pattern — The Trend Continuation
Let me ask you…
Have you ever looked at a chart and told yourself:
“Man! The price is too high. I’ll wait for it to retrace to Support before I go long…”
The next thing you know, the market continues to break new highs and you’re left on the sidelines.
So, what’s the lesson?
It’s this…
In a strong trending market, it’s far easier to buy breakouts than to wait for a pullback (which seldom comes).
And you can use the Bull Flag Pattern as an entry trigger.
Here’s how to do it…
- Look a strong trending market (with the price above 20MA)
- Wait for a Bull Flag Pattern to form
- Go long on the break of the highs of the bullish flag pattern
An example:
How to trade the Bull Flag Pattern — The Breakout
Here’s the thing:
Most of the time, you can expect a Flag Pattern to form after a breakout or during a strong trend.
However…
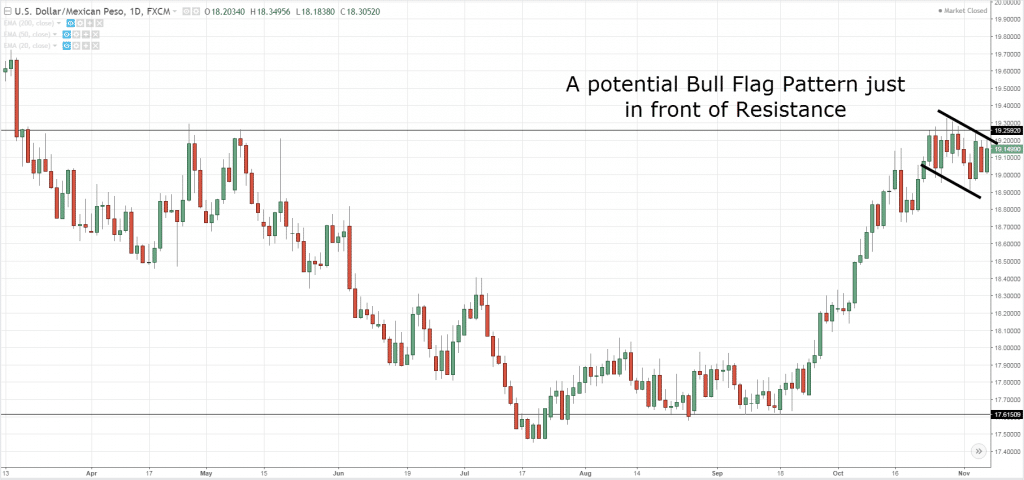
There are times a Bull Flag Pattern can form when the market is in range, at Resistance.
This happens because there are no sellers stepping in or, buyers are willing to buy at Resistance.
Whatever the case is, this is a sign of strength and the market could breakout higher.
And here’s how to spot one…
- Identify a range market
- Wait for a Flag Pattern to form at Resistance
- Trade the break of the highs
Here’s an example:
Moving on…
How to set your entries, stops, and exits when trading the Bull Flag Pattern
Now that you’ve learned what is a Bull Flag pattern and how to trade it.
Next, I want to talk about entries, stops, and exits.
First up…
How to time your entry on a Bull Flag Pattern
The entry is straightforward.
You can either enter on the break of the highs or wait for the market to close above the highs.
Now you’re probably wondering:
“But which is better?”
Well, there’s no best approach.
If you enter on the break of the highs, it could be a false breakout. But, if it’s a real breakout, it’s the best possible price you can get.
Alternatively…
If you wait for a close above the highs, you reduce the chance of a false breakout. But, if the breakout is strong, you end up entering at a much higher price.
So:
Whichever approach you use, the key thing is — be consistent with it.
Next…
How to set your stop loss when trading the Bull Flag Pattern
Here’s the deal:
You don’t want to set your stop loss at obvious levels like Support & Resistance, swing high & lows, and etc.
Why?
Because you get stop hunted easily.
But don’t take my word for it.
Just look through your past trades and notice how often you got stopped out only to watch the market do a complete reversal.
So, what’s the solution?
Simple.
Give your trade more room to breathe by setting your stops a distance away from the market structure.
And this principle can be applied even when trading the Bull Flag Pattern.
Here’s how…
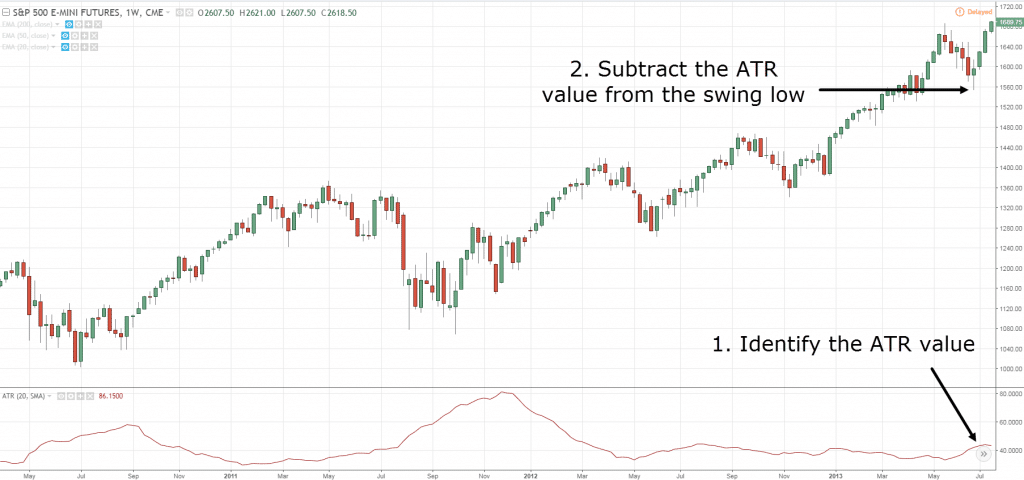
- Identify the swing low of the Bull Flag Pattern
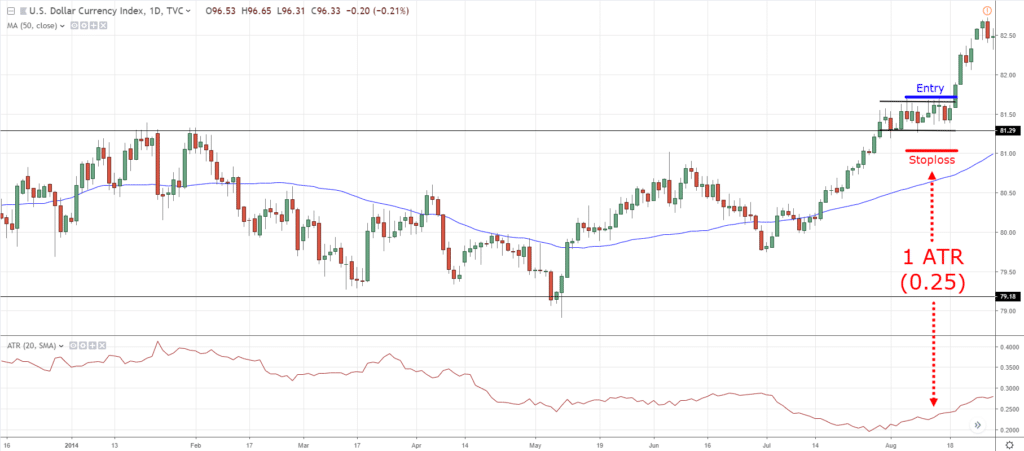
- Set your stop loss 1 ATR below the low
- And vice versa for Bear Flag Pattern
An example:
Do you need further explanation?
Then go watch this training video below on how to use the ATR indicator and set a proper stop loss…
Onward…
How to exit your winners when trading the Bull Flag Pattern
Now there are many ways you can exit your winners.
One of them is to have a pre-determined profit target based on length of flag pole.
Let’s say the flag pole is X pips in length.
Then your projected profit target should be roughly X pips away.
Here’s how it looks like:
However, I prefer to trail my stop loss until the market takes me out of the trade.
Why?
Because think about this…
The Bull Flag Pattern usually appears in a strong trending market, or just after it breaks out of a range.
In such market conditions, there is a lot of “meat” for the trend to continue and the only way to ride it is to trail your stop loss.
Now the question is… how?
Well, it’s easy.
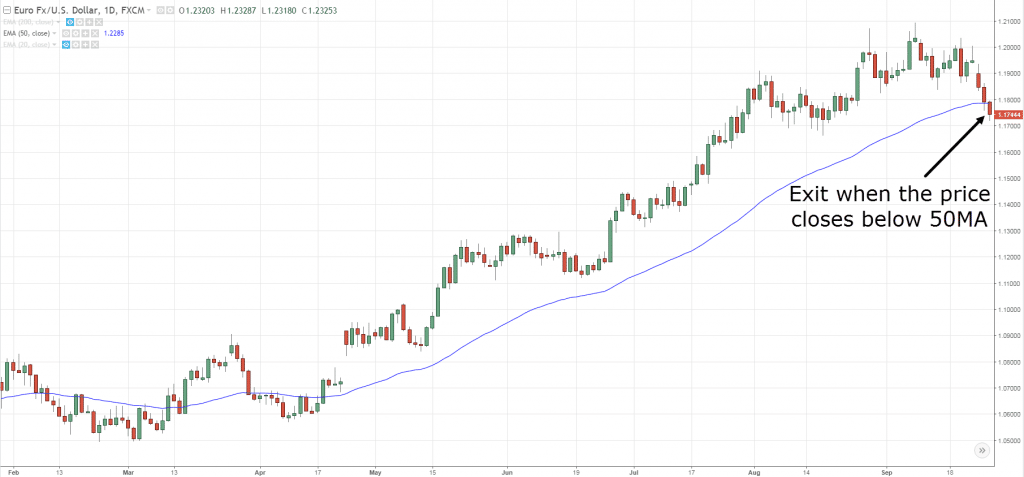
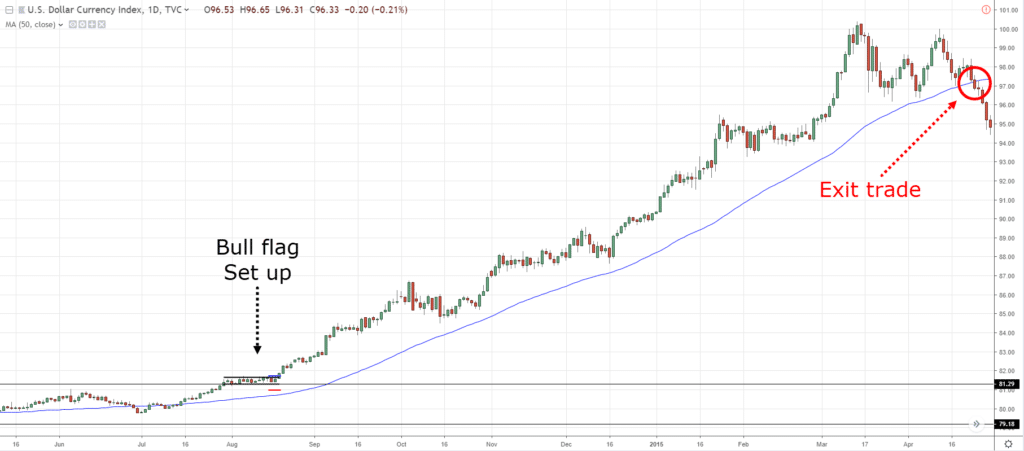
You can use a tool like the 50-period moving average to trail your stop loss and only exit the trade if the market closes beyond it.
An example:
Of course, there are numerous to trail your stop loss.
You can use a shorter-term moving average, longer-term moving average, trend line, market structure, and etc.
If you want to learn how else you can do it, then go read this post… How to Set Your Stop Loss to Protect Your Profits and Ride Big Trends
Bull Flag Pattern (trading strategy guide)
Now…
Let’s take what you’ve learned and develop a Bull Flag trading strategy.
Here’s a template you can use…
If the price breaks out of a range, then wait for a Bull Flag Pattern to form.
If a Bull Flag Pattern is formed, then place a buy stop order above the swing high.
If the price breaks above the swing high, go long with stop loss 1 ATR below the low of the Bull Flag.
If the price moves in your favor, then trail your stop loss with the 50-period Moving Average.
An example…
A winning Bull Flag trading strategy on USDX Daily:
Trailing stop exit on USDX Daily:
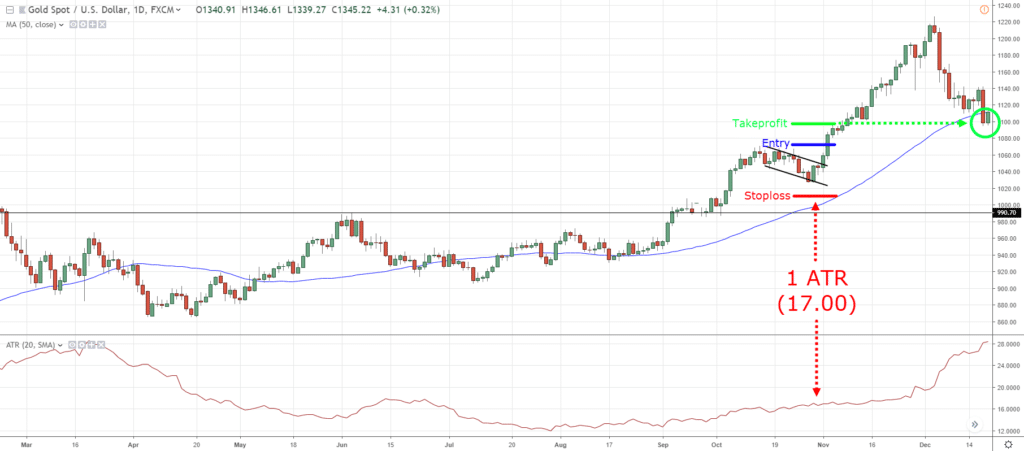
A winning Bull Flag trading strategy on XAU/USD Daily:
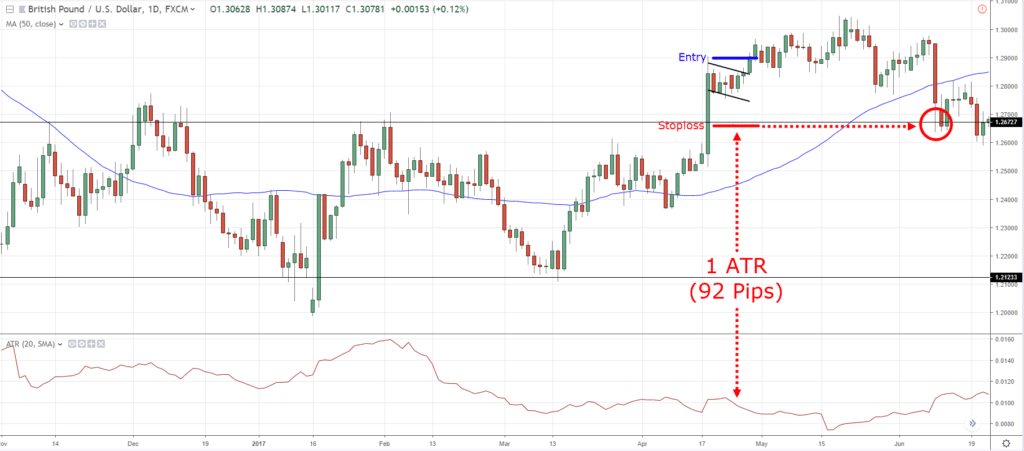
A losing Bull Flag trading strategy on GBP/USD Daily:
Now, there are many ways to tweak this Bull Flag trading strategy to your needs.
For example, you can:
- Have a fixed target profit
- Trade Bull Flag in a trending market
- Trail your stop loss with 20-period Moving Average
- Etc.
Ultimately, you must test and verify the approach that suits you best.
Frequently asked questions
#1: If the price is below the moving average, but there’s a bull flag pattern formed, should I still follow the bull flag pattern and go long?
It depends. Generally, if the market is in a downtrend on the higher timeframe, you want to avoid going long on bull flag pattern because the probability of it working out is less than when the market is in an uptrend.
So in a downtrend, I’ll choose to skip the trade even if there’s a bull flag pattern formed.
#2: Does the bull flag pattern trading strategy work better in some markets than the other?
Yes, the bull flag pattern tends to work better in trending markets.
If you want to discover whether the market is a trending or a mean-reverting market, you can check out the first section of this article.
Conclusion
So, here’s what you’ve learned:
- The Bull Flag Pattern is a bullish continuation chart pattern
- The best times to trade the Bull Flag Pattern is just after the market break out, during a strong trending market, or when it’s near Support/Resistance
- You can enter your trade with a buy stop order above the highs, or wait for a close above the highs
- You can consider setting your stop loss 1 ATR below the low of the Flag so your trade has more room to breath
- If the market moves in your favor, you can trail your stop loss (with a moving average) and ride big trends
Now let me ask you…
How do you trade the Bull Flag Pattern?
Leave a comment below and share your thoughts with me.



Thank you so much my friend.
If someday I will be a successful trader with the use of all your teaching.
I will be much thankful and grateful.
I will remember you forever
You’re welcome!
Great article Rayner, I have a question if there is a Bear Flag pattern form, but the 200 MA is below does the Bear Flag pattern take priority to take the trade, or the 200 MA
The reason I ask the question is I saw this pattern earlier with the M6A on the 4 Hr. chart in the week and didn’t take the trade looking at the 200 MA.
Thank You
Bill Latham
Hey Bill
I’m not quite sure what you mean.
Do you mean if the price is above 200MA and there’s a bear flag pattern?
The 200 MA is below the Bear Flag pattern.
It depends on the experienced of a trader.
If it’s a bullish price action but the price is below 200ma, you can still go long.
But if in doubt, stay out.
Thanks, it is your teachings that encourage me, and as well as building my confidence in trading. Thanks.
Welcome Baah!
Great info about letting profits ride with a trailing stop
Thanks Jack!
Thanks Rayner! But I still don’t get one thing- how do you use ATR on the 15min chart?
The concept is the same.
Identify the value on 15mins timeframe and use that value whatever purpose you want.
Thanks so much Ray. I take a lot of inspiration from you all the time.
I want to ask if you trade stock too?
If yes, can you please stress on canning of best stocks
I don’t, at least not for now.
thanks rey… our tips are qyt easy to understand!. great
cheers Don
Ray,I m impressed by ds tutorial materials of yours.
I really appreciate.
Thank you, Dammy.
[…] it’ll form a Bull Flag chart pattern (which is another setup you can […]
Great effort Rayner, really appreciate. Was very helpful for me as a beginner, will come back with doubts if any after some back testing. Thankyou.
You’re welcome, Ritesh!
Hello sir, Forex Trading have Fundamental Analysis and Technical Analysis it’s important for all trader but i want to know if long term trad H4, D1, W1and month. Which one we must focus on ?
Thanks Rayner.Im in singapore will meet you soon.
I love this strategy. You have given a thorough treatment to this strategy in this article clarifying all aspects leaving no room for doubt. Thanks!
My pleasure!
Awesome Sir
Cheers
THANK YOU MAN, such a good content either here or on Youtube, great great job!!
You are welcome, Flo!
my friend is it break of the highs of the reversal candle or the highs of the whole bull flag pattern? thanks. hope you read this
hi i am a new learner but i do invest in stock since long. i want to know on which min / hr chart we need to check the flag pattern or any signals
Hi Mamta,
Rayner trades on the 4H/Daily/Weekly/Monthly TF.
I hope that helps.
Cheers.
[…] Tip: This is known as Bull Flag chart pattern (and the inverse is Bear […]
I’ve now just learnt the bull flag trading guide and I’ll share my experience after practicing it. Dang! I have missed out big time trading opportunities for not knowing it earlier. Thanks, my friend! You’ve been more than a teacher to us.
Hey there, Mohammed!
Jarin here from TradingwithRayner Support Team.
You are most welcome. Keep on practicing, There are a lot of opportunities in the market.
We wish you the best in trading.
Cheers!
Good day Rayner,
I’ve really learnt much in a short while from your teachings. My question is in using the ATR for setting stop losses, can I set the period to 50 instead of 14?
Hi, Austin!
For more info about ATR indicator, you can check it here:
https://www.tradingwithrayner.com/atr-indicator/
Cheers!