The Inverse Head and Shoulders pattern is a chart pattern that has fooled many traders (I’ll explain why shortly).
However, if traded correctly, it allows you to identify high probability breakout trades, catch the start of a new trend, and even “predict” market bottoms ahead of time.
Want to learn more on how to trade Inverse Head and Shoulders pattern?
Then read on…
What is an Inverse Head and Shoulders pattern?
The Inverse Head and Shoulders (also known as Reverse Head and Shoulders) is a bullish chart pattern that signals the buyers are in control.
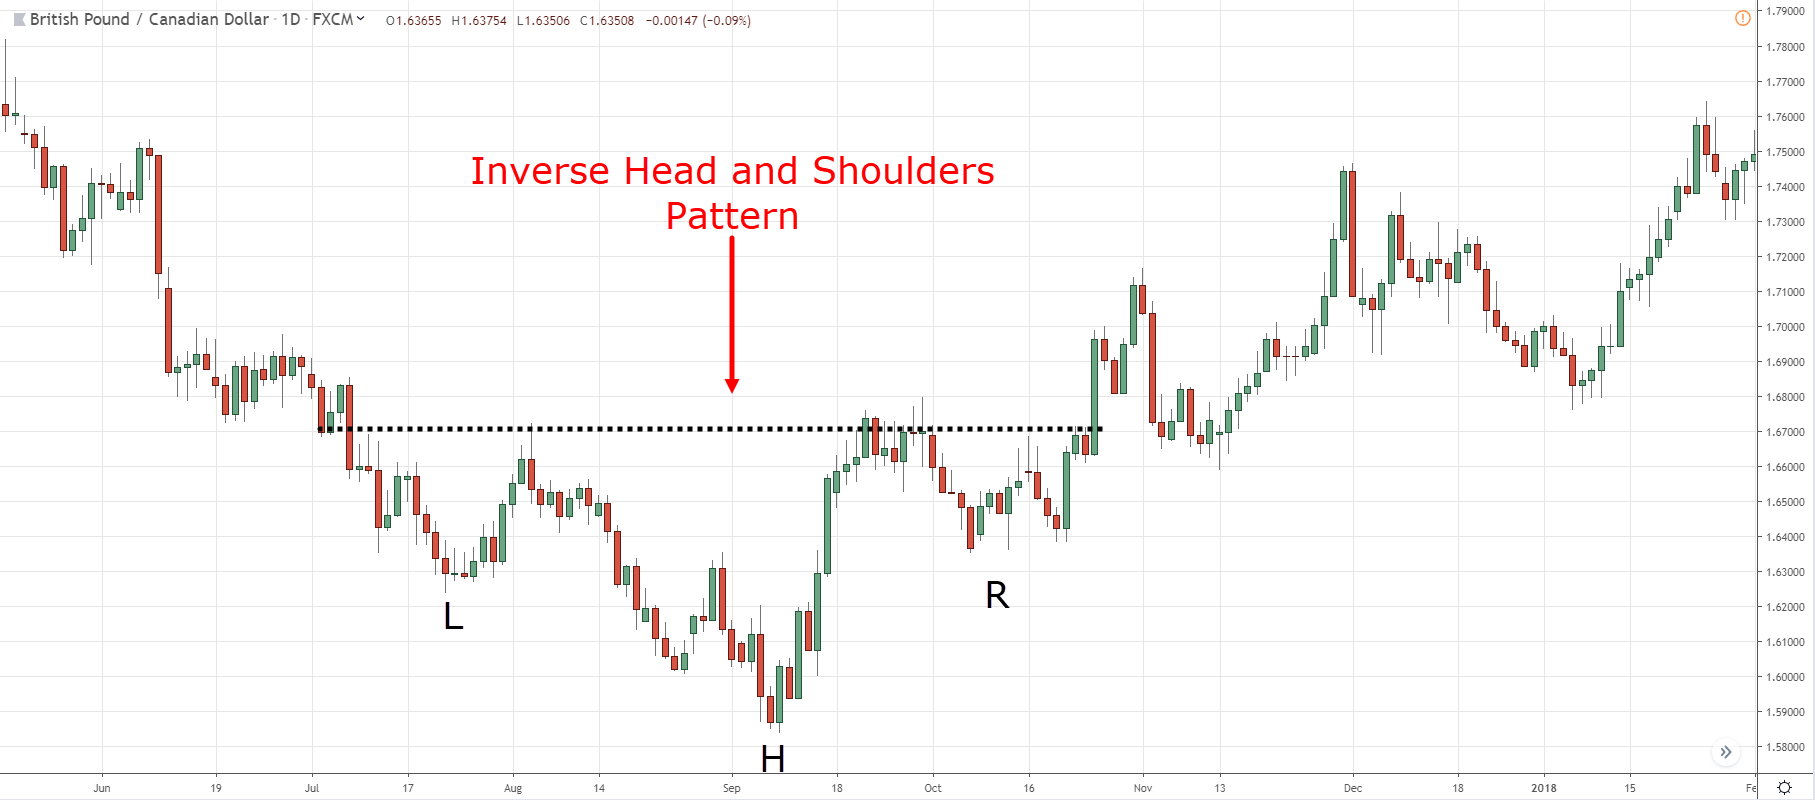
Here’s how it looks like…
Now, let’s find out what the Inverse Head and Shoulders pattern really means…
Left Shoulder – This is a pullback against the downtrend because of profit taking or eager buyers stepping into the market.
Head – The sellers are still in control as they push the price lower. However, buyers are also stepping in, which explains the “stronger” pullback to re-test the previous swing high.
Right Shoulder – The sellers are getting weak as they couldn’t push the price lower. Instead, the buyers are getting stronger as they continue to push the price higher, re-testing the Resistance area (the previous swing high).
And if the price breaks above Resistance, the Inverse Head and Shoulders pattern is “confirmed”, and the market could continue higher.
Now…
You might be thinking:
“Okay that’s easy! I’ll buy when the price breaks out of the Inverse Head and Shoulders, and BOOM, profits!”
Well not so fast, my young padawan.
Here’s why…
Don’t make this common mistake when trading the Inverse Head and Shoulders pattern
Here’s the thing:
The duration of the Inverse Head and Shoulders pattern, matters.
The longer the Inverted Head and Shoulders pattern takes to form, the more significant it is.
This means the shorter the duration of the Inverse Head and Shoulders pattern, the more likely it’ll fail — especially when you’re trading it against the trend.
(Like having a train rushing at 300km/h against a Toyota moving at 50km/h, who will win?)
Here’s an example…
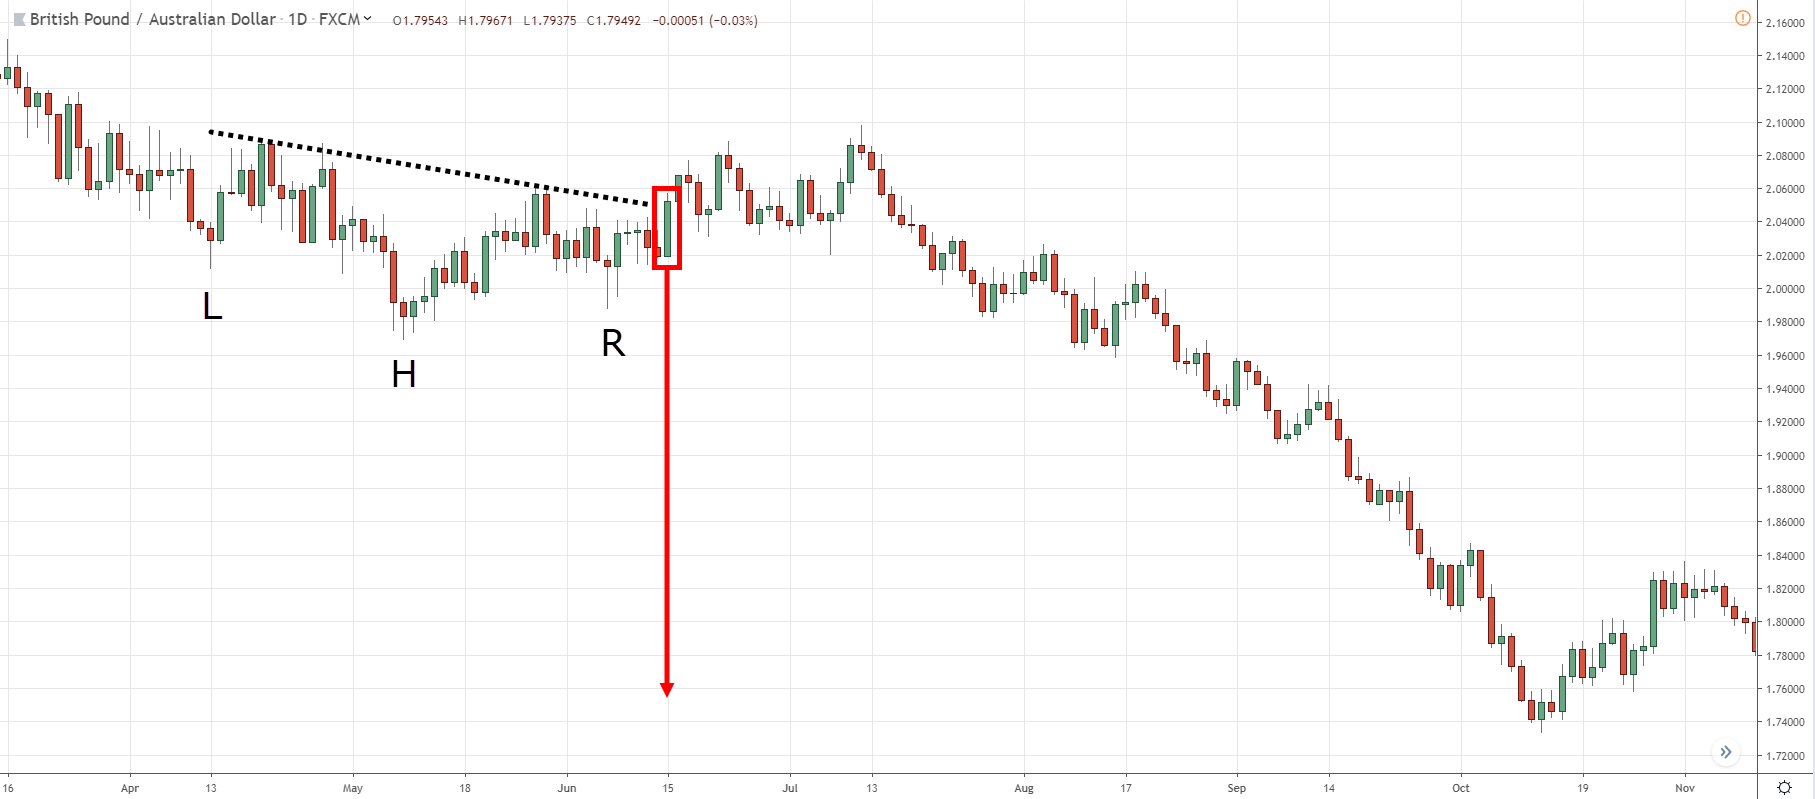
“Small” Inverse Head and Shoulders pattern in a downtrend:
As you can see, the market has been trending lower over the last 12 months and then an Inverse Head and Shoulders pattern formed over the last few weeks.
Now let me ask you…
Would the 12-months trend prevail or the Inverse Head and Shoulders pattern?
So, when do you trade the Inverse Head and Shoulders pattern?
Here’s the thing:
You can have two identical Inverse Head and Shoulders pattern, but one has a higher probability of success.
Why?
Because when you trade the Inverted Head and Shoulders pattern is as important (if not more important) than the pattern itself.
So, here are three scenarios where you want to trade the Inverse Head and Shoulders pattern:
- When the market is in an uptrend
- When the pattern leans against the higher timeframe structure
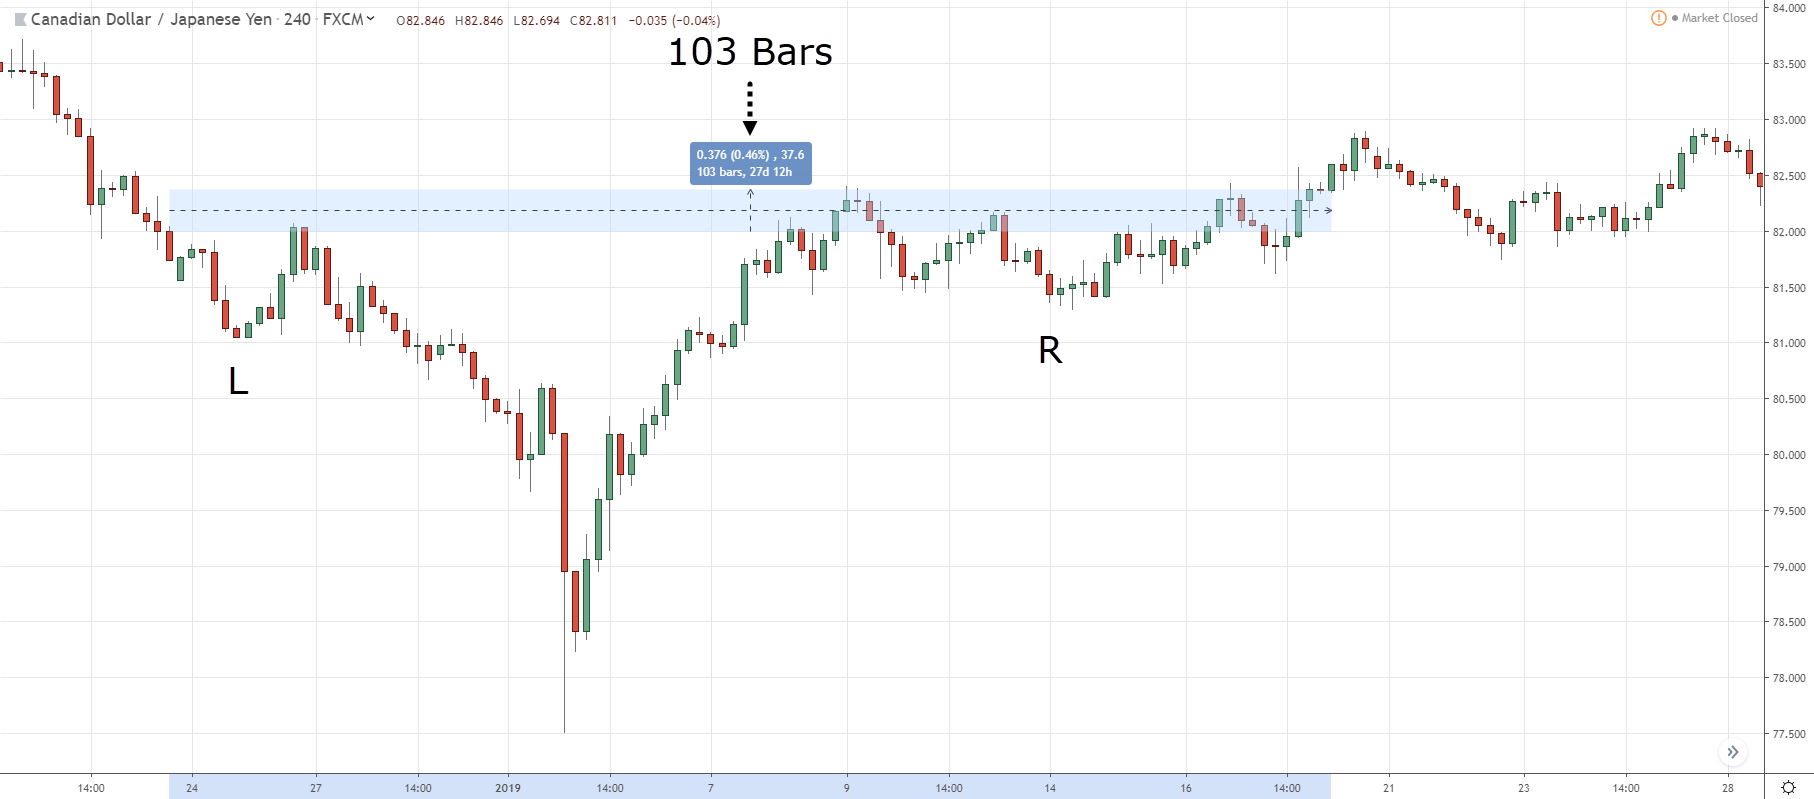
- When the pattern takes more than 100 bars to form
Let me explain…
When the market is in an uptrend
As you know:
The Inverse Head and Shoulders pattern is a bullish chart pattern.
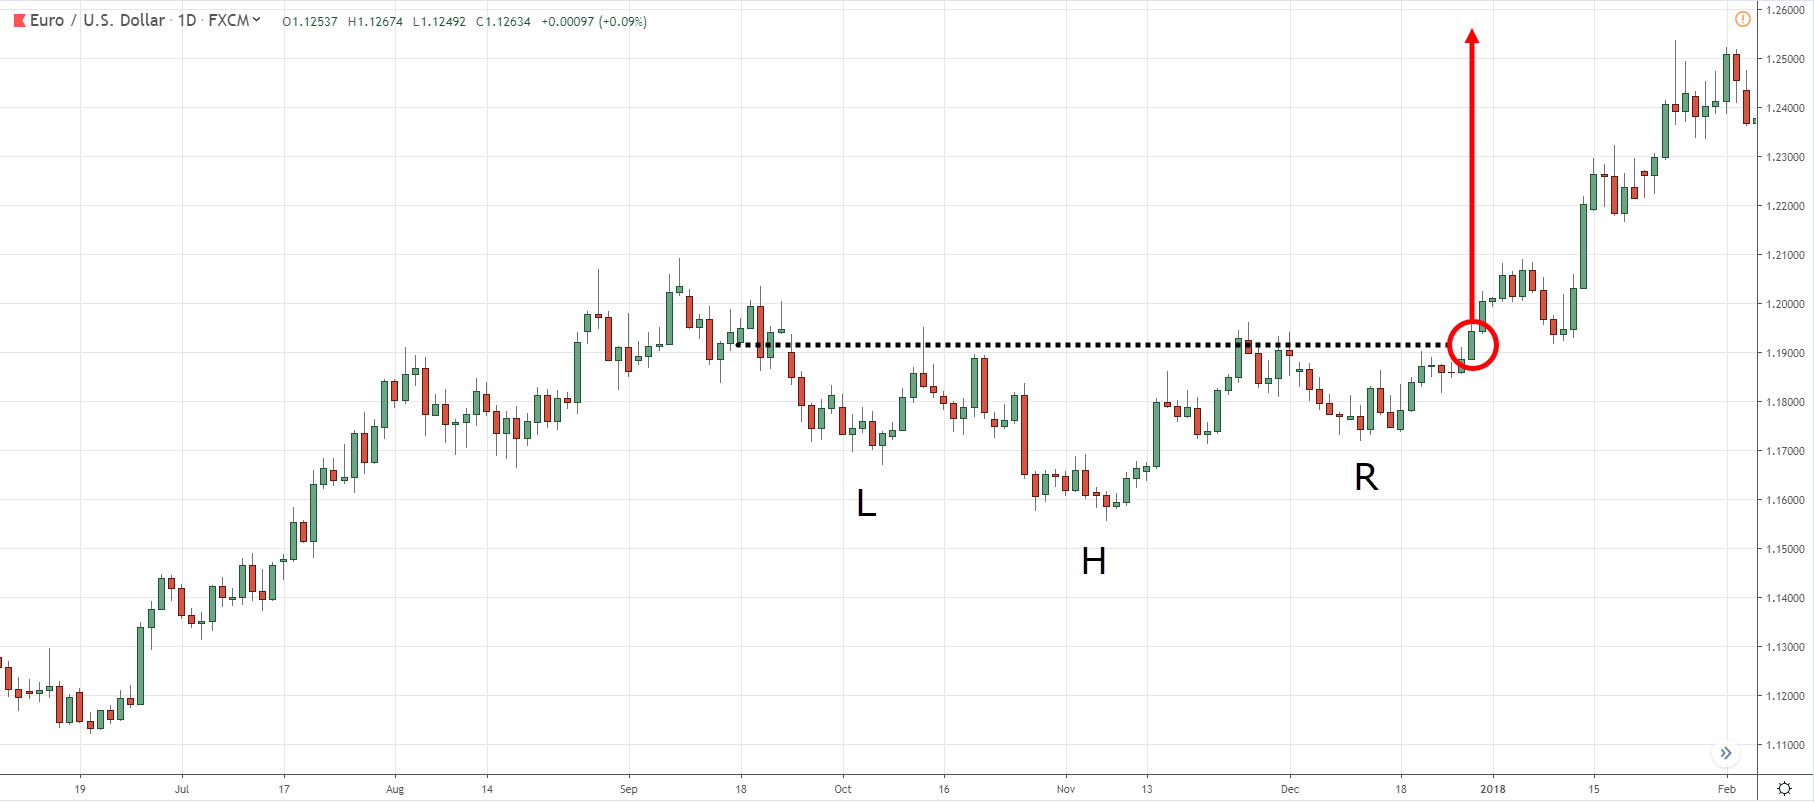
And when you trade the Inverse Head and Shoulders Pattern in an uptrend, BOOM, you’ve just increased your odds of winning.
Here’s an example…
When the pattern leans against the higher timeframe structure
On its own, the Inverse Head and Shoulders pattern isn’t significant.
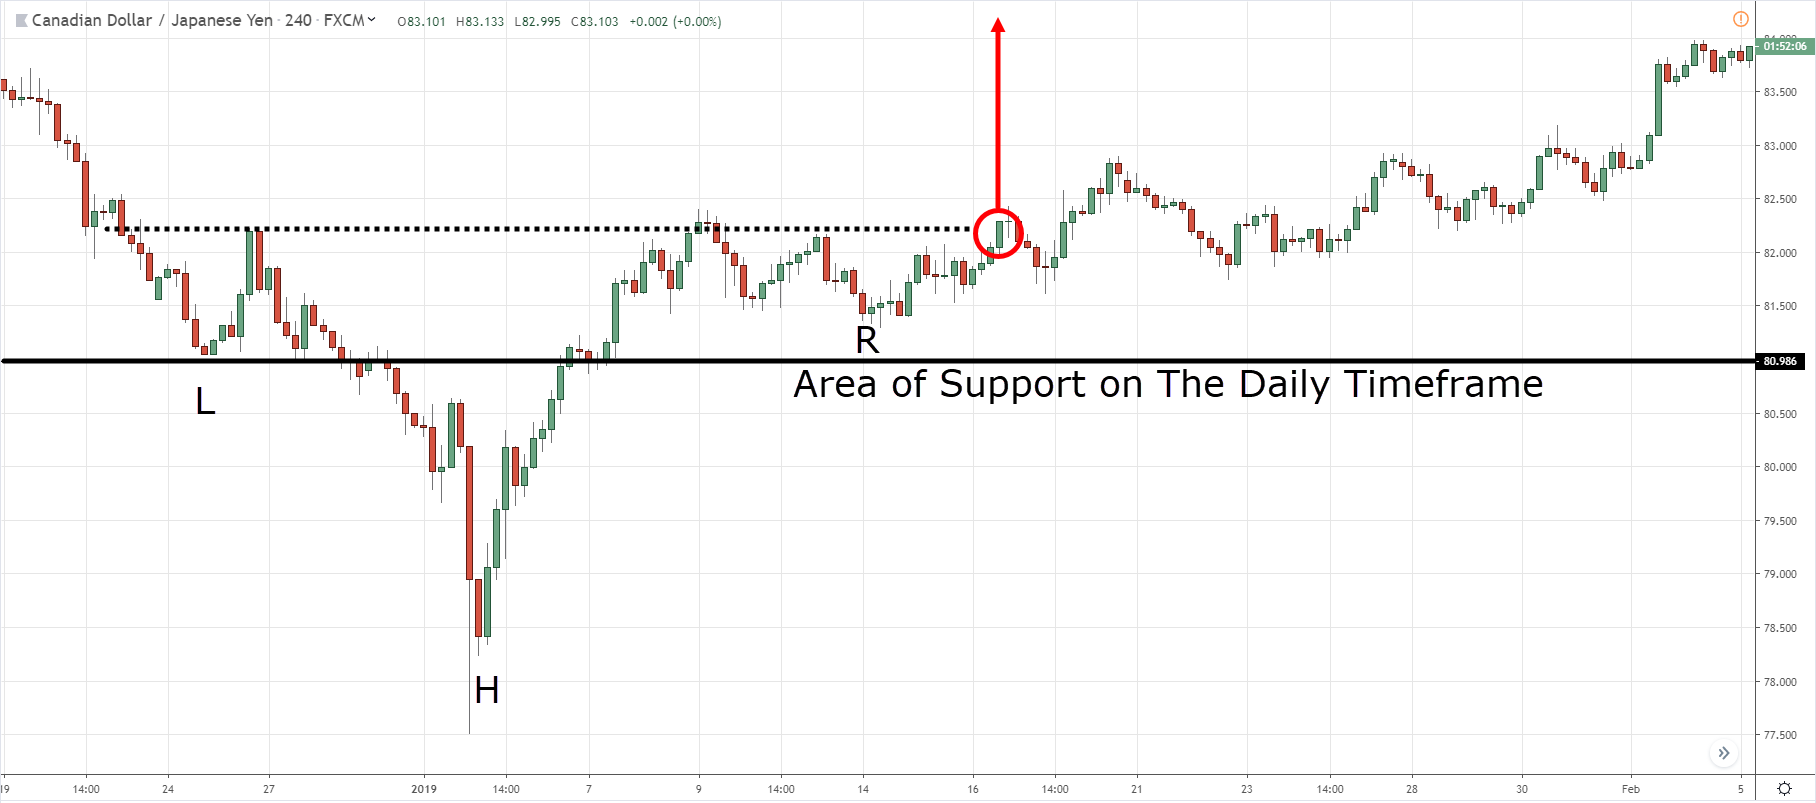
But, if it leans against a higher timeframe structure (like Support and Resistance), it can be a powerful chart pattern to trade.
Here’s what I mean…
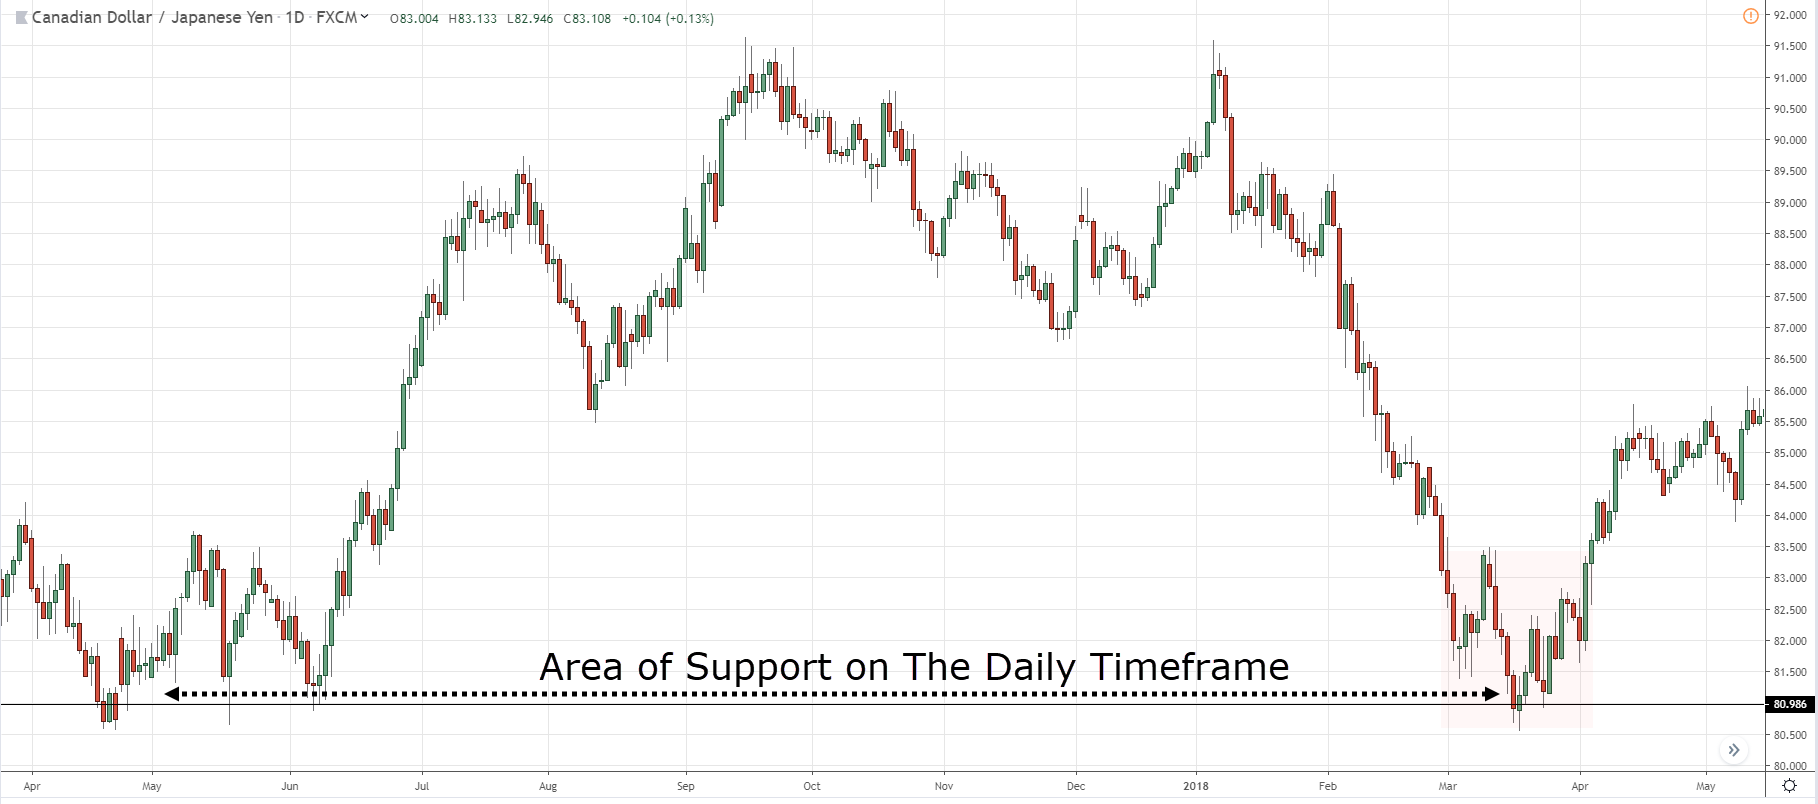
The price is at Support on the Daily timeframe:
An Inverse Head and Shoulders pattern on the 2-hour timeframe — leaning against the Daily timeframe Support:
When the pattern takes more than 100 bars to form
Recall:
A “small” Inverse Head and Shoulders pattern is likely to lose against a strong downtrend.
So if you want to trade the market reversal, give the chart pattern at least 100 bars to form.
Because as time passes, more buy stop orders would accumulate above the highs of the Neckline (from short sellers).
And if the price breaks above it, there’s “fuel” to push the price higher.
This marks the end of a downtrend and the start of a new uptrend.
An example:
Inverse Head & Shoulders pattern with more than 100 bars:
At this point:
You’ve learned when to trade the Inverse Head and Shoulders pattern.
And in the next section, you’ll discover how to time your entries when trading this Inverted Head and Shoulders chart pattern.
Read on…
Inverse Head and Shoulders: The Breakout with a buildup
Here’s the deal:
Not all Inverse Head and Shoulders patterns are created equal.
Because how the “right shoulder” forms is a key criterion to whether you want to trade the breakout, or not.
For example:
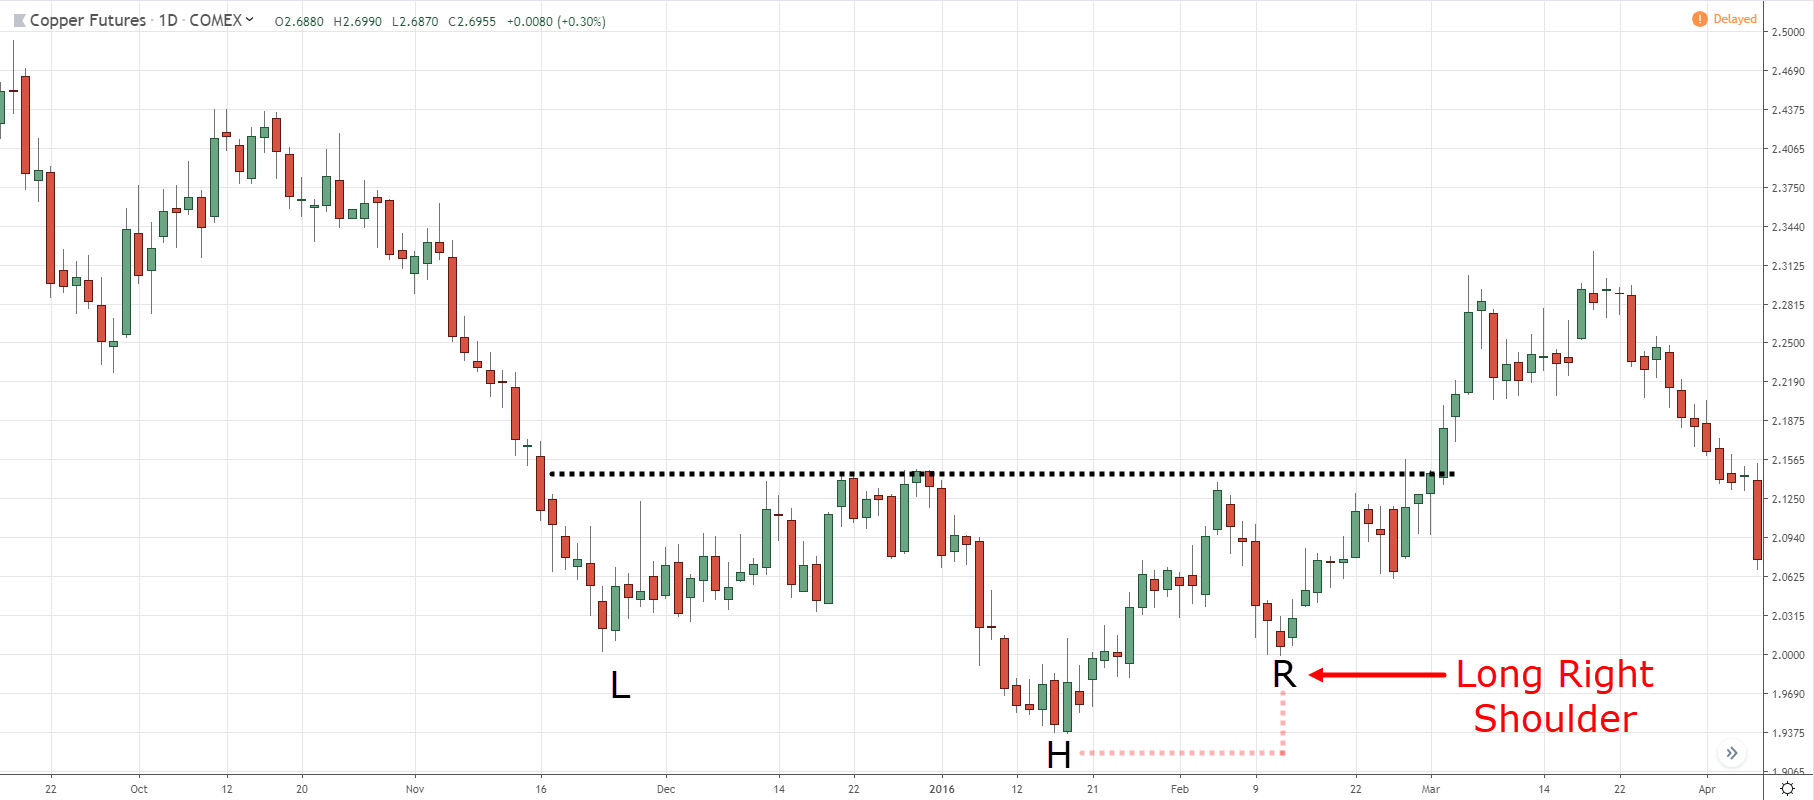
If you have an Inverse Head and Shoulders pattern that has a “long right shoulder”, then you want to avoid buying the breakout.
Why?
Because the price has moved a long distance from the lows of the “right shoulder” to Resistance area (and this attracts buyers along the way).
So the market is likely to face selling pressure from profit taking (from buyers) — and traders who want to sell at Resistance.
This creates strong selling pressure which leads to a price decline.
So…
A better approach is to trade breakouts with buildup.
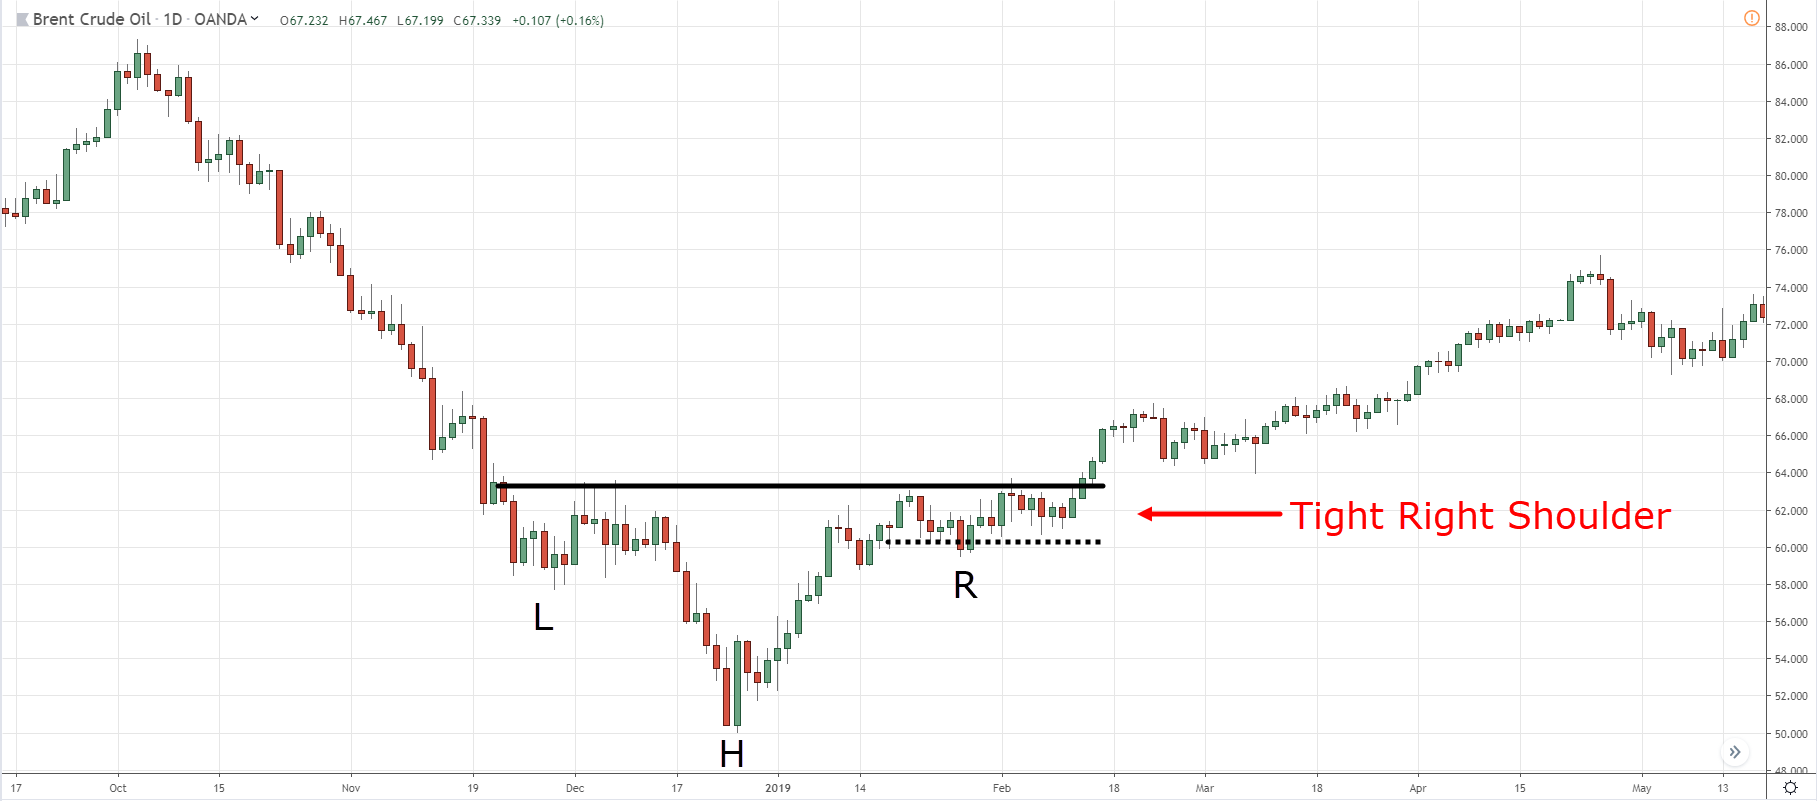
This means you want the Inverse Head and Shoulders pattern to have a “tight right shoulder”.
Here’s an example:
Here’s why…
When you see a buildup at Resistance, it tells you there’s buying pressure willing to buy at higher prices (despite profit taking and short selling).
Also, traders who short likely have their stop loss above Resistance.
So, when the price breaks out of Resistance, the cluster of stop loss will provide the “fuel” to push the price higher.
Plus, your stop loss can go below the lows of the buildup which offers a favourable risk to reward (compared to the lows of a “long right shoulder”).
Now you might be thinking…
“But what if I miss the breakout trade?”
I agree.
You won’t catch every breakout that comes your way.
Perhaps:
The market moved too fast too soon.
You weren’t paying attention to the price.
The market just took off without forming any buildup.
So, what now?
Well, all is not lost because you’re about to learn an entry technique to handle such situations.
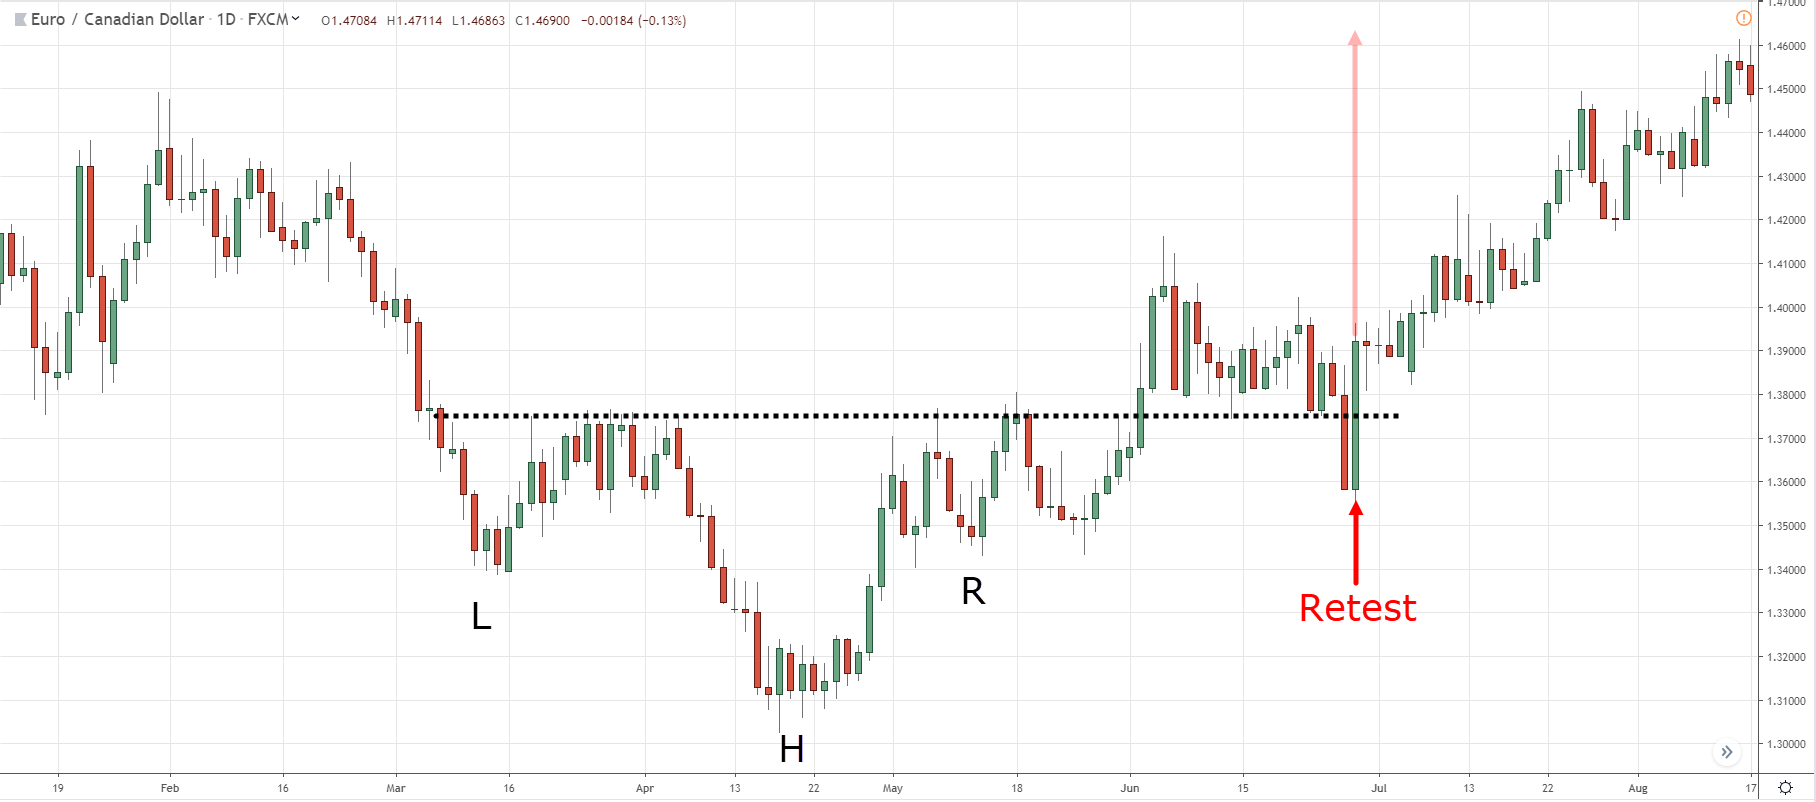
I call it The-Retest.
Here’s how it works…
- If the price makes a sudden breakout, wait for a re-test at previous Resistance turned Support
- If the price re-tests the area, wait for a bullish reversal pattern to time your entry (it can be a Hammer, Bullish Engulfing pattern, etc.)
- If there’s an entry trigger, then have your stop loss 1 ATR below Support
An example:
Now…
There’s no guarantee the price will re-test the level you want (especially in a strong uptrend).
So, that’s where this entry technique comes into play…
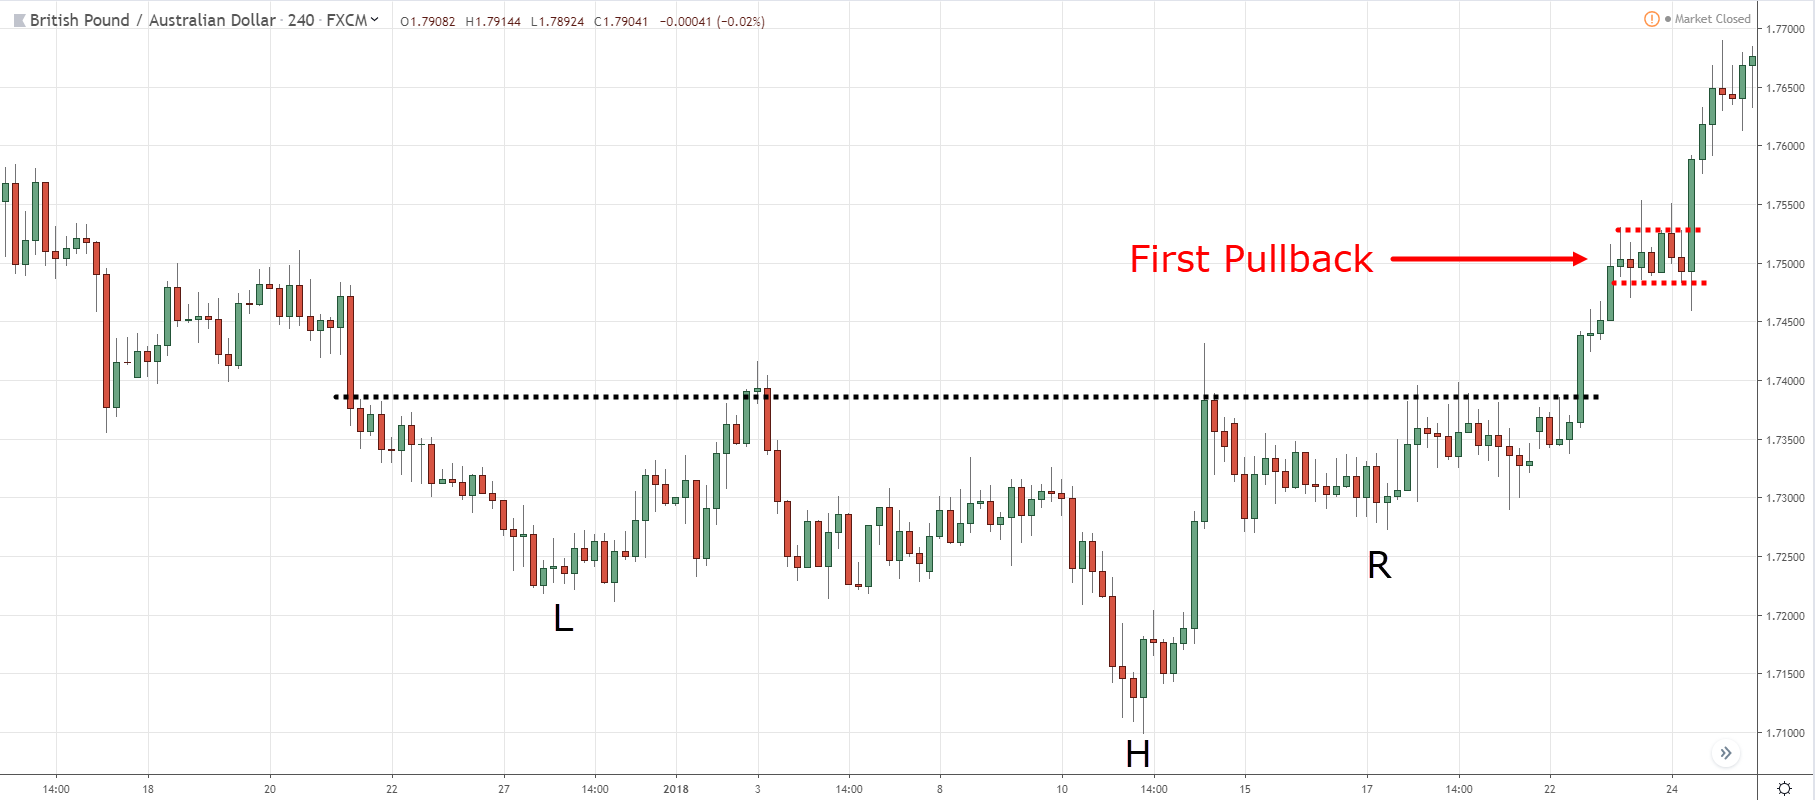
Inverse Head and Shoulders Pattern: The First Pullback
This is called The First Pullback because the first pullback after a breakout is the best ones to trade.
Because traders who miss the “earlier” move are eager to hop on the trend due to the fear of missing out.
So, buying pressure is likely to resume when the price breaks out of new highs and buying pressure is renewed.
And here’s how you can take advantage of it…
- If you miss the breakout, don’t “chase” the markets. Instead, let the price make a pullback
- Ideally, the pullback is shallow with small range candles (usually not exceeding the 20MA)
- If there’s a pullback, go long on the break of swing highs with stop loss 1 ATR below the swing low
Here’s what I mean…
Does it make sense?
Great!
Now you have 3 powerful techniques to trade the Inverse Head and Shoulders pattern.
So now the question is…
How do you exit your winning trades?
Now, there are two ways to exit your winning trades…
- Price projection
- Trailing stop loss
I’ll explain…
Price projection
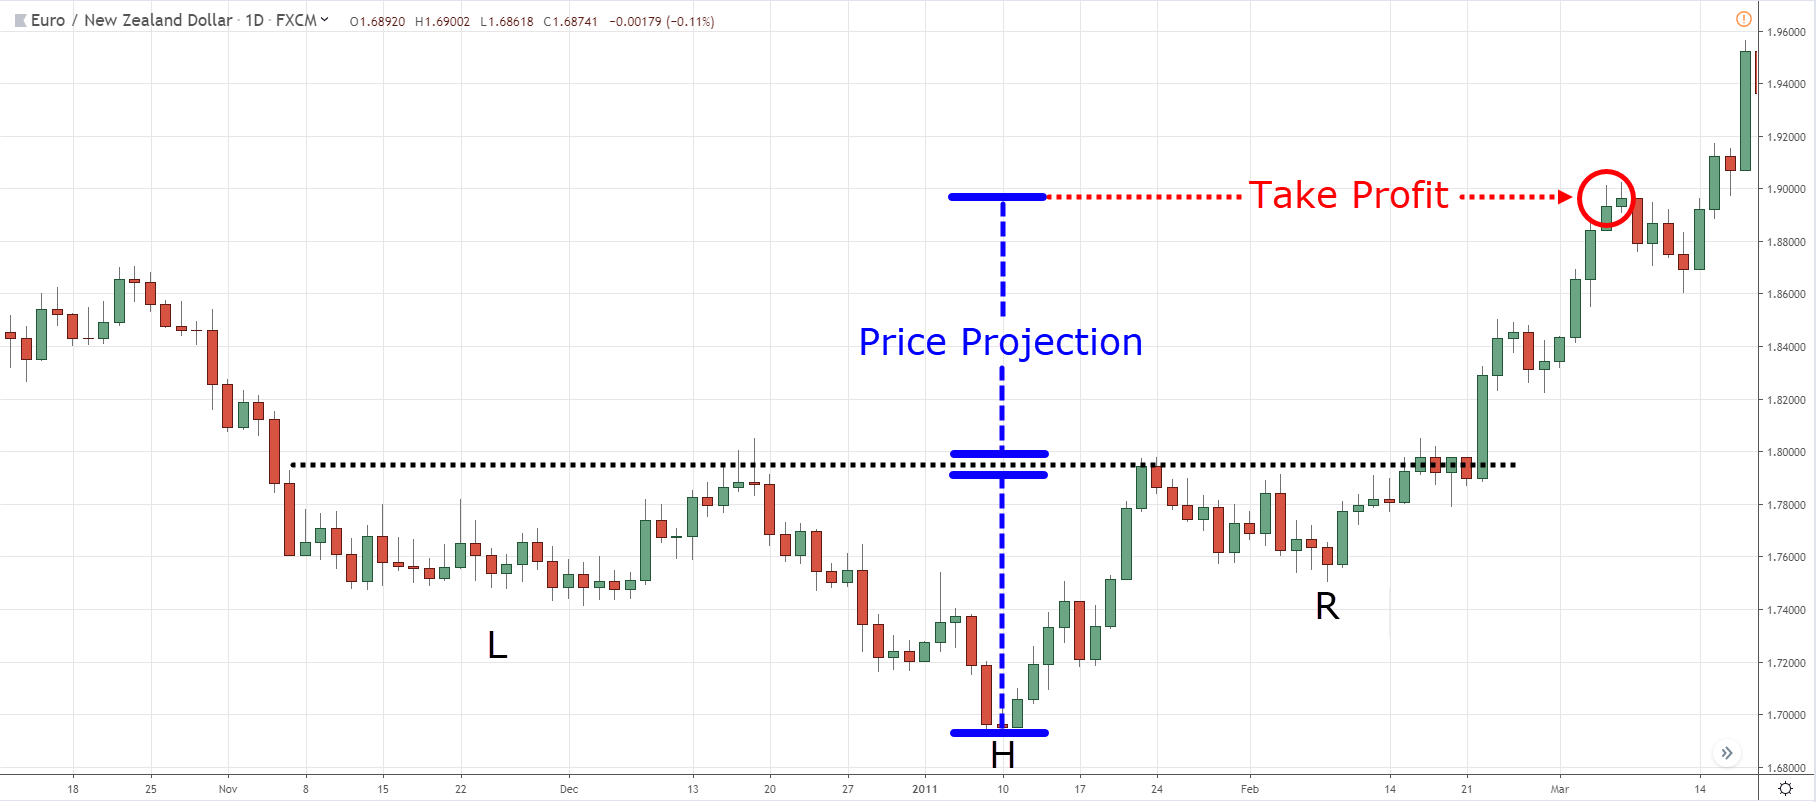
This technique is adopted from Classical Technical Analysis where a chart pattern is completed after moving X amount in your favour.
For an Inverse Head and Shoulders pattern, X is defined as the distance between the Head and the Neckline.
Here’s how it works…
- Calculate the distance between the Head and the Neckline
- Then add it to the breakout point
- The projected price point is where you exit the trade
Here’s an example…
Pro Tip:
You can use the price projection technique and decide whether it’s “too late” to enter a trade, or not.
If the price is close to reaching its price projection, there’s probably not much meat left in the move (and you might want to skip the trade).
Trailing stop loss
Unlike the price projection technique, a trailing stop loss doesn’t use a fixed target profit.
Instead, you trail your stop loss as the price moves in your favour so you can ride a trend.
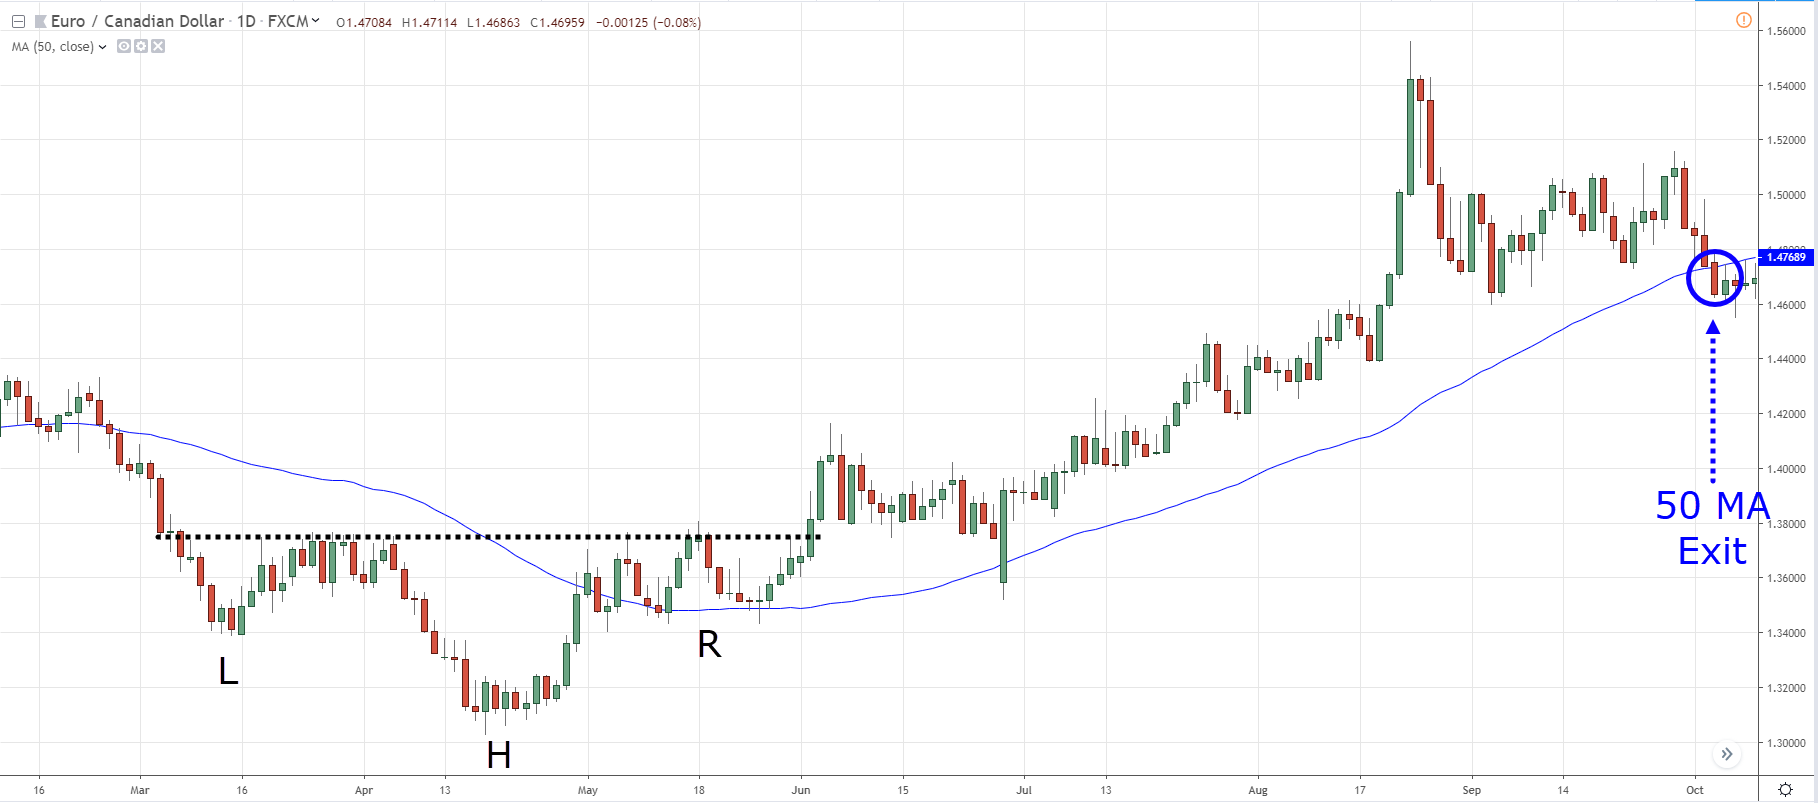
Here’s how it works…
- Decide on the type of trend you want to capture (whether it’s short, medium, or long-term trend)
- Trail your stop loss with the appropriate Moving Average (20MA for short-term, 50MA for medium-term, and 200MA for long-term)
- Exit your trade when the price closes beyond the Moving Average
Here’s an example:
Pro Tip:
There are different ways to trail your stop loss. If you want to learn more, check out 5 Powerful Techniques to Trail Your Stop Loss and Ride Massive Trends.
Conclusion
So, here’s what you’ve learned today:
- The Inverse Head and Shoulders (aka Reverse Head and Shoulders) is a bullish chart pattern signalling a possible trend reversal higher
- Pay attention to the size of the Inver Head and Shoulders relative to the downtrend. If it’s small, then the chart pattern is likely to fail
- The best scenarios to trade the Inverse Head and Shoulders: 1) in an uptrend 2) when it leans against higher timeframe structure 3) it takes more than 100 bars to form
- Three powerful entry techniques: 1) The breakout with buildup 2) The Re-test 3) The First Pullback
- You can exit your winning trades using the Price Projection technique or trailing stop loss
Now here’s what I’d like to know…
How do you trade the Inverse Head and Shoulders chart pattern?
Leave a comment below and share your thoughts with me…


Exciting stuff, Thanks Rayner.
Your Question:
-do not trade against the trend.
-Pay attention to the size of the the inverse head and shoulder pattern.
-Pay attention to the size of the R shoulder.
-You can trade when it leans against the higher timeframe structure.
-And when it takes more then 100 bars to form.
You are magic Rayner
Thanks for sharing, Jan!
Awesome article..
Very helpful
Thank you Reyner for explain in detail.
Excellent article. Well thought out. I love reading your daily emails! Thank you so much for all your help!
Trade it as per naked forex… If the R shoulder is higher… At s/r…
More chart patterns please. I’m more of a visual person. Tnx!
Check this out… https://www.tradingwithrayner.com/category/blog/chart-patterns/
very useful article.. thanx bro..!
Cheers
WAS VERY HELPFUL, THANKS
Awesome!
This is great! Learning different new tricks on the same play. Thanks a lot. Cheers
Awesome to hear that, Carlo!
Damn rayna u are the best. Thanks for all ur tips they make trading feel like child’s play
Ain’t child’s play but glad to know it’s helping!
You are the best, Rayner. keep up the good work, some of us are now profitable traders because of following your instructions.
I’m stoked to hear that!
Best explanation Rayner I ever read any where
Cheers
so you are trying to say , when the breakout happens , take the trade ,if it re test it , re enter
or never enter at breakout , wait for the re test of the neck line
and if that does not happen , wait for the small pull back and then buy at that breakout
and visa versa for the sell trade
avoid trading at breakout bar close rihgt
Does it matter which angle the neckline has? Does it matter how “clean” the left shoulder dip is or could it be, lets say a double bottom?
Wow! These are absolute guides and refined tips n instructions. I’m overwhelmed. Thanks very much boss. Sure always a blessing.
Thank you so much, Mikiano!
Good Day, Rayner.
Thanks brother, inverse head and shoulder pattern it’s a light bulb moment to me. You’ve just enlighten me up . Big up, I trust I’ll start profiting from the market using your strategy guide. Big Up
I’m glad to hear that, Navegate!
Thanks, Rayner
You are welcome, Navjot!
You are a great mentor. Love from India
Thank you, Manoj!
I loved it sir❤️….i have never learned it before️
I’m glad it can help, Md Oli!
FIRST, YOU HAVE TO MAKE SURE THAT YOU ARE IN A UPTREND, YOU THEN CHECK YOUR HTF TO ADD AS AN EXTRA CONFLUENCE, BEFORE YOU TAKE THE TRADE ON THE INVERSE HEAD AND SHOULDER, MAKE SURE YOU HAVE A TRADE SETUP. A TRADE SETUP LIKE A BREAKOUT WITH A BUILD UP OR IF YOU MISS THAT YOU WAIT FOR A PULL BANK THEN YOU ENTER THE TRADE, AND FOR YOUR TARGET PROFIT, YOU USE YOUR PRICE PROJECTION OR YOU TRAILING STOP TO EXTIT THE TRADE. THANK YOU RAYNER.
GOD BLESS YOU
Thank you for sharing, Genesis.
Cheers!
Great guide. Thanks a lot.
It’s our pleasure to help you, Raktim.
Cheers!
Thanks for all you do, you’re really appreciate ❤️
It is our pleasure, Johnson!
Great from greatest mentor I would learned more than I have
Very very useful inputs. Hats off to you
At your service!
I have learnt my mistake…as at now am in loss due to failed H&S pattern on strong downtrend.
Thank you for sharing, Milly!