You’ve been lied to.
Technical Analysis is not what you think.
It will NOT make you a profitable trader and can even mislead you to make the wrong decisions (like buying when you’re supposed to be selling).
Why?
Because what you’ve been taught about Technical Analysis is WRONG.
For example:
- You “blindly” trade the patterns and strategies from textbooks (and gurus)
- You think Technical Analysis is a “crystal ball” that can predict the future
- You buy just because an indicator shows “oversold”
If that sounds like you, don’t worry.
Because by the end of this post, you’ll discover the TRUTH about Technical Analysis and how you can use it to level up your trading.
But a word of warning.
After reading this post, you’ll never look at Technical Analysis the same way again.
You ready?
Then let’s get started…
Technical Analysis Basics: What is it and how does it work?
Technical Analysis refers to using past prices (or volume) to make your trading decisions.
This can be tools like candlestick patterns, chart patterns, technical indicators, trends, etc.
You might be wondering:
“Is Technical Analysis BS”?
“Does Technical Analysis Work?”
Yes, it does.
And here’s the proof…
Now, even though Technical Analysis works, there are still many traders who lose consistently.
And here’s why…
What you must know about Technical Analysis the pros hope you never find out
Here’s a fact:
Technical Analysis is just a tool for trading analysis — that’s it.
Technical Analysis alone will not make you a profitable trader.
You still need risk management, discipline, and an edge in the markets.
Once you’ve understood it, let’s learn how Technical Analysis can help you make informed trading decisions.
Now the first thing you must know is 4 types of Technical Analysis…
And for each category, there are different purposes for it.
Let me explain…
Technical Analysis: How to master drawing tools and “predict” market turning points
You might be wondering:
“What are drawing tools?”
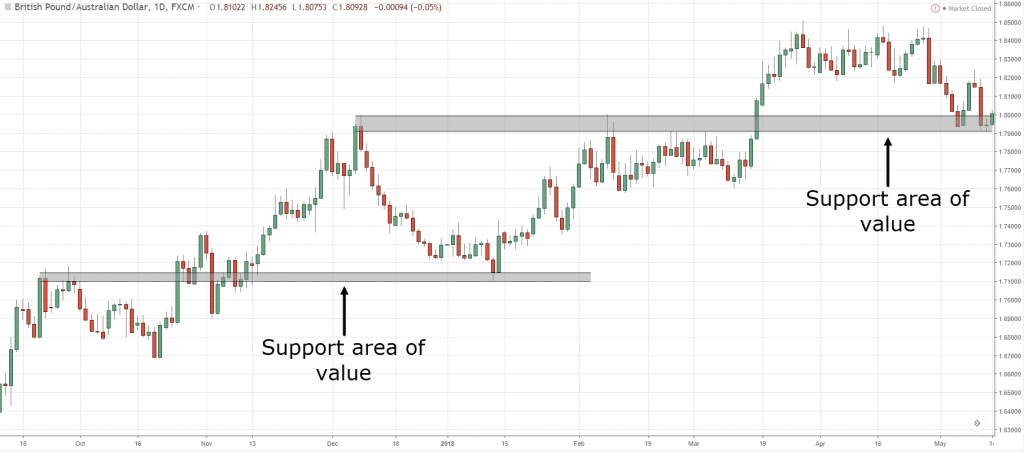
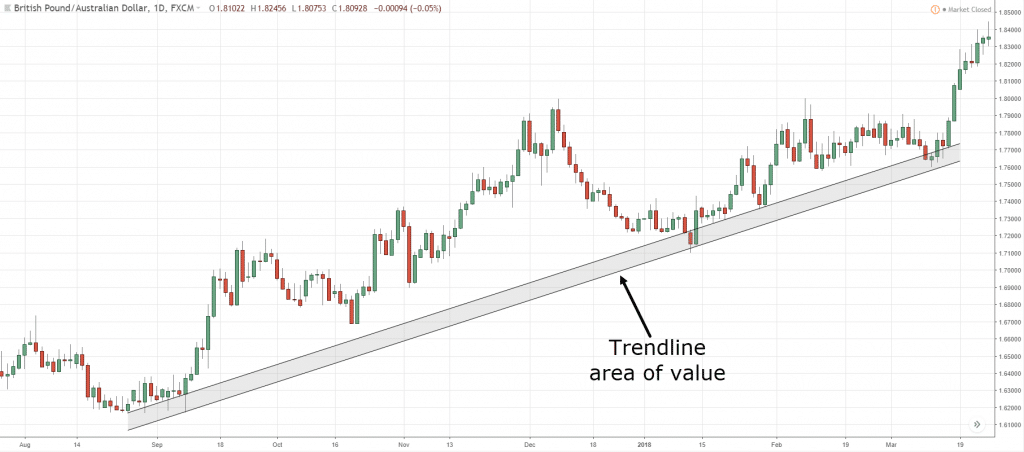
Drawing tools refer to lines you draw on your charts like Support and Resistance, Trendline, Trend Channel, etc.
It’s useful because it helps you with trading analysis by identifying an area of value.
This means you can “buy low and sell high”.
Here are a few examples…
Areas of value in GBP/AUD Daily:
Trend line area of value in GBP/AUD Daily:
So, how do you draw them correctly?
Well, I use a 3-step technique that can be applied to any drawing tools.
Here’s how…
- Zoom out your charts
- Draw the most obvious levels
- Connect as many touches as possible
If you want to learn more, go watch this training video below…
Now, drawing tools are just one part of Technical Analysis and it’s not enough to trade the markets profitably.
That’s why in the next section, you’ll learn about candlestick patterns and how to use it to better time your entries.
So read on…
How to use candlestick patterns to better time your entries
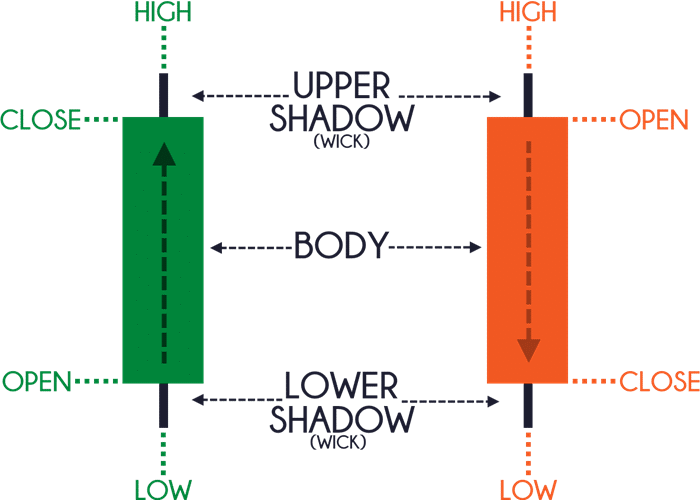
Candlestick patterns help you visualize the prices on your chart and they are useful in your trading analysis as an entry trigger.
Here’s what you must know:
Open – The opening price
High – The highest price over a fixed time period
Low – The lowest price over a fixed time period
Close – The closing price
Here’s what I mean:
Does it make sense?
Great!
Then let’s move on and learn a few powerful candlestick patterns to help you better time your entries.
They are:
- Hammer
- Bullish Engulfing Pattern
- Morning Star
I’ll explain…
Hammer
A Hammer is a (1- candle) bullish reversal pattern that forms after a decline in price.
Here’s how to recognize it:
- Little to no upper shadow
- The price closes at the top ¼ of the range
- The lower shadow is about 2 or 3 times the length of the body
And this is what a Hammer means…
- When the market opens, the sellers took control and pushed price lower
- At the selling climax, huge buying pressure stepped in and pushed price higher
- The buying pressure is so strong that it closed above the opening price
In short, a hammer is a bullish reversal candlestick pattern that shows rejection of lower prices.
Next…
Bullish Engulfing Pattern
A Bullish Engulfing Pattern is a (2-candle) bullish reversal candlestick pattern that forms after a decline in price.
Here’s how to recognize it:
- The first candle has a bearish close
- The body of the second candle completely “covers” the body first candle (without taking into consideration the shadow)
- The second candle closes bullish
And this is what a Bullish Engulfing Pattern means…
- On the first candle, the sellers are in control as they closed lower for the period
- On the second candle, strong buying pressure stepped in and closed above the previous candle’s high — which tells you the buyers have won the battle for now
In essence, a Bullish Engulfing Pattern tells you the buyers have overwhelmed the sellers and are now in control.
Morning Star
A Morning Star is a (3-candle) bullish reversal candlestick pattern that forms after a decline in price.
Here’s how to recognize it:
- The first candle has a bearish close
- The second candle has a small range
- The third candle closes aggressively higher (more than 50% of the first candle)
And this is what a Morning Star means…
- On the first candle shows, the sellers are in control as the price closes lower
- On the second candle, there is indecision in the markets as both the selling and buying pressure are in equilibrium (that’s why the range of the candle is small)
- On the third candle, the buyers won the battle and the price closes higher
In short, a Morning Star tells you the sellers are exhausted and the buyers are momentarily in control.
Now…
Candlestick pattern is a huge part of Technical Analysis and it’s not possible to cover everything here.
So if you want to learn more, go read The Monster Guide to Candlestick Patterns.
But for now, understand that candlestick patterns are useful as an entry trigger.
And in the later section, you’ll learn how to combine it with different tools so you can find high probability trading setups — and profit in bull & bear markets.
Let’s move on…
How to read Technical Analysis chart patterns like a pro
Unlike candlestick patterns which form after 1, 2, or 3 candles, chart patterns take a longer time to develop.
That’s why chart patterns are useful to identify an area of value, define market conditions, and detect strength & weakness.
Now, these are some useful chart patterns I pay attention to…
- Head and Shoulders
- Ascending Triangle
- Bull Flag
Let me explain…
Head and Shoulders
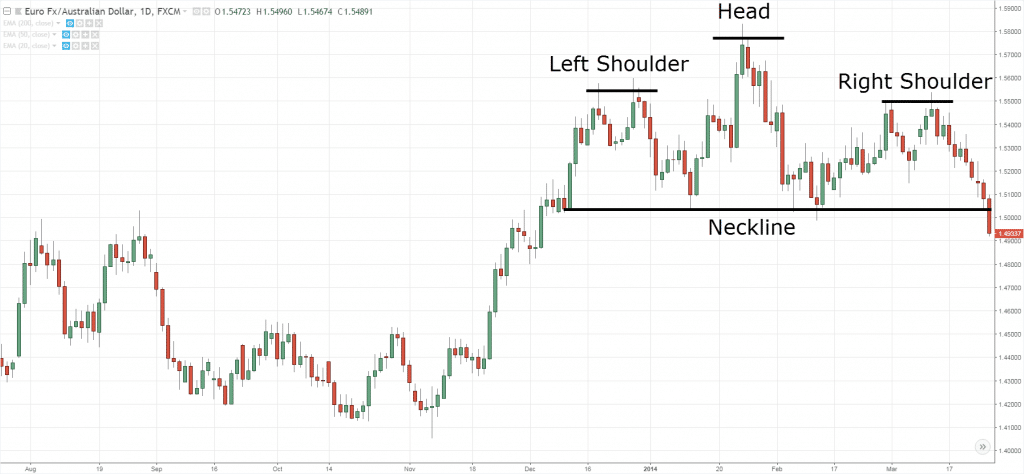
The Head and Shoulders pattern is a reversal chart pattern.
It consists of four parts:
- The left shoulder
- The head
- The right shoulder
- The neckline
Here’s what I mean…
A Head & Shoulders on GBP/USD Daily:
But what does it mean?
Let’s analyze it together…
Left Shoulder – The market does a pullback. At this point, there’s no way to tell if the market will reverse because a pullback occurs regularly in a trending market.
Head – The market trades above the previous high. However, the sellers took control and push the price lower towards the previous swing low (forming the Neckline).
Right Shoulder – The buyers make a final attempt to push the price higher, but it failed to even break above the previous high (the head). Then, the sellers take control and push the price toward the Neckline.
Neckline – This is the last line of defense for the buyers. If the price breaks below it, the market could head lower and begin the start of a downtrend.
So basically…
The Head and Shoulders pattern signals a possible trend reversal as the buyers cannot push the price higher.
If you want to learn more about this chart pattern, go watch this training video below…
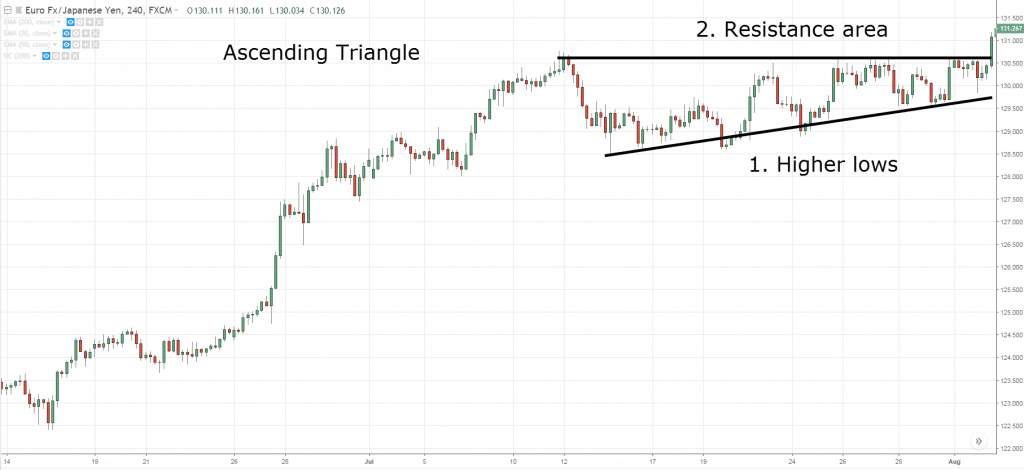
Ascending Triangle
The Ascending Triangle is a bullish chart pattern that signals the market is about to head higher.
It consists of 2 parts:
- Higher lows
- Resistance area
Here’s how it looks like…
An Ascending Triangle in EUR/JPY 4-hour:
And here’s what it means…
Higher lows – The series of higher lows tells you that there is demand even as the price continues higher.
Resistance area – Now if there’s strong selling pressure, the price shouldn’t remain at Resistance for long. Instead, it should move lower quickly.
But, if the price is still hovering near Resistance, it means there’s a lack of selling pressure even though it’s at an “attractive” level.
So basically…
The Ascending Triangle pattern is a sign of strength as the buyers keep supporting higher prices, and the market could break out higher.
If you want to learn more about this chart pattern, go watch this training video below…
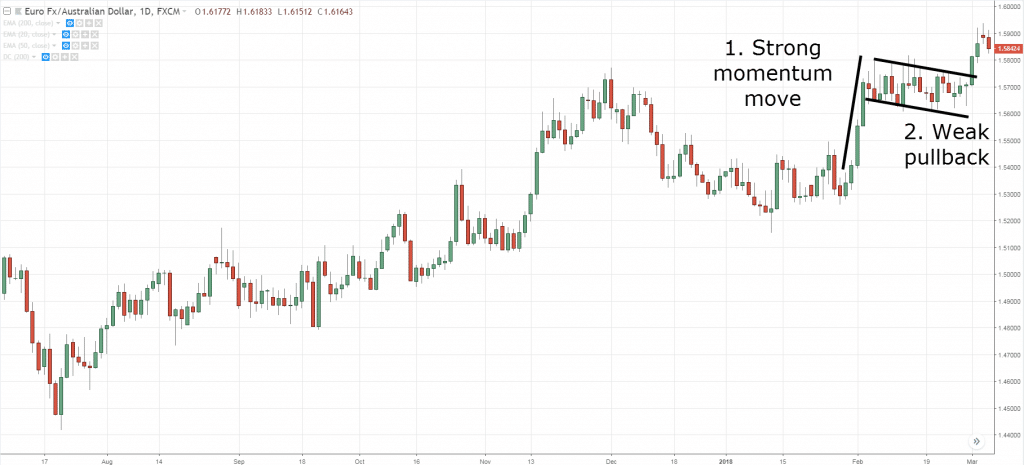
Bull Flag
A Bull Flag is a continuation chart pattern that signals the market is likely to move higher.
It consists of 2 parts:
- Strong momentum move
- Weak pullback
Here’s how it looks like…
A Bull Flag on EUR/AUD Daily:
And here’s what it means…
Strong momentum move – The large-bodied candles tell you the buyers are in control and there’s strong momentum towards the upside.
Weak pullback – The small-bodied candles on the pullback tells you the buyers and sellers are in equilibrium for now.
So basically…
The Bull Flag pattern is a sign of strength as the buyers are in control but temporally in equilibrium with the sellers.
If nothing changes, the buying pressure will continue to push the price higher.
If you want to learn more about this chart pattern, go watch this training video below…
At this point…
You’ve learned the “price action” part of Technical Analysis.
Moving on, you’ll learn the power of trading indicators and how it can dramatically improve your trading results.
So let’s go…
Why trading indicators are NOT useless — and how to use them like a pro
The reason why you fail with indicators is that you trade it without understanding its purpose.
For example:
You go long just because the RSI is oversold.
You sell because MACD forms a bearish divergence.
You buy because the moving average crosses up.
Now, I’m sure you’ve tried these methods and have lost money with it.
So, what’s the solution?
You must first understand the purpose of your trading indicators.
And then you can use the right indicators to suit your needs.
Does it make sense?
Good.
Now, let’s learn 3 powerful trading indicators, their purpose, and how it can help your trading.
They are:
- Moving Average
- Average True Range
- Donchian Channel
I’ll explain…
Moving Average Indicator
The Moving Average is a trend following indicator.
The value is derived by taking the average of the previous closing prices.
For example:
A 20-period Moving Average value is derived from the average close of the last 20 candles.
A 200-period Moving Average value is derived from the average close of the last 200 candles.
And etc.
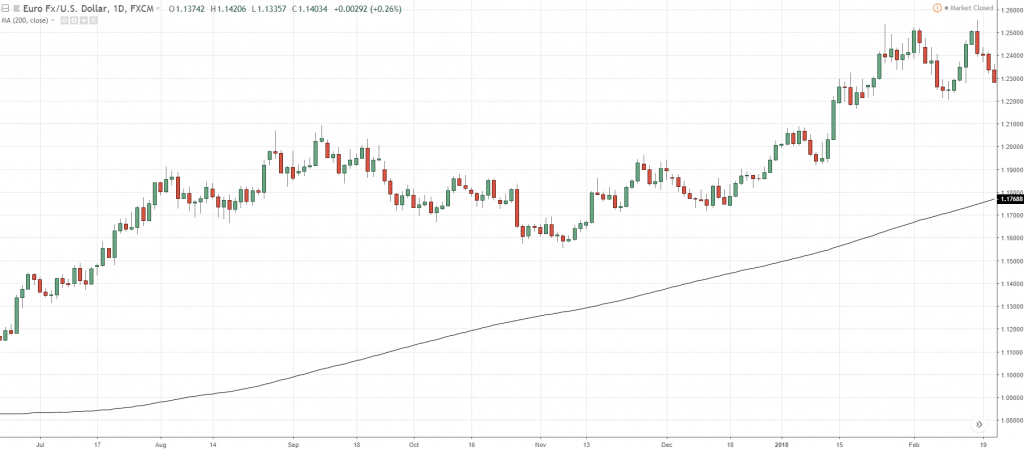
Here’s how it looks like…
A 200 MA on EUR/USD Daily:
Now you might be wondering:
“So what’s the purpose of a Moving Average?”
Brilliant question!
You can use the Moving Average to:
- Define the trend
- Identify an area of value
Let me explain…
Define the trend
You can use the Moving Average to define the trend.
Here’s how…
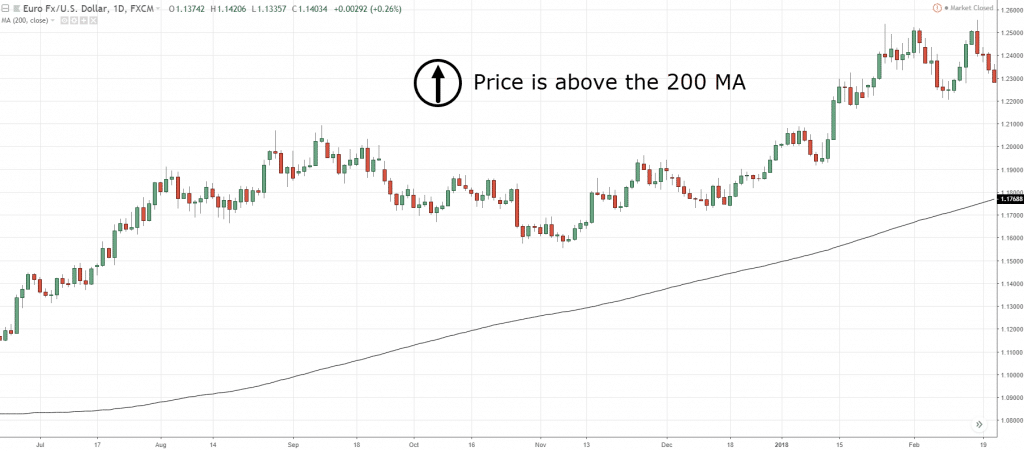
If the price is above the 200-period Moving Average, then the long-term trend is up.
If the price is below the 200-period Moving Average, then the long-term trend is down.
A few examples…
Price is above the 200 MA on EUR/USD Daily:
Identify an area of value
Now…
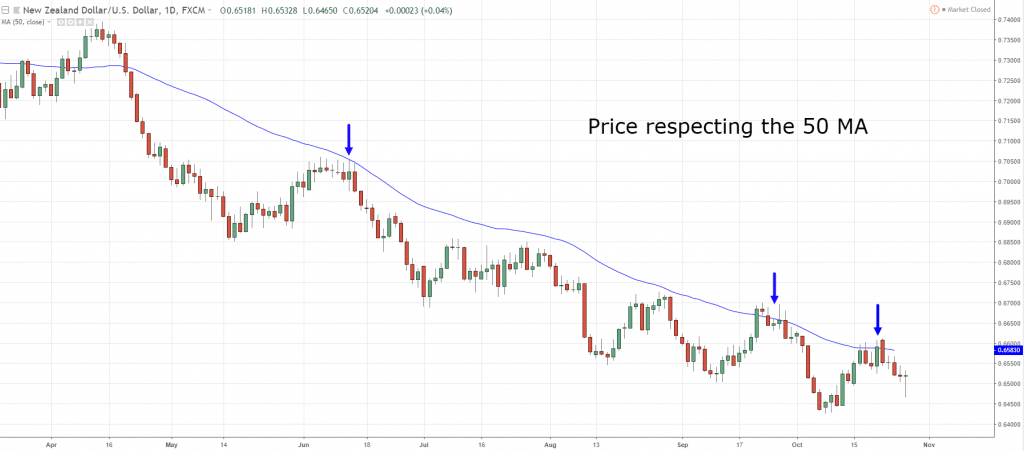
In trending markets, the Moving Average can act as an area of value — where you can look to “buy low and sell high”.
Here’s what I mean…
Price respecting the 50 MA on NZD/USD Daily:
Next indicator…
Average True Range (ATR)
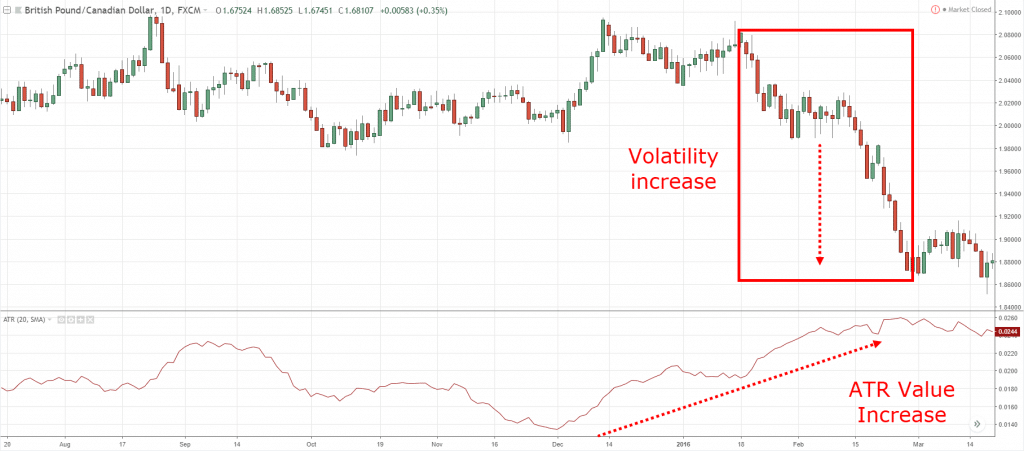
The Average True Range is an indicator that measures volatility in the markets.
This means when the range of the candles expands, the ATR value will increase (and vice versa).
Here’s how it looks like…
Volatility and ATR on GBP/AUD Daily:
And what’s the purpose of the ATR indicator?
You can use it to:
- Set a proper stop loss
- Identify volatility contraction
I’ll explain…
Set a proper stop loss
Now, a mistake many traders make is placing their stop loss just above Support (or below Resistance).
That’s not a good idea.
Why?
Because it gets stop hunted easily.
Instead, you want to place your stop loss a distance away from such levels.
But the question is, how much “buffer” should you give?
That’s where the ATR comes into play.
You can set your stop loss 1 ATR away below Support (or above Resistance).
Identify volatility contraction
You might be wondering:
“Why do I want to identify volatility contraction?”
Here’s why…
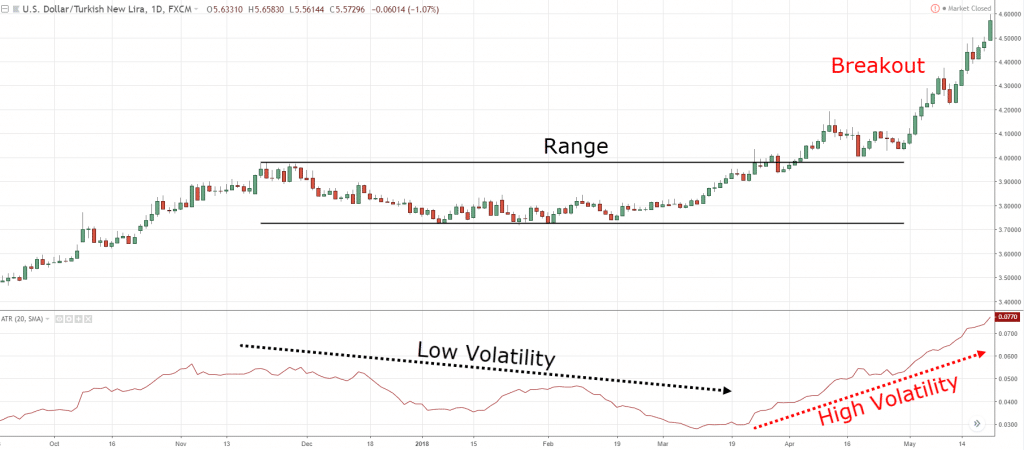
The market moves in volatility cycles, from a period of low volatility to high volatility and vice versa.
And here’s the thing…
When the market is in a low volatility period, it means that volatility is likely to expand in the near future.
This offers some of the best trading opportunities because you can enter with a tight stop loss and reap massive gains if volatility expands in your favor.
Here’s what I mean…
High and low volatility on USD/TRY Daily:
If you want to learn more about this trading indicator, go watch this training video below…
Moving on…
Donchian Channel
The Donchian Channel is a Trend Following indicator.
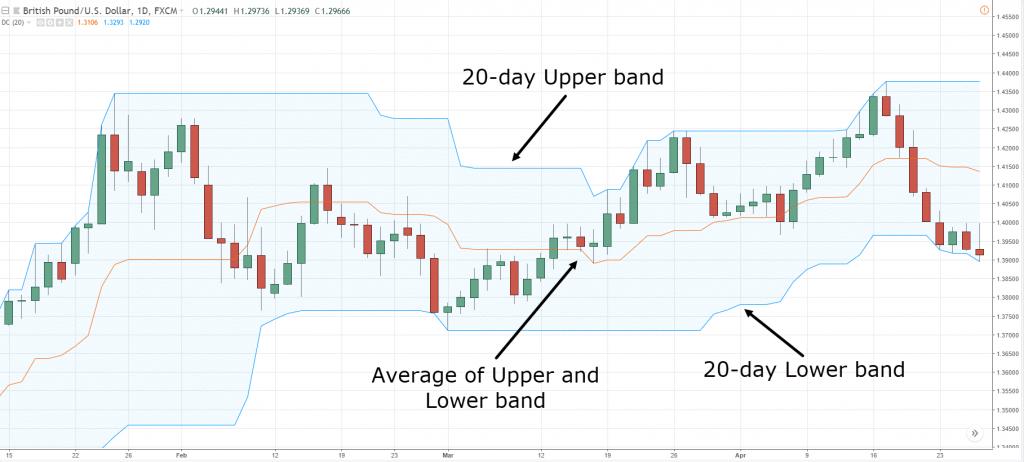
And it has 3 parts to it:
- Upper band – the 20-day high
- Middle band – the average of the Upper and Lower band
- Lower band – the 20-day low
Here’s how it looks like…
The Donchian Channel on GBP/USD Daily:
The purpose of it?
You can use it to:
- Catch breakouts
- Ride massive trends
I’ll explain…
Catch breakouts
Here’s the thing:
Most traders want to ride BIG trends.
And the strategy they use is:
- Wait for a pullback
- Wait for a better price
- Wait for the market to come to them
Is there a problem with this?
YES.
Because the market might not form a pullback — and you’ll miss the entire move.
So what’s the solution?
You must trade breakouts.
Think about it:
For a market to trend, it must break out higher.
So if you trade breakouts, you’ll catch every trend.
Does it make sense?
Great!
Here’s how you can do it…
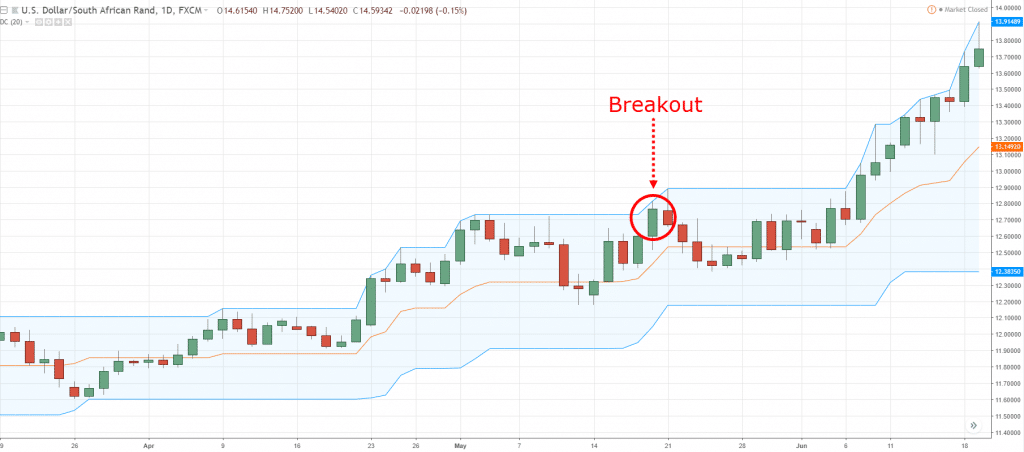
If the price “touches” the upper band of the Donchian Channel, you go long.
An example…
Donchian Channel breakout on USD/ZAR Daily:
Ride massive trends
Recall:
The Donchian Channel shows you the 20-day high and low (the upper and lower band).
And you can use it to trail your stop loss and ride massive trends.
Here’s how…
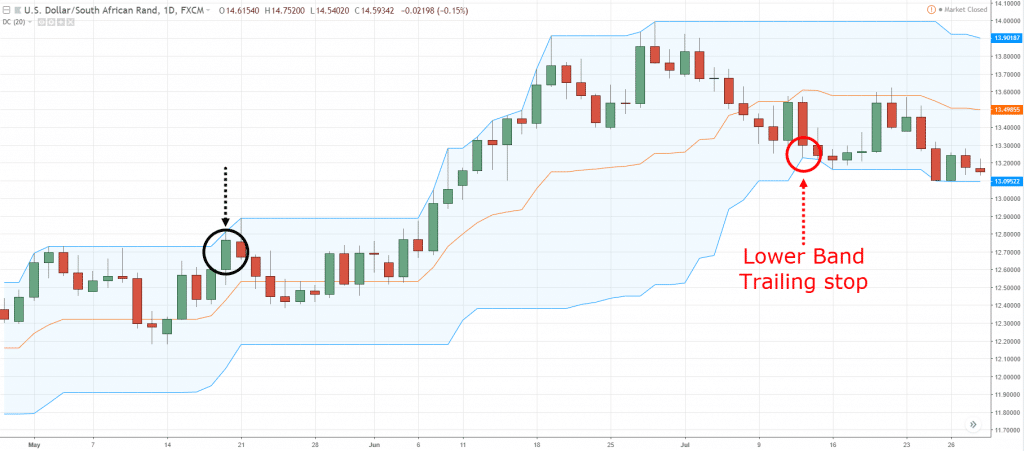
If you’re long, you can trail your stop loss using the 20-day low (lower band), and exit only if the price hits the lower band.
An example…
Donchian Channel trailing stoploss on USD/ZAR Daily:
If you want to learn more about this trading indicator, go watch this training video below…
Right now…
You’re ahead of 85% of traders out there.
Because you’ve learned the different categories of Technical Analysis and their purpose of it (most traders never get this far).
So in the next section, you’ll learn how to use this new found knowledge and develop it into a trading strategy that works.
How to combine Technical Analysis so you can profit in the financial markets
Now, before I go into details, you must first know the type of trading strategy you want to trade.
Most strategies fall under one of these categories:
- Trend Trading
- Breakout Trading
- Range Trading
- Counter-trend Trading
Once you’ve picked a type of strategy, then you can use the correct tools to trade your strategy.
Let me share with you a couple of trading strategy templates…
Trend Trading Strategy
When I trade trends, I like to use my T.A.E formula.
You’re probably wondering:
“What does T.A.E stands for?”
I’ll explain…
T – Trend
A – Area of value
E – Entry trigger
Step #1: Trend
Recall, you can use Moving Average (or Donchian Channel) to define the trend.
So, let’s go with Moving Average for this case.
Step #2: Area of value
There are a few ways you can do it (like using Trendlines, Support & Resistance, etc.).
For this example, let’s go with Support to define our area of value.
Step #3: Entry trigger
If you recall, candlestick patterns are useful as an entry trigger.
So, let’s use the reversal candlestick patterns you’ve learned earlier as entry triggers.
Moving on…
Let’s combine these into a trading strategy (with entries & exits).
Here’s a template you can use (for long setups):
If the price is above the 200-period Moving Average, then the long-term trend is up.
If the long-term trend is up, then wait for the price to pullback towards Support.
If the price pullback towards Support, then wait for a reversal candlestick pattern.
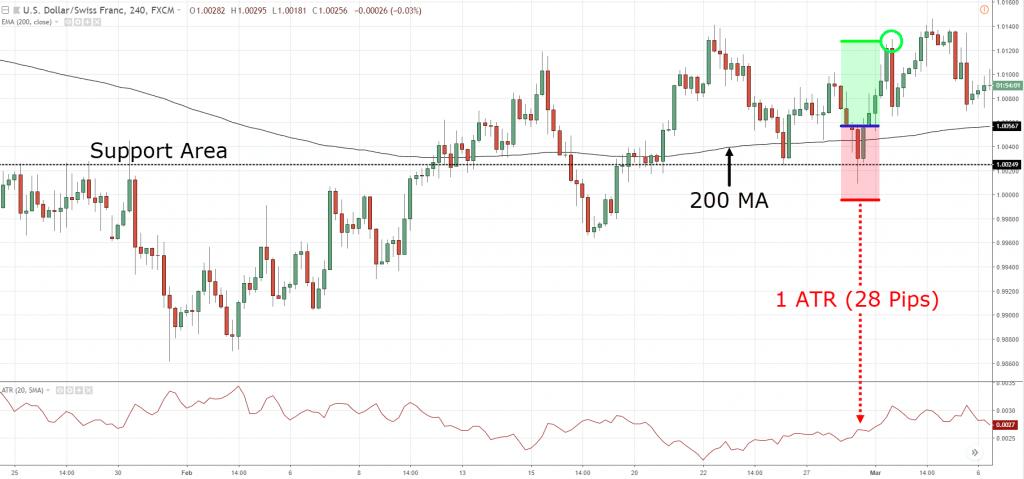
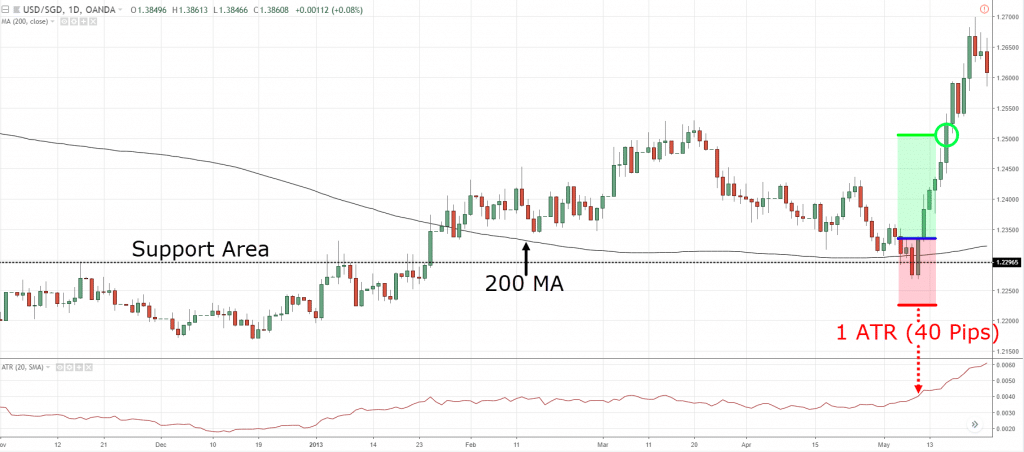
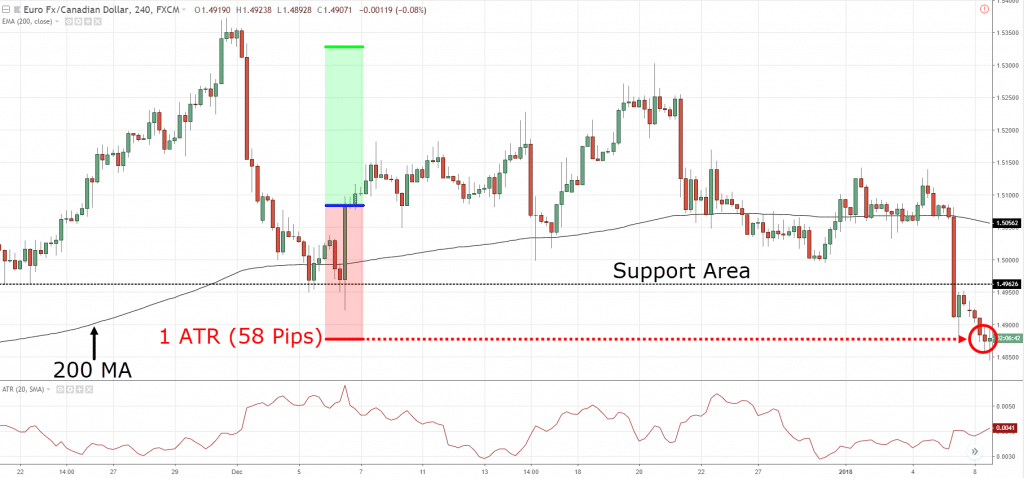
If there’s a reversal candlestick pattern, then go long with stop loss 1 ATR below the low and take profit at the nearest swing high.
A few examples…
A winning trade on USD/CHF 4-hour:
A winning trade on USD/SGD Daily:
A losing trade on EUR/CAD 4-hour:
Now…
You can adjust the formula to your needs.
For example, you can:
- Define the trend using Donchian Channel
- Use Trendline to define your area of value
- Use a higher close as an entry trigger
- Adjust your exit to ride a trend
The possibilities are endless and it’s up to test to find out what works for you.
Now can you see how you can combine Technical Analysis and develop your trading strategies?
Great!
Let’s do one more example to make sure you understand this completely.
Breakout Trading Strategy
Here’s the thing:
The market moves in volatility cycles, from a period of low volatility to high volatility (and vice versa).
This means the best time to trade breakouts is when volatility is low, so you have a tighter stop loss — and can reap massive profits if volatility expands in your favor.
Step #1: Low volatility environment
You can use the Average True Range (ATR) indicator to define this market condition.
A multi-year low volatility is a sign that something “big” is brewing.
Step #2: Entry trigger
You can use the Donchian Channel to time your breakout trades.
For example: A break of the 20-day high (or low).
Here’s a template you can use (for long setups):
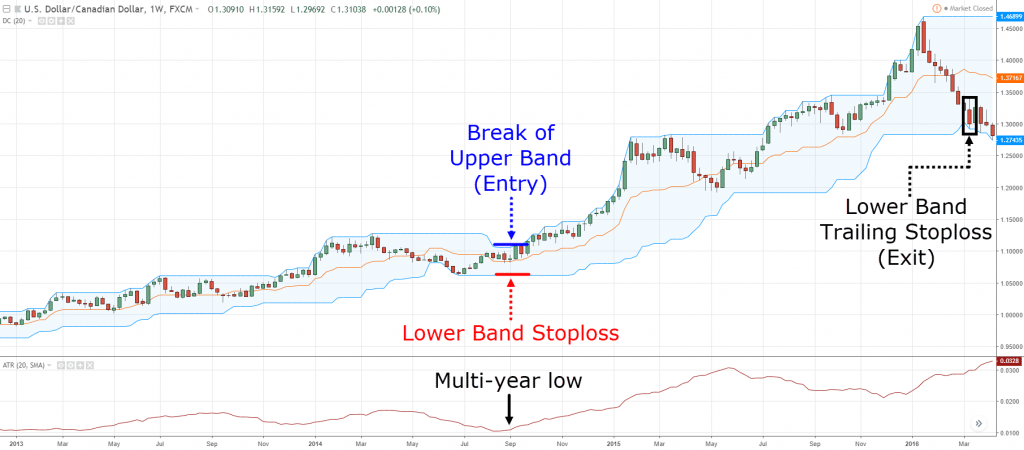
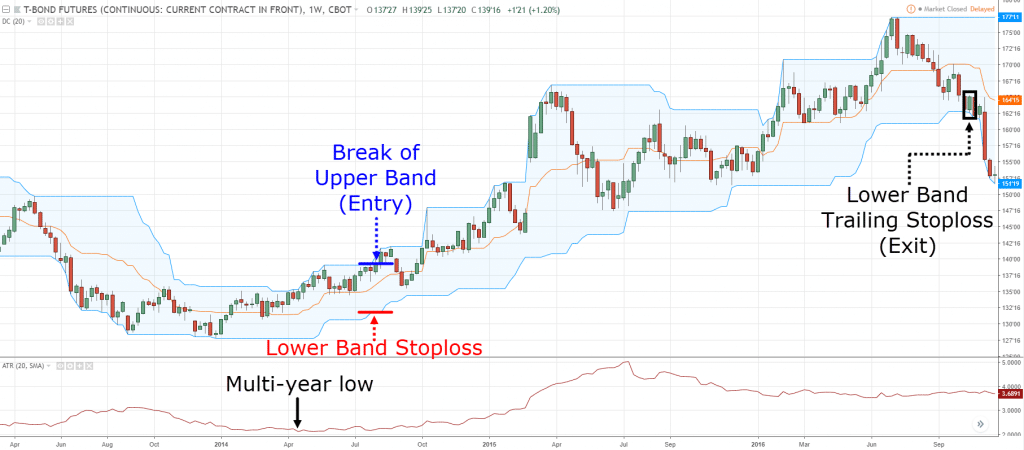
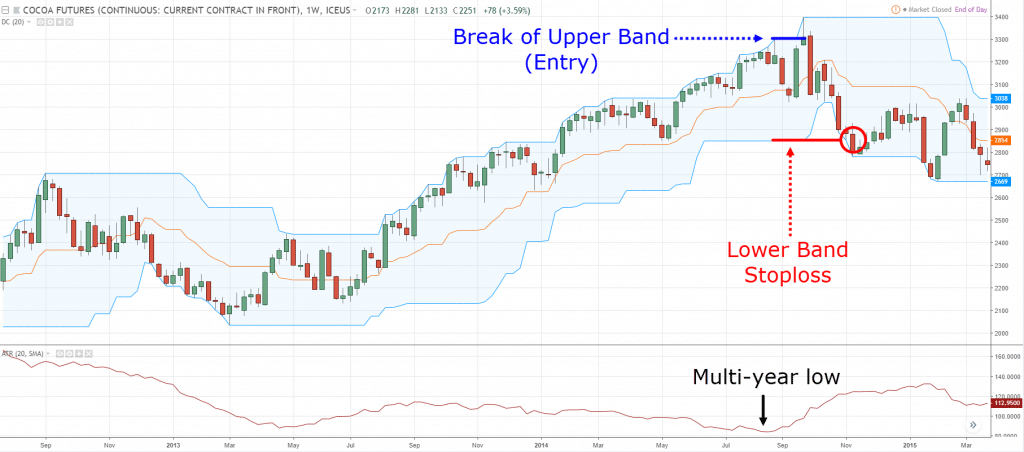
If the price is at multi-year low volatility, then wait for the price to break the 20-week high.
If the price breaks the 20-week high, go long and trail your stop loss below the 20-week low.
Pro tip: This breakout strategy works best when you trade across different markets (like Forex, Indices, Commodities, Metals, etc.).
A few examples…
A winning trade on USD/CAD Weekly:
A winning trade on T-BOND Weekly:
A losing trade on COCOA Weekly:
Likewise, you can adjust this formula to your needs.
For example, you can:
- Trade the break of Support or Resistance
- Use a different trailing stop loss
- Trade on a different timeframe
Does this make sense?
Awesome!
So is Technical Analysis BS—hopefully, at this point, the answer is no.
You’re now a Technical Analysis pro and you’ve got what it takes to develop trading strategies to profit in the financial markets.
Technical Analysis: Learning resources for you
Now if you want to be a student of the markets, then here are some Technical Analysis resources to level up your trading…
Get access to all my best trading videos — in one place.
Everything you need to know about Price Action Trading without the hype or fluff.
Everything you need to know about Support and Resistance without the hype or fluff.
Discover how to master candlestick patterns without memorizing a single one.
Discover proven trading techniques that work so you can level-up your trading and beat the markets.
Conclusion
So, here’s what you’ve learned today:
- There are 4 types of Technical Analysis: Drawing tools, candlestick patterns, chart patterns, and indicators
- Technical Analysis has 3 purposes: Identify an area of value, entry trigger, define the market condition
- Every tool on your chart must have a purpose, or else it’s “noise” to your trading
- You can combine different technical tools to develop your trading strategies
- There are 4 main types of strategies: Trend trading, breakout trading, range trading, counter-trend trading
- The T.A.E formula is a powerful trend trading strategy
Now, here’s my question to you…
How do you use Technical Analysis in your trading?
Leave a comment and share your thoughts with me.




Superb, you are gem.
Cheers
Excellent explaination bro….
cheers
Thanks Ray. We are counting on you.
Meanwhile I just read some ill comments about you in the internet. With all these works I dont even know you have enemies. Please keep up the good works.
That’s a good sign.
I’d be worried if I don’t have any haters as it means I’m not doing enough, hah.
Very true
Keep up with the good work Sir.
Hi Ayim,
You are welcome!
powerful Rayner
Cheers
Thank you Rayner… This is indeed a powerful selfless expose..
Keep up the good work.. GOD BLESS YOU
You’re welcome!
Hey! Ray I have no regrets following you bro you remain my no 1 mentor. God bless u man
Cheers bud
super, but you don’t say nothing about how to combine the different TF. For example there is always a bigger TF in consolidation and the lower TF ( trigger ) in breakout. It’s a little Elliot wave but without using properly this technic. I am curious about your opinion. It offers the advantage not to wait to long till an interesting movement happens on the higher TF.
I could go into that but I’ll leave it as another blog post.
As you said already ahead of most traders thanks …I soon believe I’ll be a successful traders…
Nice!
Thanks Rayner, one more great article with clear explanations.
It really helps to light my way as beginning trader
Awesome to hear that!
Powerful and Insightful.. Thanks for this
You’re welcome!
Thanks for sharing your knowledge.
Have been able to look at charts with a different perspective after reading your articles.
Great to hear that!
Thank you so much, I will read this guide and also apply it on daily basis until i became a professional trader
Nice!
You are doing a great job..Thanks a lot..
My pleasure!
Beautiful write-up, good work Rayner. I find it confusing to identify relevant swing highs and lows on my chart. I use zig-zag indicator to wave out irrelevant swings and swing points. I would your opinion on how I can identify swings properly as a price action trader.
I’d look at the most obvious swing points.
If it takes more than 2 seconds to determine it, it probably isn’t a “key” level.
Tip: The stock Binckbank NV is making an ” Ascending Triangle”…
Thanks Rayner, this is very helpful.
You’re welcome, Mary!
Great work Rayner all-in-one , as usual thanks..
I’m a trend trader using 2 Ema to define the trend after cross over waiting for pull back & with the help of stochastic & engulfing candlestick pattern try to enter, set my stop loss with the help of ATR , open 2 trades , first 1:1 & second 1:5 to make sure I’m going to ride the trend if went my way I have to mention I trail my stop for the second trade very conservatively
Thank you for sharing, Ali!
This is powerful am really getting it right now as time goes I believe I will make great move in forex trade
Awesome to hear that!
God bless you mentor, respect
Cheers bud
Thank you for this another very helpful email. I am still paper trading, but I am settling in on “my/your” swing methods. Fred
I’m glad to hear that, Fred!
Duude, you’re gold, my understanding of charts, and their purpose has made my trades much more easier to understand, kudos to you
Awesome to hear that, Elton!
Thanks Ray for the lecture. Please I have a question to ask on placing the sl using ATR.
You said we can place the stop loss 1ATR below the low of the entry trigger. So if for instance we had a bullish engulfing as an entry trigger near a support line with ATR value of. 0040 which can be translated as 40 pips, where do we start counting the 40pips? Is it from the close of the bullish engulfing candle downwards or is it 40 pips from the low of the bullish engulfing candle down.
I’d prefer to put it at the lowest point between the two.
Very useful material
I’m glad to hear that!
Thanks Ray, for this great information. I’m still stuck on which indicators to use because you talked about MACD, Bollinger Bands, RSI, and etc. Now you picked out; ATR and DC. So how do you know which indicators to craft and master?
You should choose an indicator that compliments your trading approach not because of what I shared here.
Thanks!
Cheers!
Thanks situ have been good to us
Cheers
I may not be able to understand this right now but i have saved this for future use. I’m learning day by day.
Baby steps!
Hi. I am new to trading. Tried since a couple of months back but lost money and realised I need to learn lots more therefore I am here. I just read through and find the lesson great. Will come back to work through it properly with the videos. Thanks for having this service available to us for free. God Bless.
You’re welcome!
Great post! 🙂
cheers
Dear Rayner you are a mentor for me
Thank you .i wish you a lots and lots of happiness
I appreciate it, Pravin.
Rayner my official mentor. Thank you bro
cheers
I am actually much inclined towards usage of pivot points, i would be grateful if you make some video on using pivot points for intraday trading on 5 min chart….thanks in advance rayner
I’ll look into it, cheers.
Thank you so much Rayner.
I feel like i’m gonna be professional.
So, Can I just copy these technical analysis and strategies to trade? Can these ever work for me ?
Rayner you are a great teacher, you are just like those great persons who made Singapore a great nation. Thank you from the bottom of my heart.
Hi Ranjan,
You are most welcome!
Please mail me videos thr mail
Hi! Rayner brother,
Great article and new techniques for learning.
Before I got the MAEE formula, and now the TAE one.
Thank you so much.
thank you so much.
You’re most welcome!
Detailed explanation, thank you
Awesome, Kingsley!
[…] you trade chart patterns (or any form of Technical Analysis), it has to be within the context of the […]
Thank you Rayner you have given sooooo much useful information that it has blown my mind I wish it was explained to me in this fashion before I blew up account after account
Glad we could help, Roger!
Excellent lecture. Please I need you to be my mentor both in trading and affiliate/digital marketing aspect of forex
Heyhey, Theoforex!
If you wanna learn more, you can check this out:
https://www.tradingwithrayner.com/premium/
https://www.tradingwithrayner.com/academy/
Hiii reyner teo lots of love from India you are just awesome thanks for providing such a valuable info learned alot from your videos and with this technical analysis guide ❤️
Thank you for your kind words, Satyam!
It is our pleasure to help you!
Cheers!
Dear Rayner Thanks i have learned a lot of trading things from you
You are most welcome, Khan!
Actually you are a good mentor I am learning something now
Happy to hear that, Zack!
Thank I’m learning something
You are most welcome, Mr Johnson!
Please make a video counter trend trading
You might find the article below interesting:
https://www.tradingwithrayner.com/how-to-trade-counter-trend-trades-safely-and-profitably/
Cheers!