
Candlestick patterns are among the most discussed topics in trading circles…
…but why?
Well, because they are the key to understanding what story the market is trying to tell you!
Do you wish there was a candlestick pattern that could offer insight into market reversals?
Or one that could indicate when bears have gained control over bulls?
If the answer is yes – today is your lucky day!
It’s exactly what the Dark Cloud Cover Candlestick Pattern can help you with.
In this article, you’ll:
- Discover what the Dark Cloud Cover Candlestick Pattern is and the different shapes and sizes it can take.
- Explore the markets where the Dark Cloud Cover Candlestick Pattern can be found and learn how to trade it in various market conditions.
- Learn diffrerent startegies for actively trading the markets with real-life examples.
- Understand the limitations of the Dark Cloud Cover Candlestick Pattern and situations where it’s best to avoid trading it
Sound good?
Let’s dive in!
What is the Dark Cloud Cover Candlestick Pattern?
The dark cloud cover candlestick pattern involves just two candles and acts as the opposite of the piercing pattern.
So, while the first candle is bullish and can take various shapes and sizes…
…it’s the second candle that matters most!
It needs the price to open higher than the previous day’s close and then drop more than halfway down the previous candle.
While this might sound a bit tricky, looking at examples can help clear things up.
Let’s check out a few to make things easier to understand…
Dark Cloud Cover Candlestick Pattern Diagram:
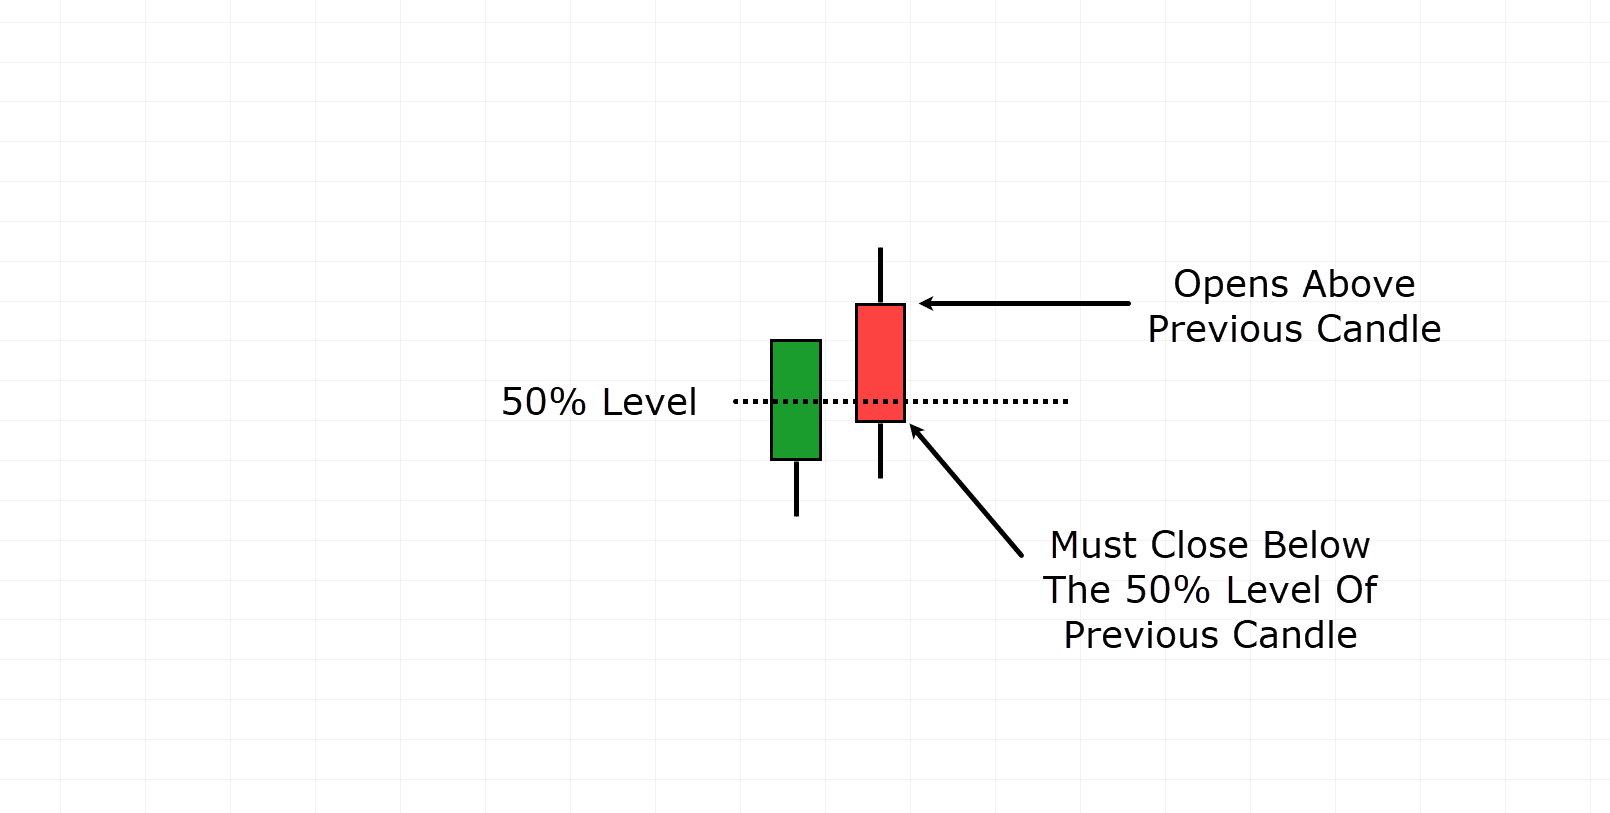
In this example, the price initially rises with bullish momentum, followed by the next candle gapping up.
However, within the same candle, the price must then fall and close below the 50% level of the previous candle.
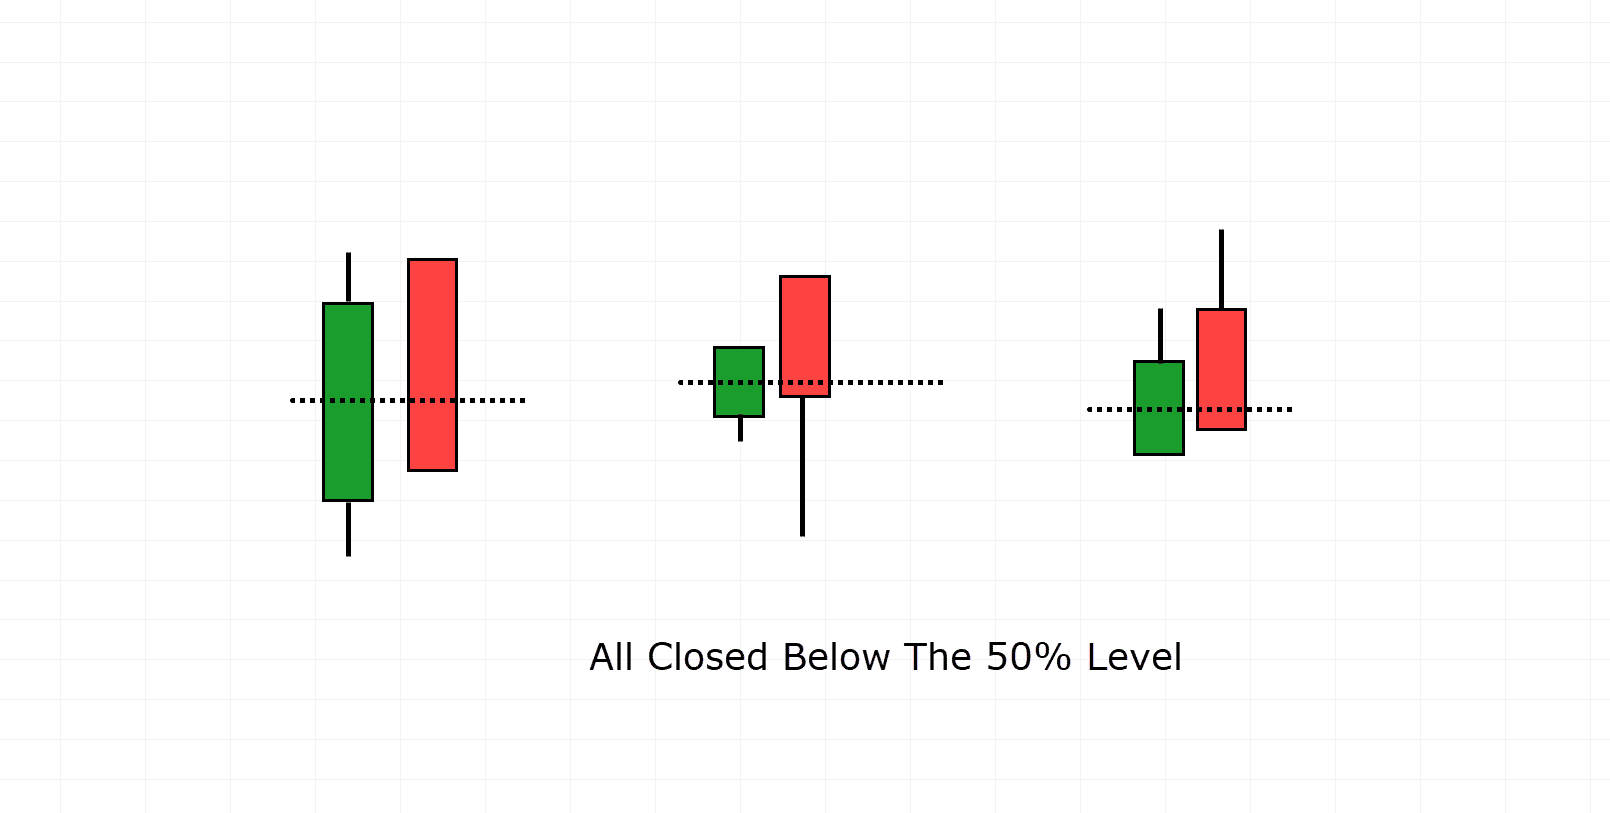
To show the various scenarios where this might happen, take a look at this diagram…
Dark Cloud Cover Candlestick Pattern Examples:
The importance of this candlestick pattern lies in how the market reacts to it.
Consider this: the first candle signals bullish strength, setting a positive tone for the next day.
The bullish momentum is so strong that the price opens higher than the previous close, creating a price gap—a clear indicator of bullish dominance!
However, as time progresses, the price gradually falls below the 50% level of the bullish candle and closes…
This shift demonstrates that despite the initial bullish momentum, the bears managed to overpower the bulls, negating the previous day’s gains, even with the added boost from the gap up.
At this point, any bullish investors may start to question their positions, as momentum swings back in favor of the bears…
…well, I know I would!
However, it’s also worth noting that the higher the price gaps up and then returns below the 50% level, the stronger the signal becomes.
Think of it as the price having extra bullish momentum that gets wiped out within the same session, effectively swinging the momentum in favor of the bears!
Distinguishing Between Engulfing and Dark Cloud Cover Patterns
It’s important to understand that if the second candle completely engulfs the entirety of the preceding bullish candle, it’s not a dark cloud cover pattern but rather a bearish engulfing pattern.
Check out these examples…
Dark Cloud Cover Vs Bearish Engulfing:
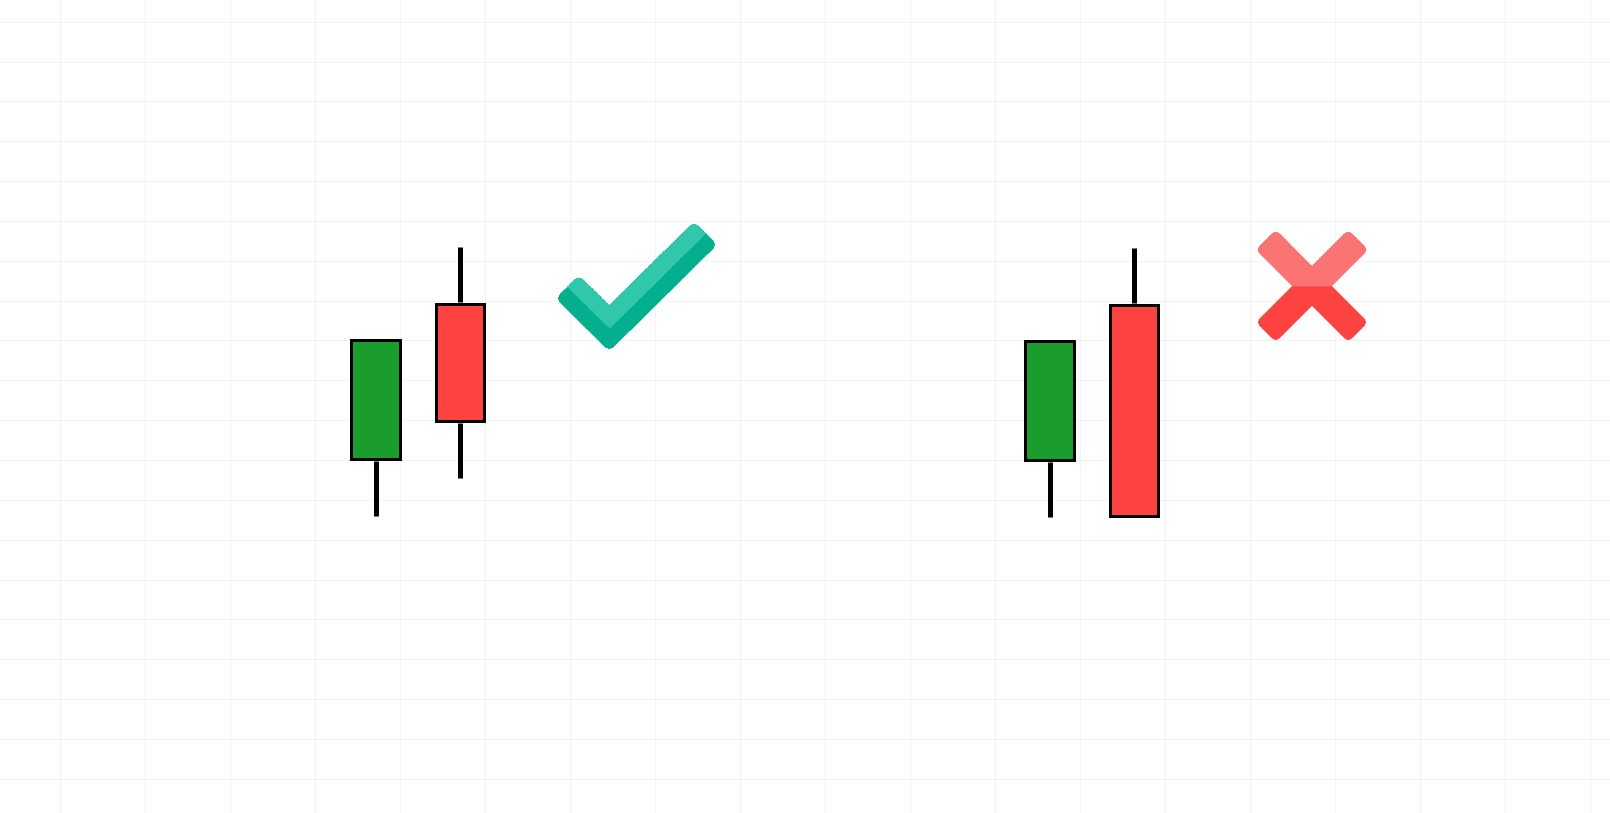
On the left side is an illustration of the Dark Cloud Cover candlestick pattern, while on the right side, you can see the bearish engulfing pattern.
The bearish engulfing pattern represents a stronger bearish signal, but unlike the Dark Cloud Cover pattern, it doesn’t require a gap-up and follows its own set of rules and strategies.
What markets can the dark cloud cover be used in?
The dark cloud cover candlestick pattern can be used across all markets, but it is most frequently seen in stocks.
The reason is that stocks tend to exhibit more price gaps from one day to the next – due to their daily open and close.
In contrast, forex markets typically experience gaps only on very low timeframes or over weekends.
Personally, I typically use the Dark Cloud Cover pattern in stocks, as it occurs more frequently in this market – so there’s less searching to do.
Ranging Markets
Often, the Dark cloud cover candlestick pattern is associated with trend reversal, and although true, I like to view the pattern as a sign of rejection.
It can be applied to all market conditions, including trending and ranging scenarios.
For example, when the price revisits a range high, finding a Dark Cloud Cover pattern can be a valuable indicator of potential price movement.
This suggests that, despite bullish momentum, price failed to break above the range high.
Given that the range high area represents an area of value and the Dark Cloud Cover pattern emerges, it’s reasonable to assume that price might experience a brief retracement, presenting a favourable trading opportunity…
…and that’s what we’re looking for, right?
Trending markets
In trending markets, the dark cloud cover pattern offers various trading opportunities.
The most obvious would be its role as a reversal pattern at extreme highs.
This often happens when price encounters a significant resistance level on a high timeframe, following a prolonged uptrend.
Similar to the ranging example, if price demonstrates rejection at a major resistance level, it’s reasonable to assume some selling pressure is going to come with it.
Another scenario in trending markets happens when price is already in a significant downtrend and experiences a brief pullback.
Utilizing the dark cloud cover pattern here can help you time your entry to capture a trade opportunity that might have been missed earlier.
In addition, the dark cloud cover pattern can even be applied in counter-trend trades.
While this approach does take practice, it can still be useful for finding minor reversals within trends, helping you time your exits or start short positions in certain assets.
Guide on how to trade the pattern
Alright then! So how do you actually trade this pattern?
Well, there are a few important things to think about before you begin.
Firstly, you must always trade the dark cloud cover pattern in the context of the overall market.
You shouldn’t blindly take every dark cloud cover pattern without a strong understanding of what the market is doing and its overall position in the bigger picture, that’s for sure!
Instead, you should ask yourself:
- Is price approaching a resistance level?
- Is it trending and reaching a major area of value?
- Is there a pullback in a downtrend?
All of these questions should be thought about when deciding how to use the dark cloud cover pattern in your trading strategy.
Understanding the market context helps you make more informed decisions and increases the chance you’ll make a successful trade.
Using other Technicals
As always, the dark cloud cover candlestick pattern should not be used in isolation; it must be combined with other triggers and technical analysis tools.
This could include a moving average crossover or identifying a key resistance level.
For instance, you might observe a dark cloud cover pattern at a Fibonacci retracement level.
Regardless of the specific technical indicator or trigger you use, it’s vital not to rely solely on the pattern in isolation!
By using it with other technical analysis tools, you gain a much better overview of what the market is doing, making your trading decisions more effective.
Confirmation
Another crucial concept to consider is waiting for extra confirmation.
Now, this could be as straightforward as observing the next candle after the pattern forms…
Confirmation Candlestick Example:
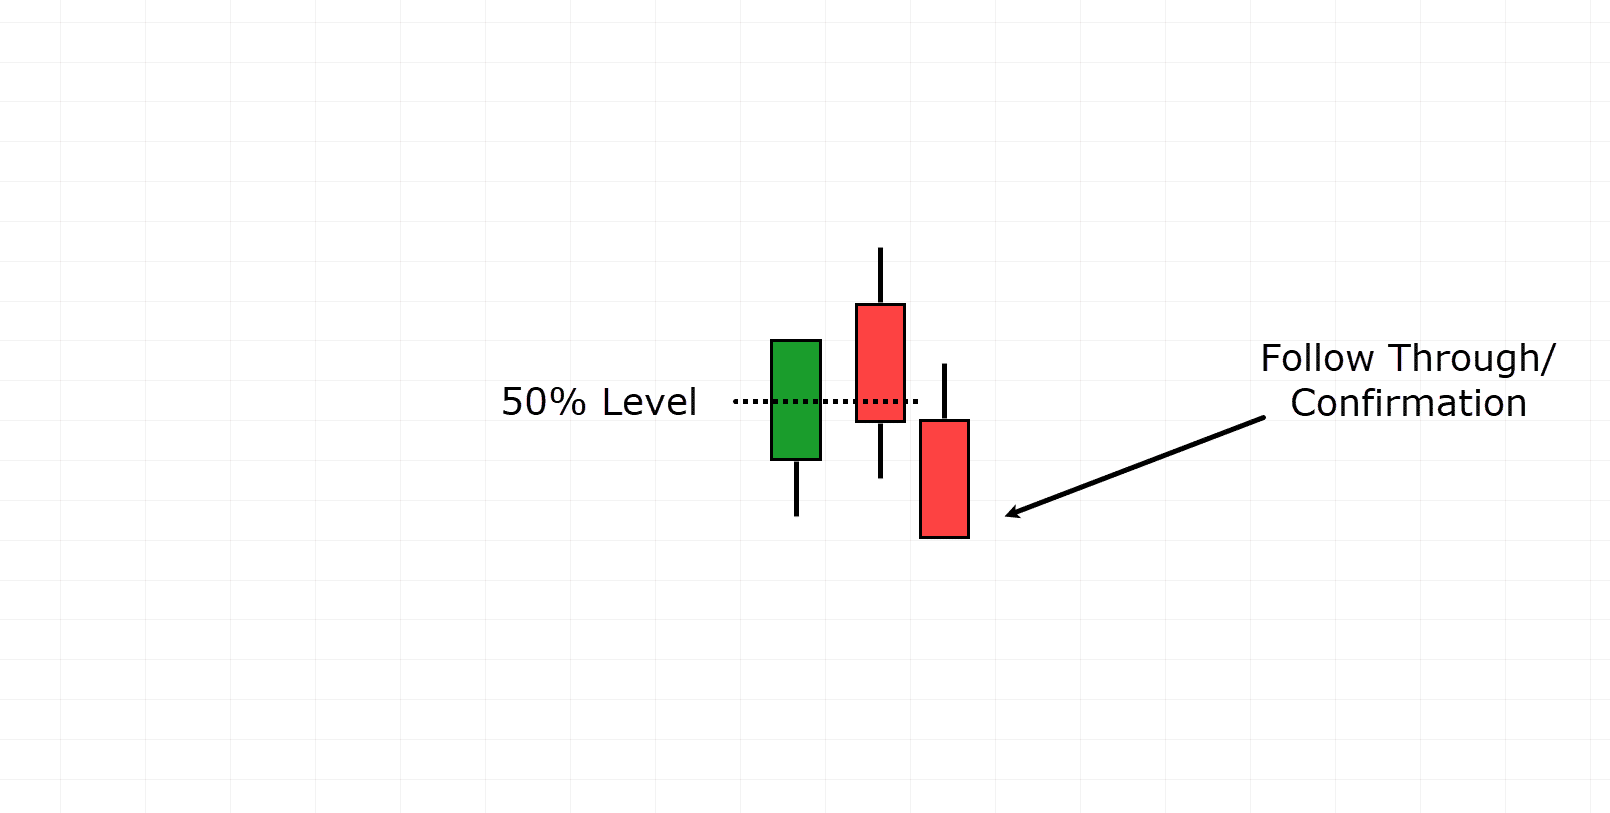
For example, if the following candle exhibits bearish follow-through, the price will likely continue to decline further.
While waiting for confirmation may mean missing out on entering the trade immediately after the pattern occurs, it can provide extra peace of mind – increasing confidence in your trading decisions.
This method helps ensure that you enter trades with greater conviction and reduces the risk of entering prematurely.
Volume Confirmation
Finally, adding some volume confirmation brings another dimension to trading the dark cloud cover pattern.
Increased volume on both the bullish and bearish candlesticks in this pattern strengthens the likelihood of a successful reversal.
Higher volume means heightened activity, indicating that bulls and bears are fighting for control in that area of the market!
While not a requirement for trading the pattern, the heightened volume provides extra confirmation of the reversal signal.
It adds another layer of confidence and strengthens the validity of the trading setup.
Alright, now that you know how to identify the pattern, let’s delve into some real examples to help you successfully trade it in the market!
Trading Strategy For Ranges
Daily PayPal Holdings Chart Range:
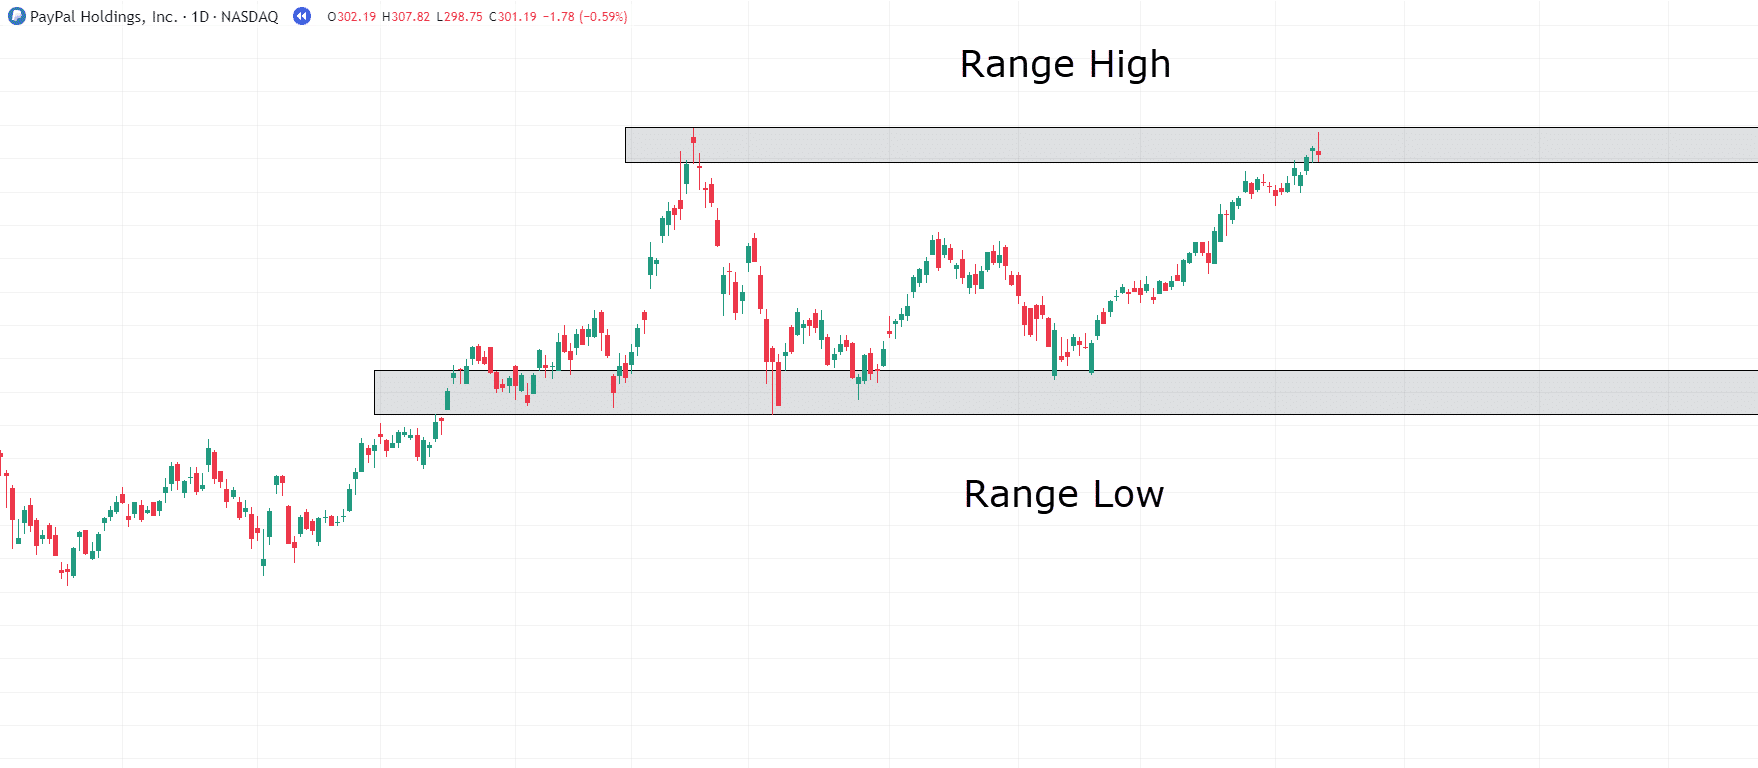
In this Daily PayPal Holdings chart, PayPal exhibits a range after a considerable uptrend.
Price has established a distinctly higher level before retracing to the same level multiple times.
As the price returns to this range high, it suggests that this area of value could potentially act as a resistance level.
Let’s take a closer look…
Daily PayPal Holdings Chart Resistance Test:
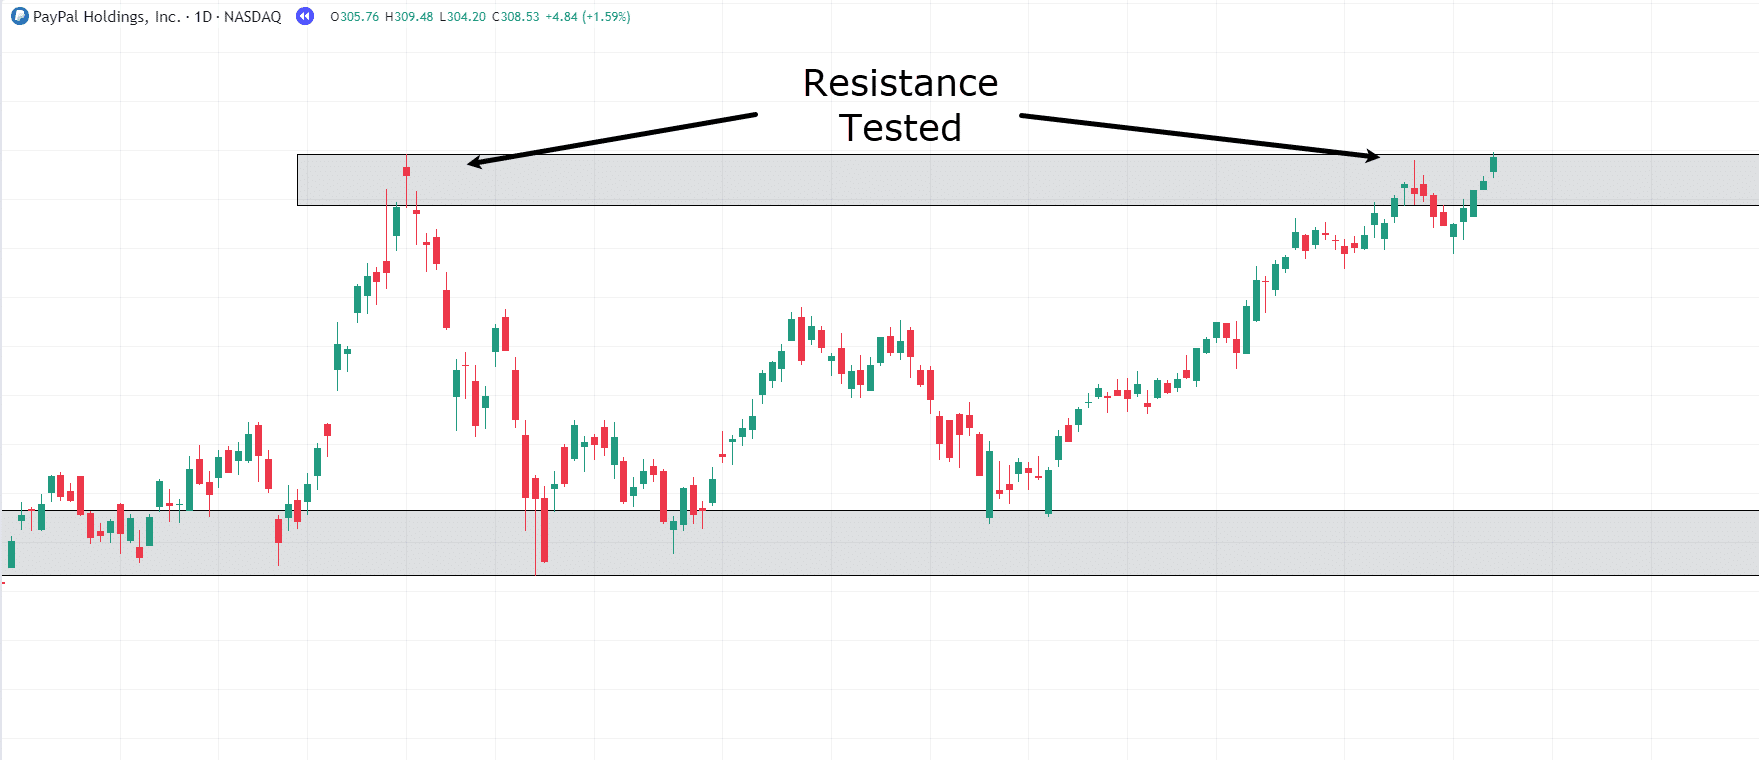
At the resistance level, the price forms an inverted Hammer, indicating some rejection. However, the price subsequently returns to the zone again.
At this point, it’s challenging to determine whether the bulls or bears have control!
Therefore, it’s best to wait a bit longer to see if the market provides additional information…
Daily PayPal Holdings Chart Dark Cloud Cover Formation:
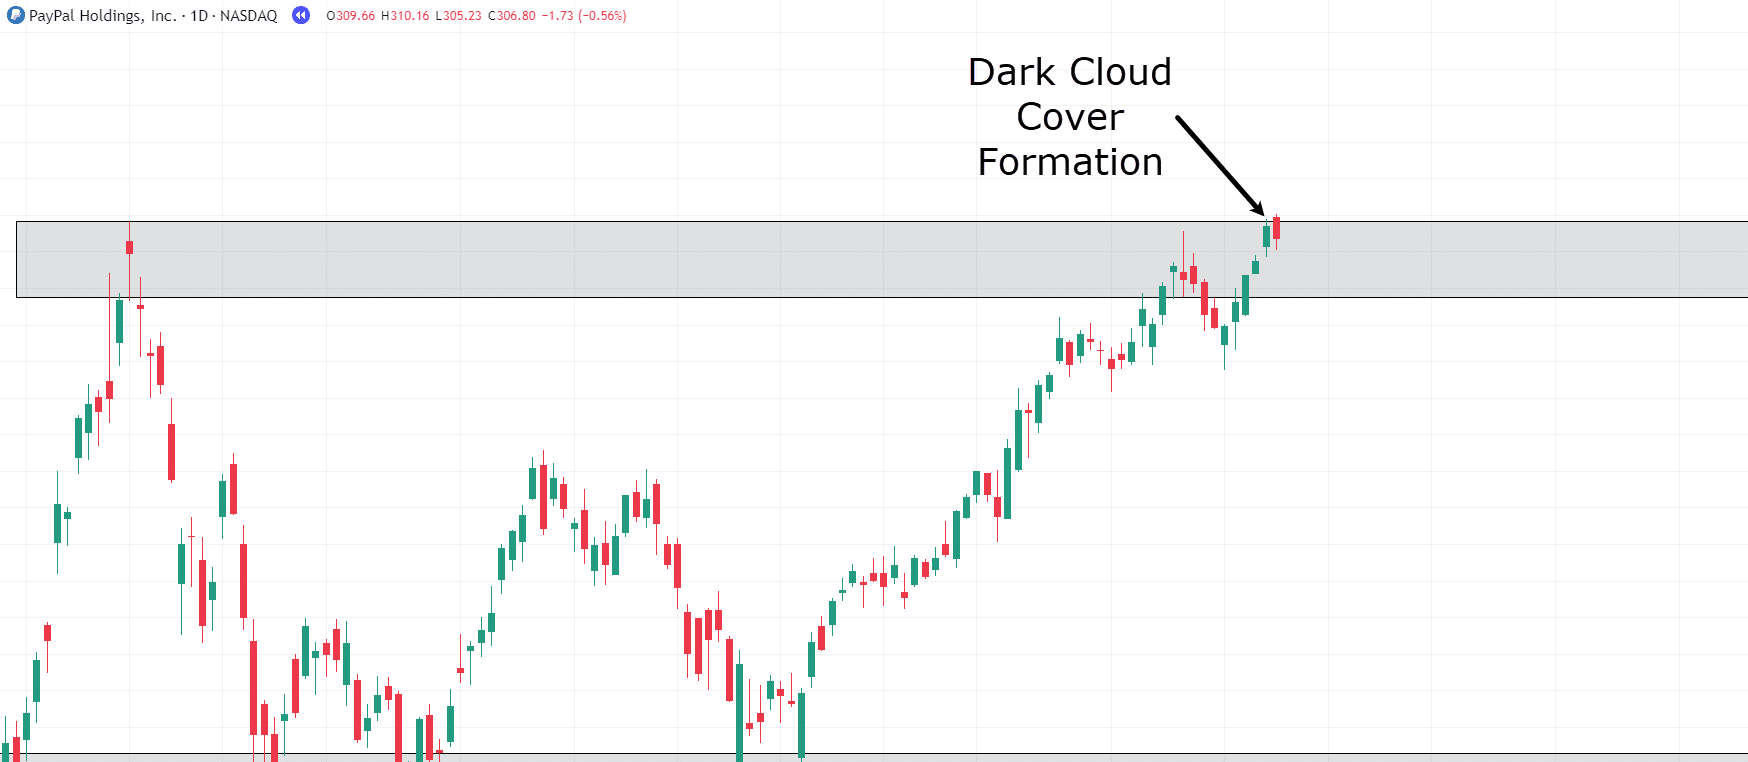
So the next day, the price gapped up but closed around the 50% level of the previous candle.
This happened at resistance, which has witnessed a couple of rejections already…
So…. what am I waiting for, right?
“…Let’s pull the trigger, Rayner!”
“…Take the trade!”
Of course, it might seem very tempting to jump right in…
…However, it’s crucial to remember the importance of confirmation!
Price has swiftly returned to this level, and it might be a good idea to wait for additional confirmation showing that this level will remain a strong resistance level.
Let’s take a closer look at what unfolds next…
Daily PayPal Holdings Chart Dark Cloud Cover Confirmation:
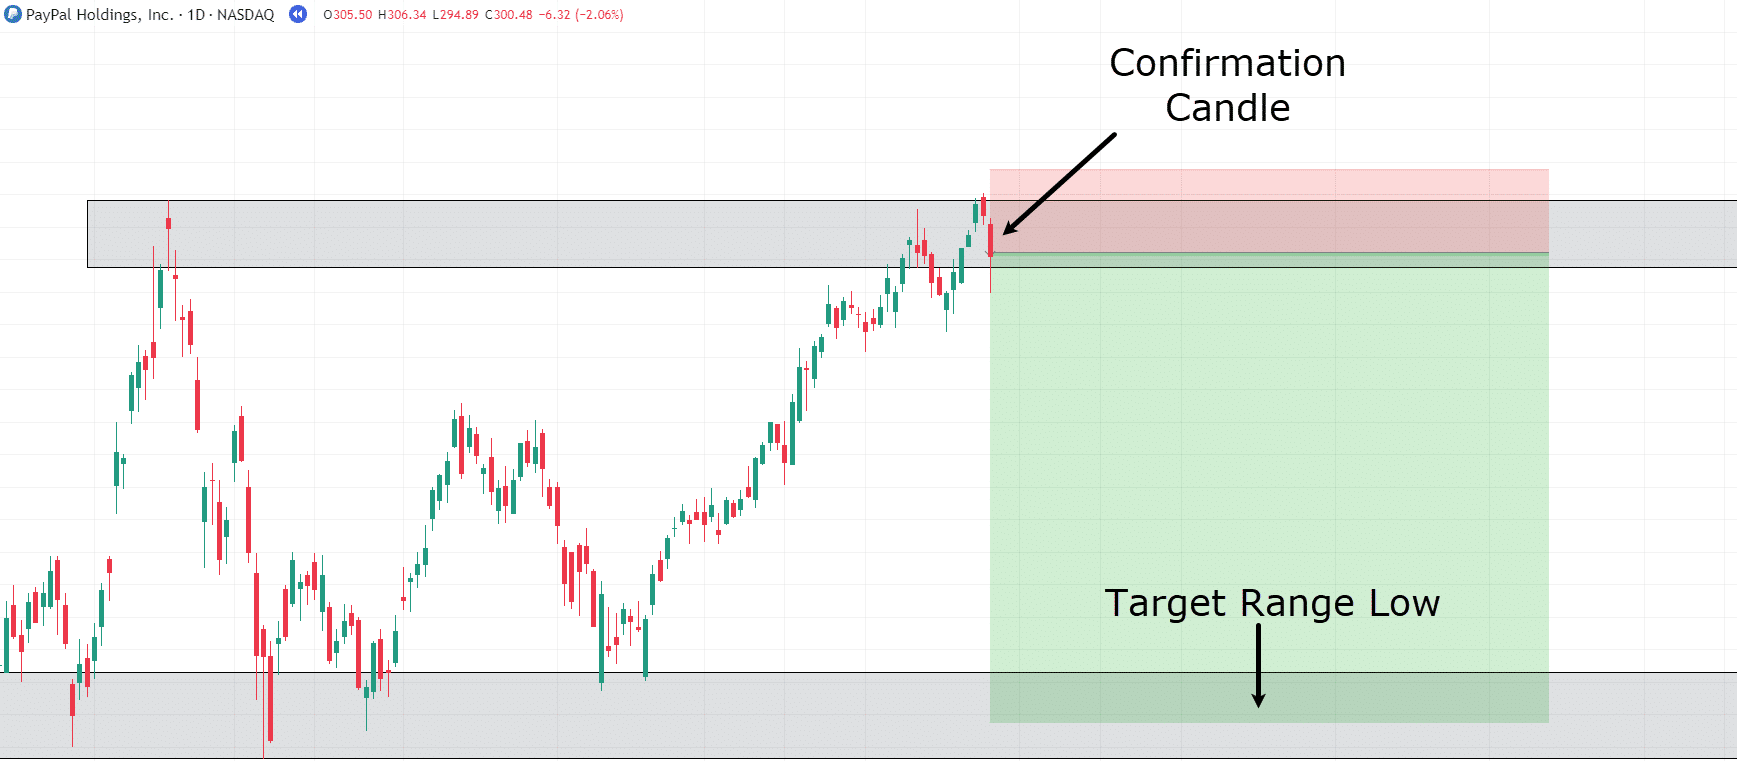
OK, with the strong bearish confirmation candle now in place, there’s more confidence that this resistance level will likely hold, right?
Now is the time to enter the trade and target the range low for our take profit!…
Daily PayPal Holdings Take Profit:
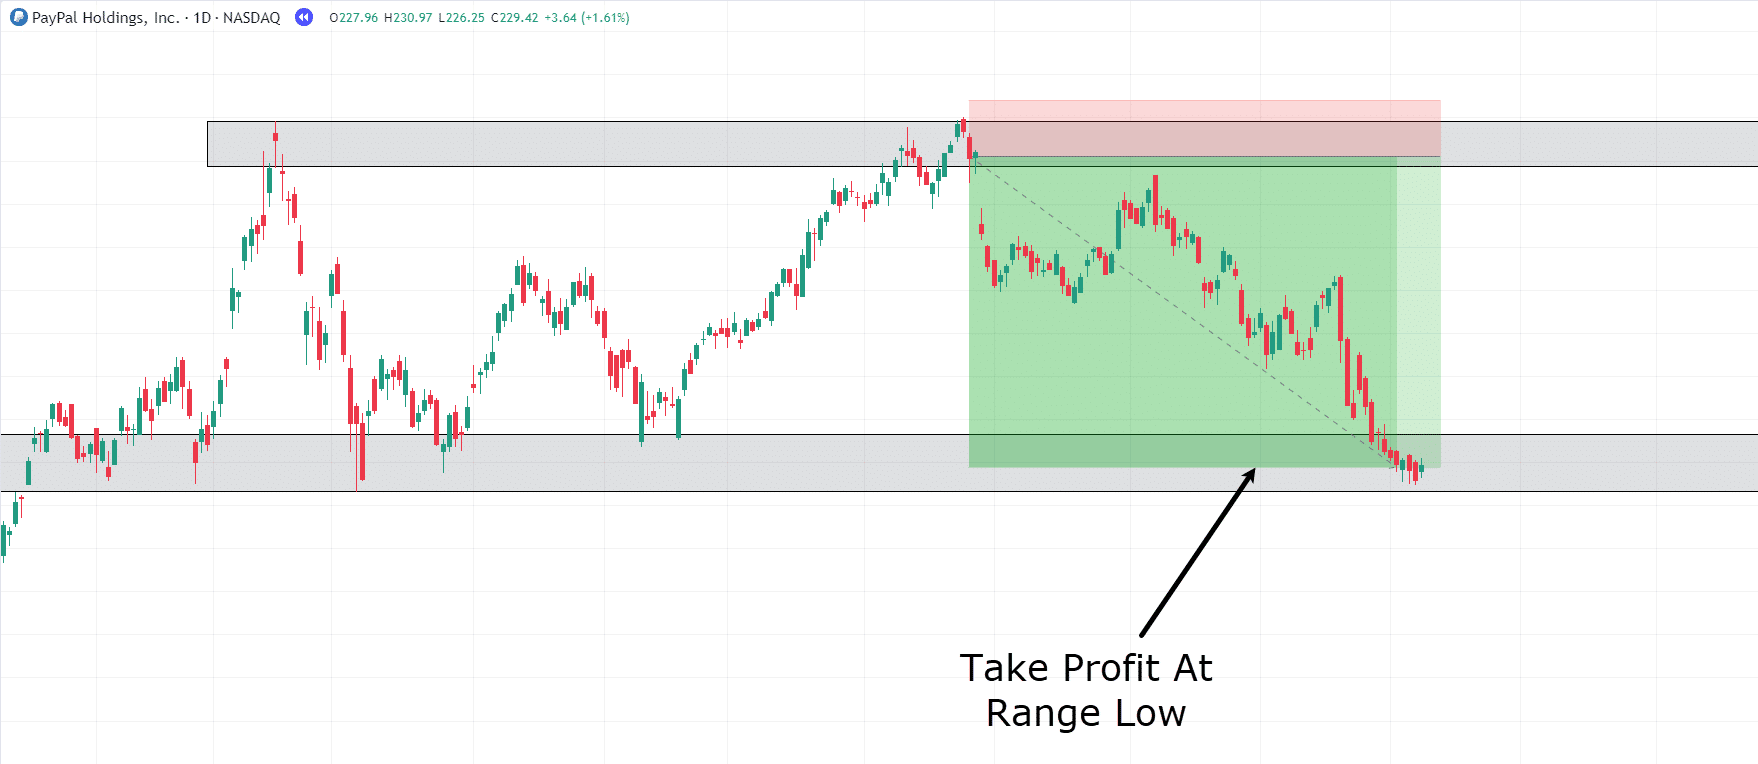
…and Congratulations!
You just successfully traded the Dark Cloud Cover in a range!
However, let’s face it, markets don’t always range like this, do they?
So let’s discuss how you might use this in a trend trading situation!
Trend Trading Example
Daily CleanSpark Downtrend Chart:
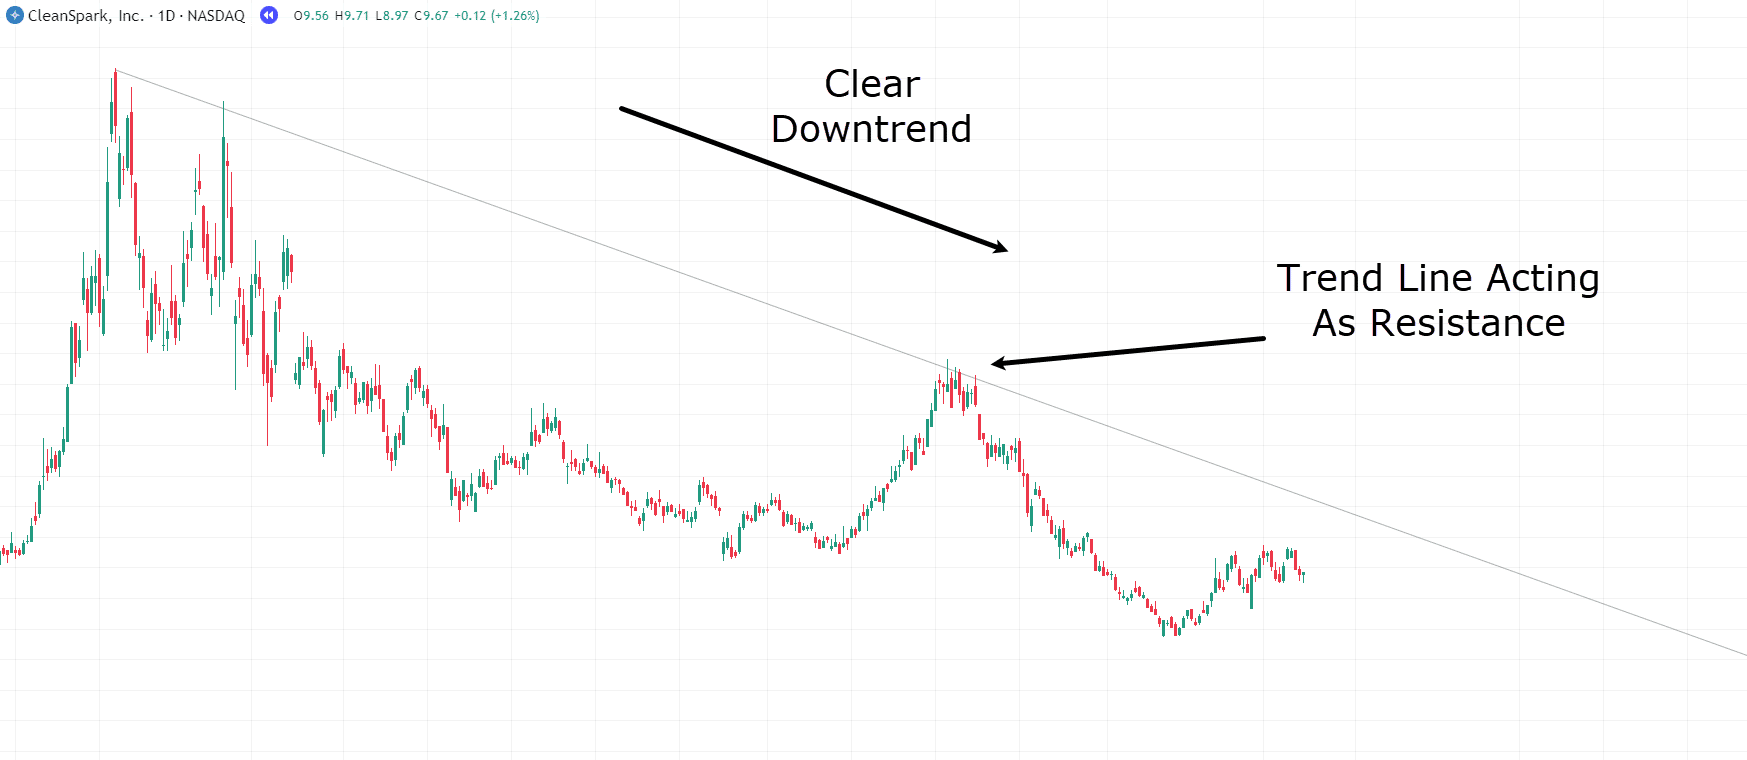
On the daily timeframe, CleanSpark Inc. is clearly in a strong downtrend.
The trendline serves as a guide to where price might encounter resistance in the future.
Let’s take a look at what unfolds next!…
Daily CleanSpark Dark Cloud Cover Formation:
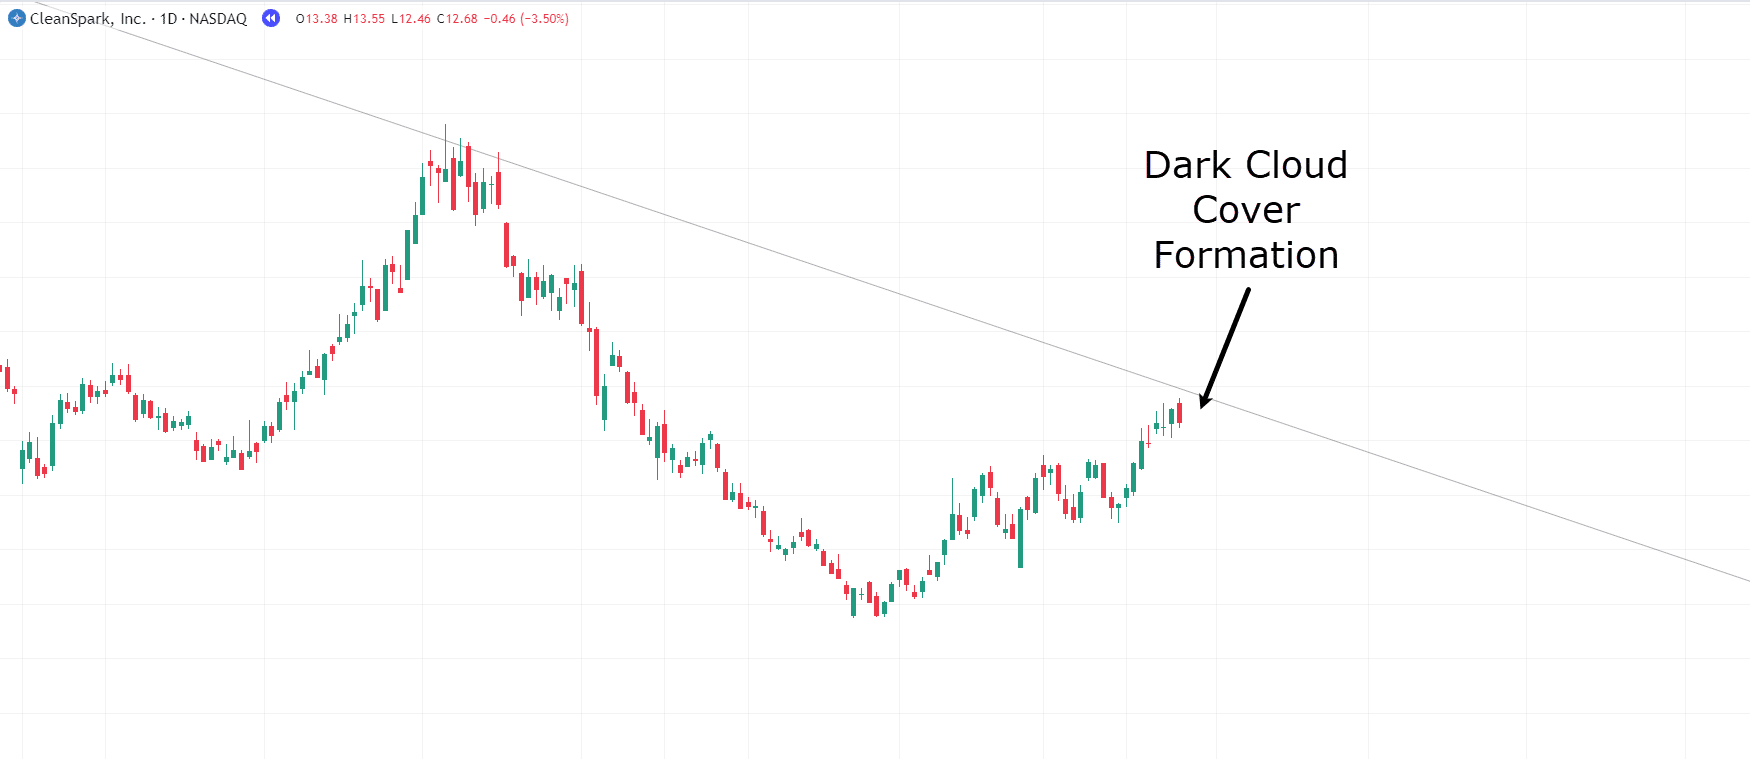
Once again, price has gapped up but failed to sustain higher levels, closing below the 50% mark of the previous candle.
Similar to the previous instance, let’s exercise patience and wait for further confirmation…
Daily CleanSpark Dark Cloud Cover Confirmation:
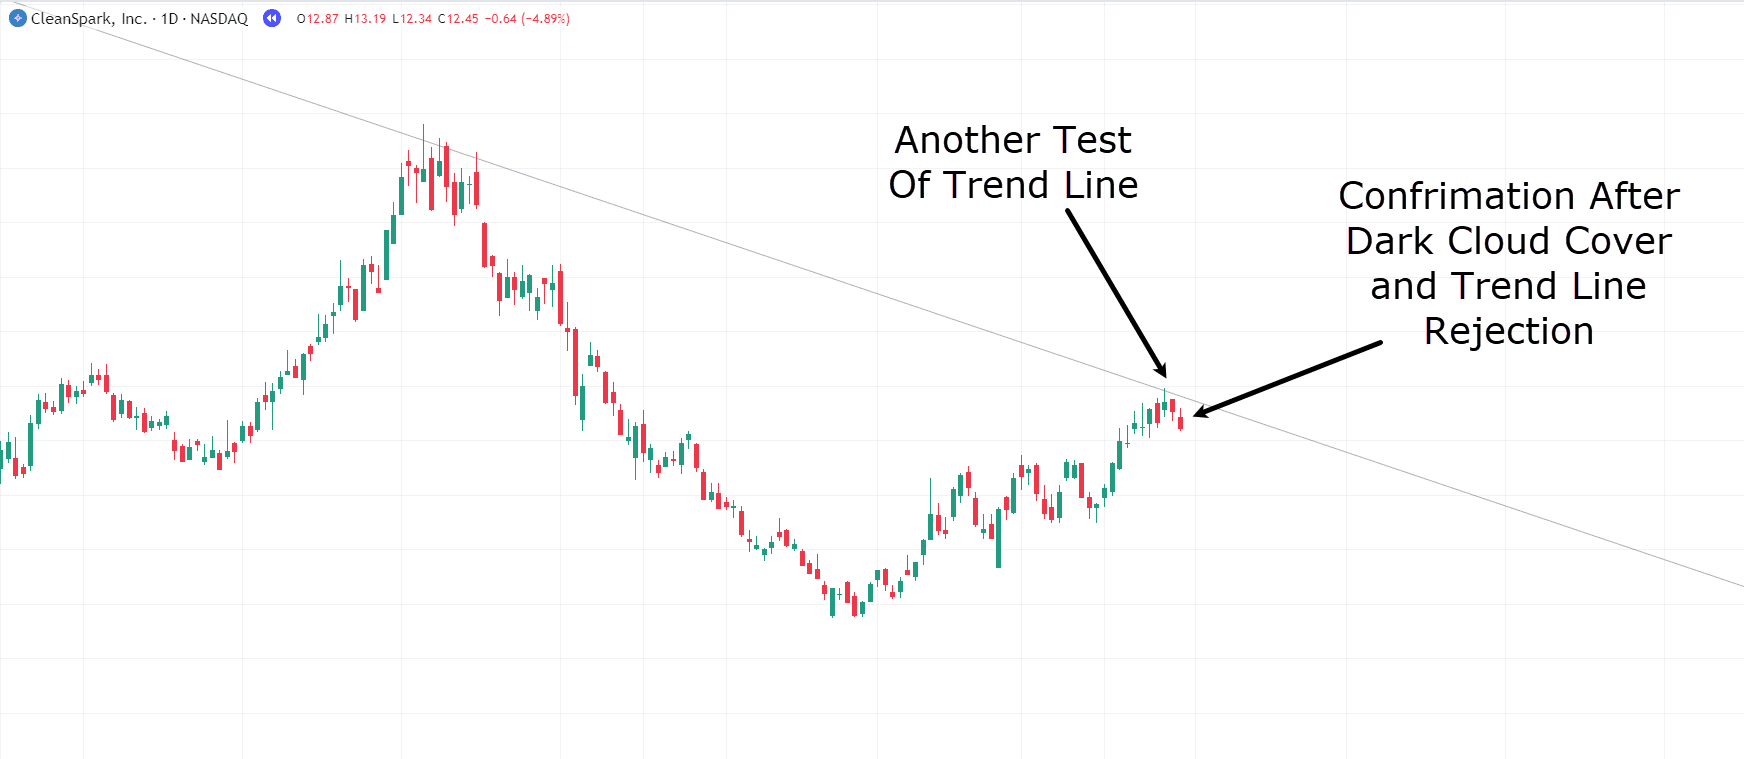
While price did not confirm the reversal immediately and instead retested the trendline, it did eventually fall below the pattern.
Now at this point, you have multiple factors in your favor:
- Price is rejecting the strong daily trendline
- Price has formed the Dark Cloud Cover Rejection pattern at this level.
- Price has begun to fall away from the trendline.
- Downtrend momentum is on your side!
So let’s get to it and take this trade!…
Daily CleanSpark Dark Cloud Cover Entry:
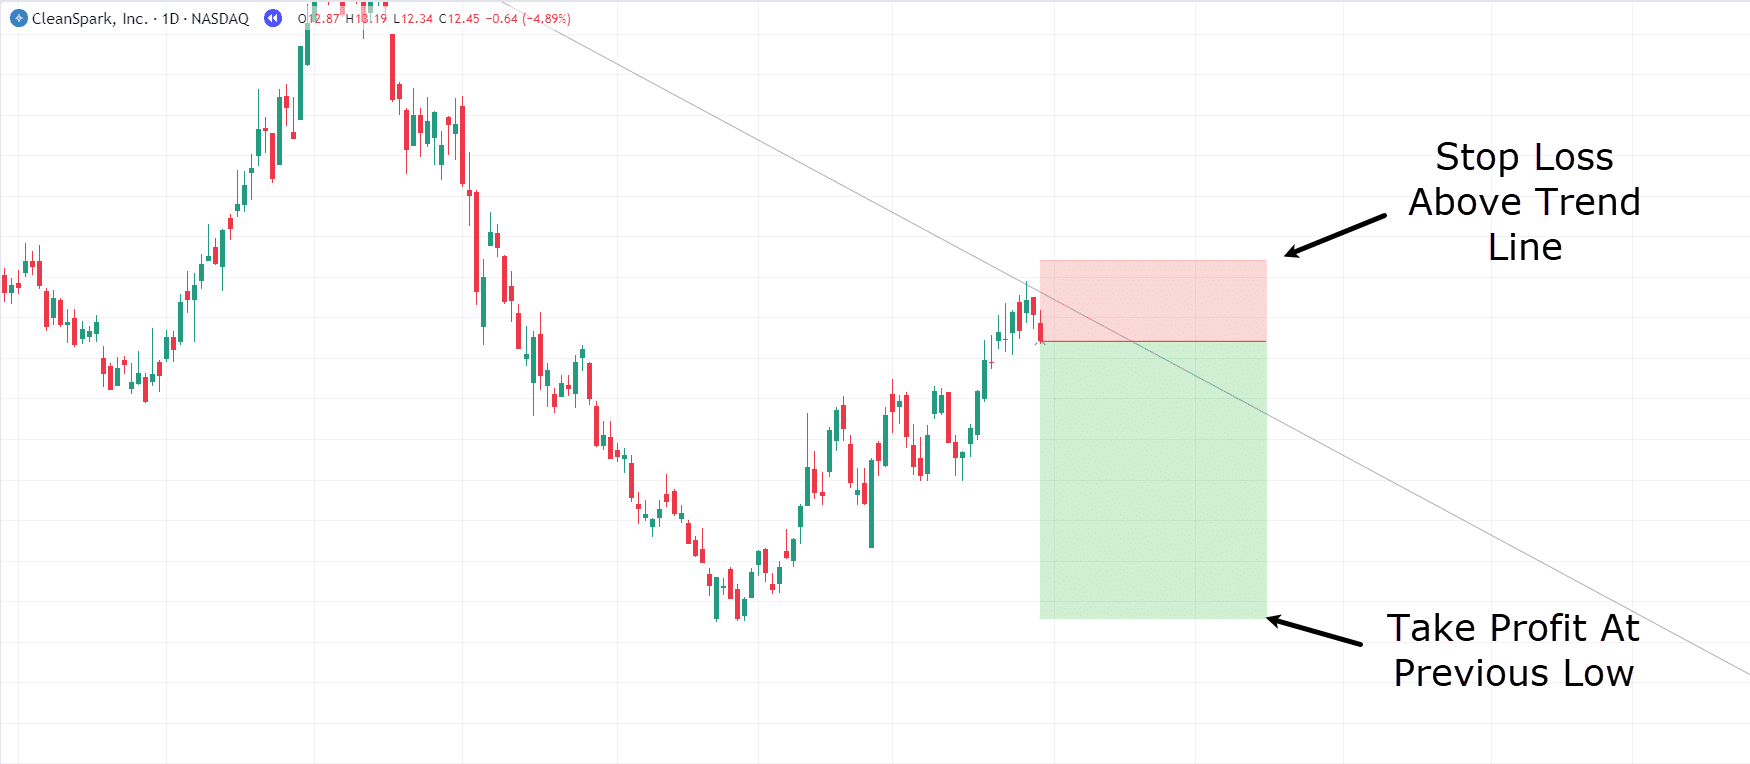
For the stop loss, placing it just above the trend line allows room in case price continues to test the trendline.
That way, if price breaks above the trendline, the trade is no longer valid, and exiting would be prudent.
As for take profits, I think taking them at the previous low seems logical.
Make sense?
Good!
Let’s see what happens next…
Daily CleanSpark Dark Cloud Cover Entry:
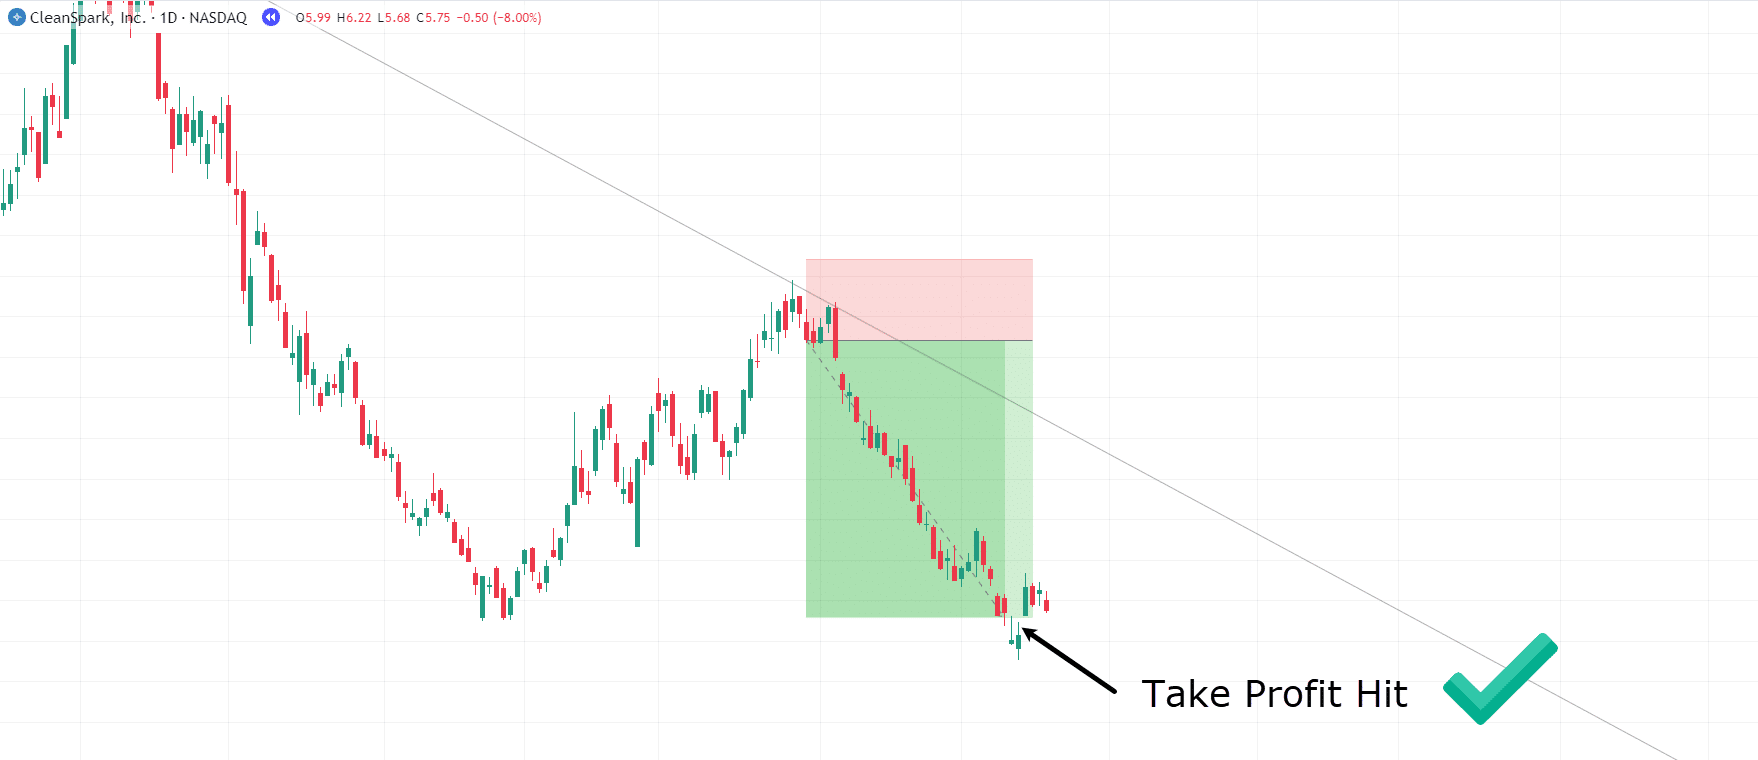
Wow! Congratulations on another successful trade!
You can see how this approach can be an effective method for leveraging the downtrend momentum of higher timeframes to capture profits in shorting scenarios.
OK – let’s explore one last example…
Daily JP Morgan Chase & Co. Chart:
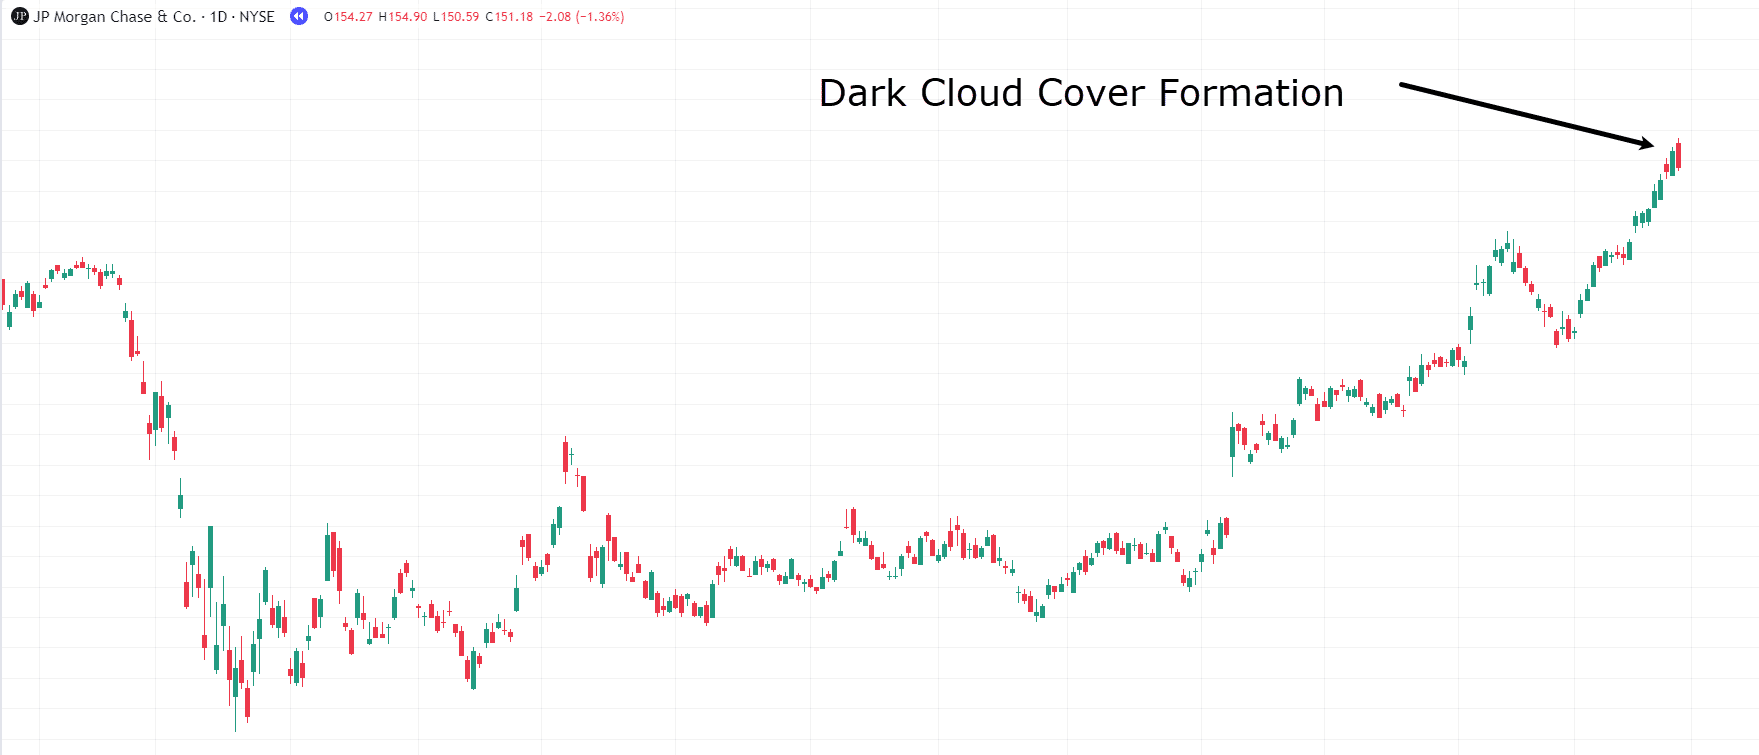
Once again, the Dark Cloud Cover formation is observed.
As usual, it’s advisable to wait for one extra candle of confirmation before considering this trade…
Daily JP Morgan Chase & Co. Entry:
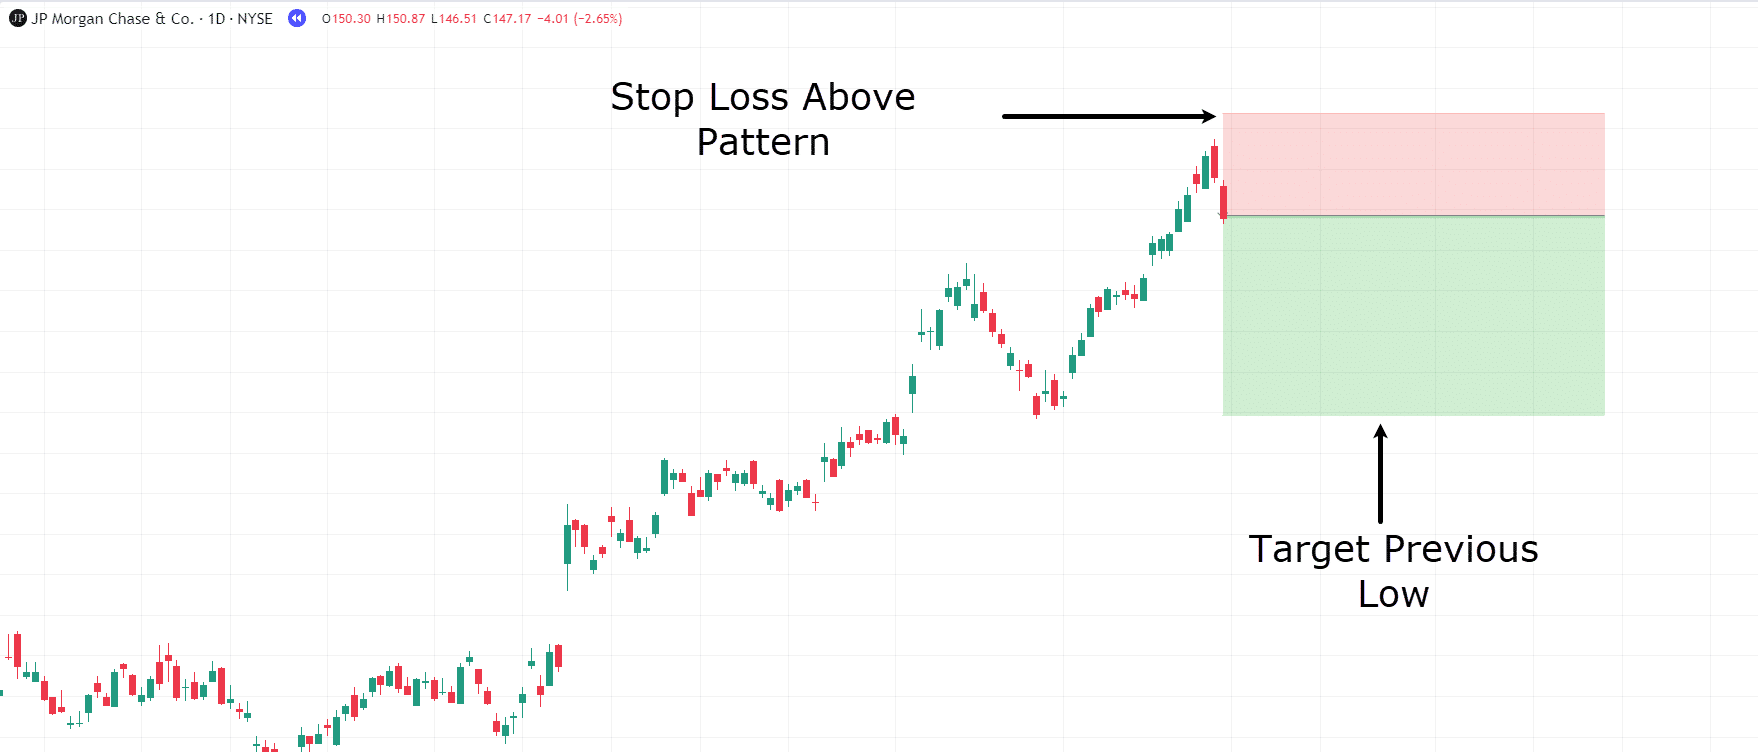
With the confirmation now in place, it’s time to take the trade.
The target remains the previous lows, as seen in our other examples, and the stop loss should be set just above the pattern…
Daily JP Morgan Chase & Co. Trade Management:
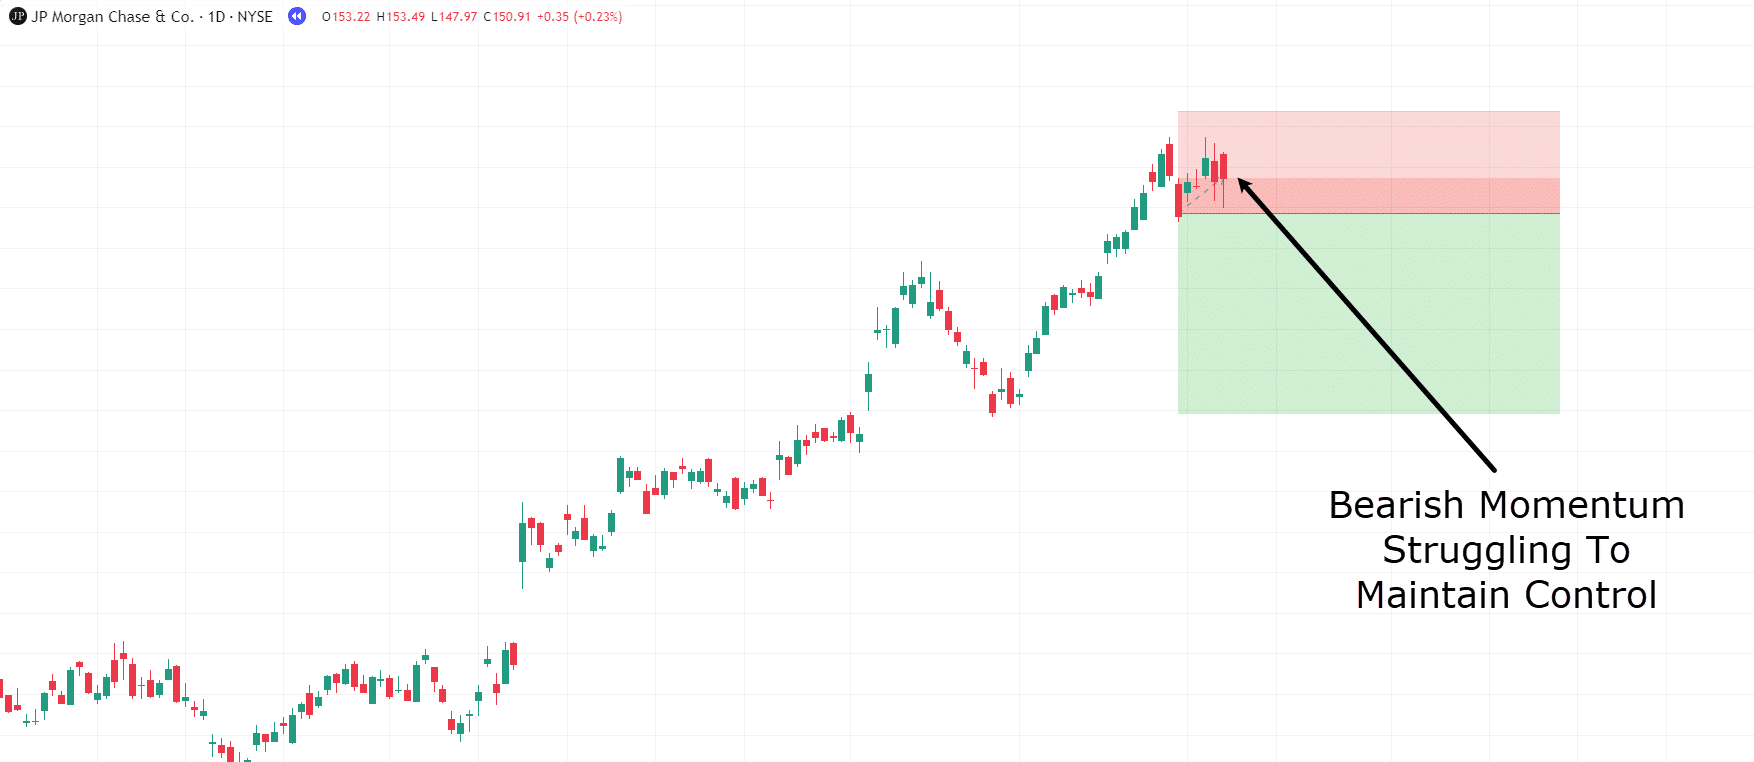
But do you notice something interesting occurring here?
Price isn’t behaving as expected following the Dark Cloud Cover pattern…
With bearish momentum struggling to maintain control, this may be cause for concern.
Still, to follow things through, let’s stick with the trade and see what develops…
Daily JP Morgan Chase & Co. Trade Stop Out:
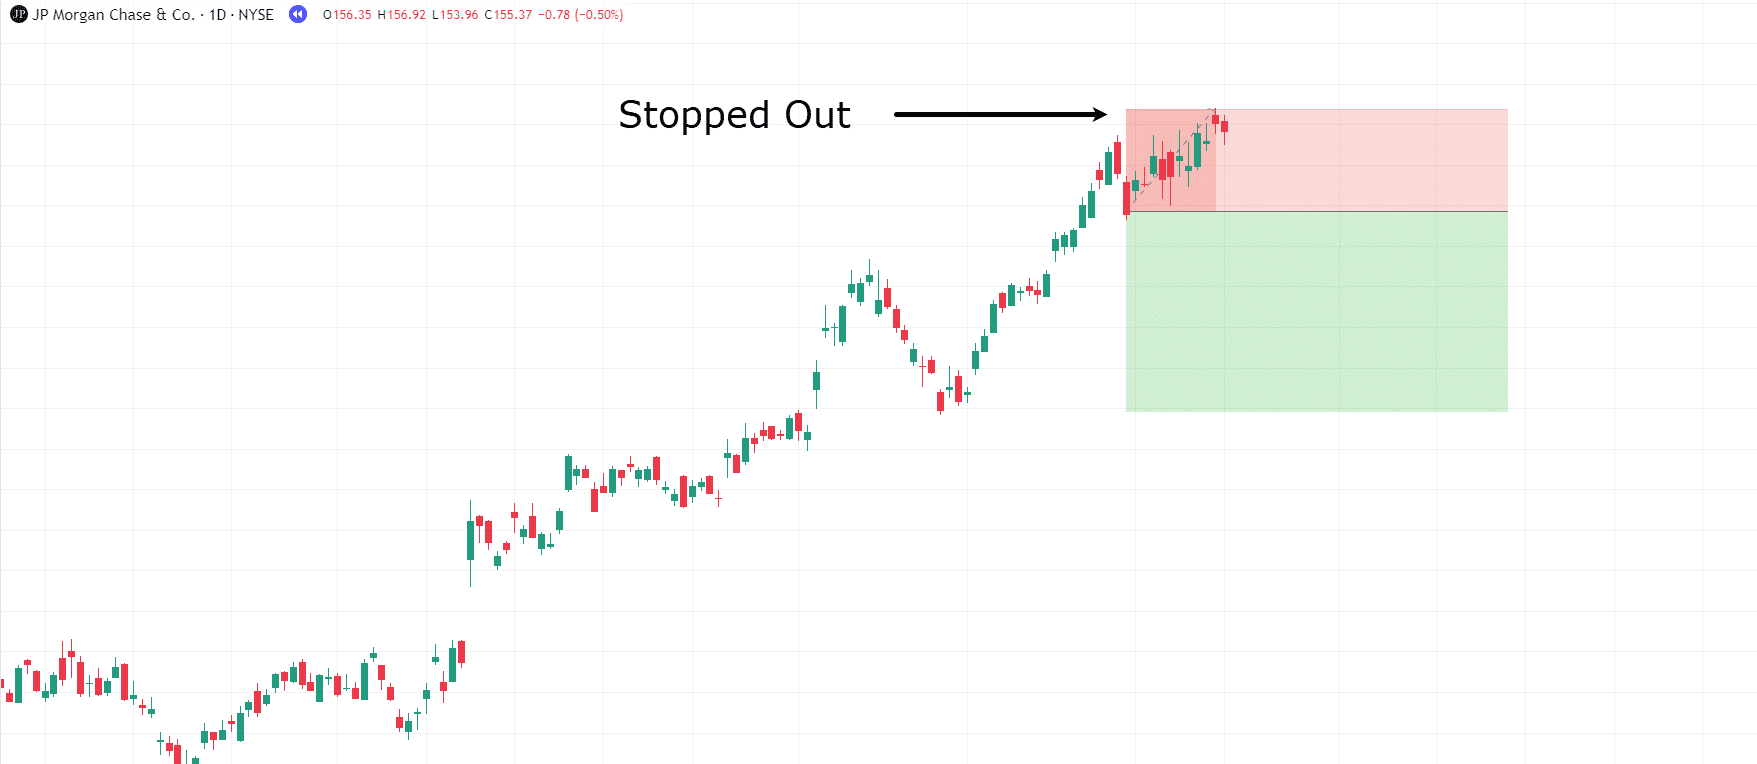
Oh no!
You got stopped out!
But it’s not all bad news, as there’s a valuable lesson to be learned here.
You might have already realized, but let’s analyse whether this was truly a good trade to take…
Daily JP Morgan Chase & Co. Trade Analysis:
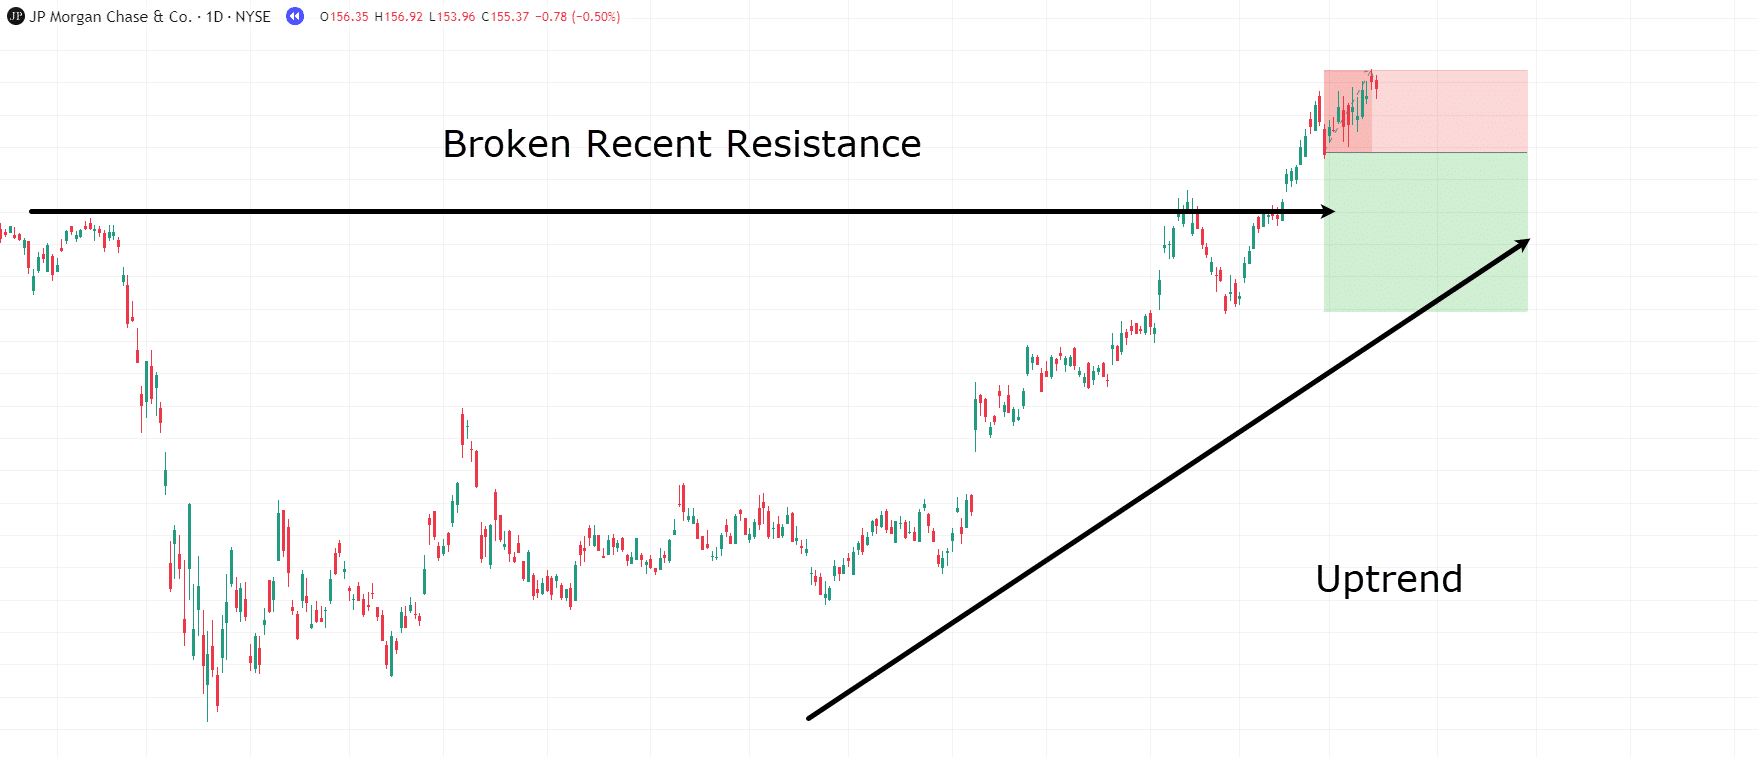
After some reflection, there were several important points which needed to be looked at more carefully before entering the trade…
Firstly, throughout this article, you’ve learned that you can’t simply trade the Dark Cloud Cover Pattern whenever it appears on your chart.
You need other technical indicators to assist you in making that trade.
However, there are even more apparent reasons why this trade did not work out.
For one, the strong resistance level was recently broken, and the pattern didn’t occur at the resistance level…
…it occurred well after bullish momentum had pushed through it.
This suggests that the bulls have considerable control, as shown by their ability to break the resistance level with significant follow-through.
Furthermore, when you analyze the bigger picture of the market, it seems safer to classify this chart as being in an uptrend rather than a downtrend.
In other words, more factors were working against the trade than for it.
It’s important to look at the bigger picture.
In this case, the Dark Cloud Cover pattern alone couldn’t outweigh the momentum of other key factors in the market.
Always keep this in mind when spotting the Dark Cloud Cover pattern and deciding whether or not to execute the trade!
Limitations
Cannot Be Used In Isolation
As mentioned previously, the dark cloud cover candlestick pattern cannot be used in isolation.
Trading this formation every time it occurs on the chart would yield very little success.
When used in conjunction with other indicators and technical analysis, it becomes much more reliable!
Pattern Location
Where the pattern occurs is important.
Context of the overall market and its behavior is crucial when considering whether or not to take a trade.
Strong Understanding Of Technical Analysis
The Dark Cloud Cover Pattern requires a deeper understanding of indicators that can assist it.
Because this is a pattern that requires context and other technicals, one limitation is that you need some knowledge of other indicators and technical tools to effectively trade it.
Rarely occurs in certain markets
As stated in the article, gaps are essential to this pattern, making it a rare occurrence in assets like forex.
However, on assets like stocks, where gaps are common, these patterns can occur quite frequently on the daily timeframe.
Conclusion
So, in conclusion, the Dark Cloud Cover Pattern emerges as an invaluable tool in stock analysis.
This pattern serves as a robust entry trigger, shedding light on the ongoing struggle between bulls and bears at key areas on the chart.
By combining the Dark Cloud Cover Candlestick pattern with other technical analyses, traders can accurately identify entries and increase their odds across various market conditions.
This strategic edge offers traders the confidence to decipher market momentum effectively and make informed entry decisions.
To summarize, in this article, you’ve:
- Gained actionable knowlegde about the Dark Cloud Cover Pattern and what it can look like in different scenarios.
- Explored the various market conditions in which the Dark Cloud Pattern can be applied and how it may appear.
- Learned new strategies for trading the Dark Cloud Cover with real-life examples.
- Understood the limitations associated with using candlestick patterns alone and how important contextual analysis is within the overall market
Finally – congratulations!
With this new addition to your candlestick pattern arsenal, I encourage you to find some real-life examples on your charts, grabbing some additional layers of technical analysis to refine your strategies.
I’m eager to hear your thoughts on the Dark Cloud Cover Pattern, too!
Have you used it before, or do you lean towards other reversal patterns for entries?
Which candlestick patterns do you tend to favour?
Feel free to share your insights in the comments below!
Sorry I man confused,this method is for short sellers,not for buyers correct?please advise. Thanks.
God bless you Rayner you’re really making a big impact on me thank you
Happy to hear that, Abdoull!
Very nicely explained, thanks
Thanks, Vikash!