This post is written by Jet Toyco, a trader and trading coach.
Do you know there are many kinds of Fibonacci tools like Fibonacci retracement, Fibonacci channel, Fibonacci time zone, etc.?
But here’s the thing…
Which of these Fibonacci tools matter the most? And more importantly, how do you the Fibonacci for trading so you can get results?
Well, that’s what you’re going to learn in today’s lesson…
What Is The Fibonacci Sequence And The Secret Behind Fibonacci Trading Tools
First, let’s go back to the basics…
What is the Fibonacci sequence anyway?
Where did it originate from?
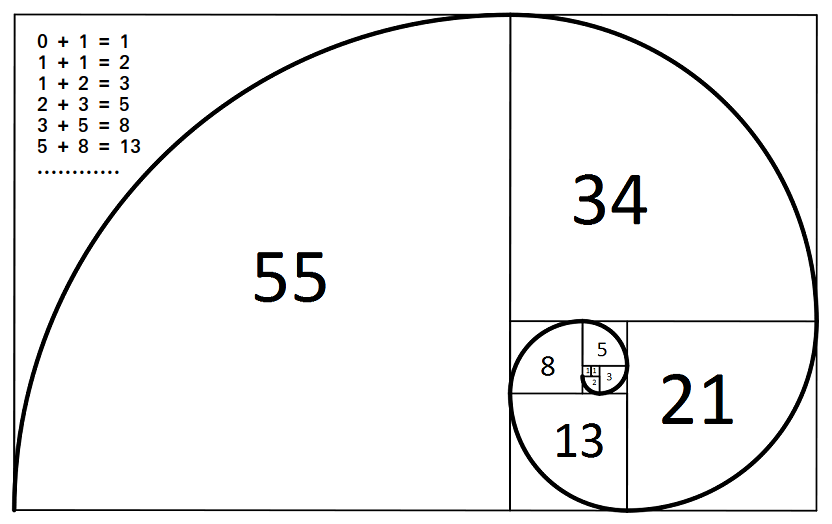
Well, the Fibonacci sequence was first discovered by the mathematician Leronardo Bonacci back in 1202 which follows: 1, 1, 2, 3, 5, 8, 13, 21, 34, 55, 89, 144, 233, 377
Source: geeksforgeeks
To make sense out of all this, how is the Fibonacci sequence formed?
Easy!
It’s formed by adding the two numbers before it.
So, if you add 5 and 8, you get 13 (which is the next in the Fibonacci sequence).
If you add 55 and 89, you get 144, and so on…
Now, a lot people also tend to correlate this sequence with “nature” such as plants…
Source: Cleveland Design
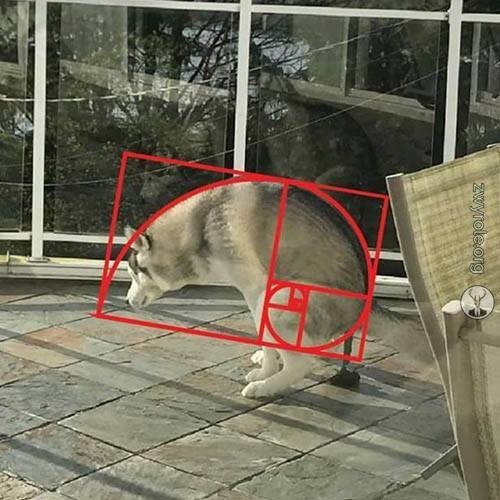
Animals pooping…
Source: Reddit
Your dad’s belly (probably)…
Source: iFunny
And of course…
The financial markets!
Source: My tradingview platform (hah)
But here’s the thing…
Did you know that the numbers on your Fibonacci trading tool aren’t actually the Fibonacci sequence themselves?
Let me prove it to you…
Again, here’s what the Fibonacci sequence look like: 1, 1, 2, 3, 5, 8, 13, 21, 34, 55, 89, 144, 233, 377
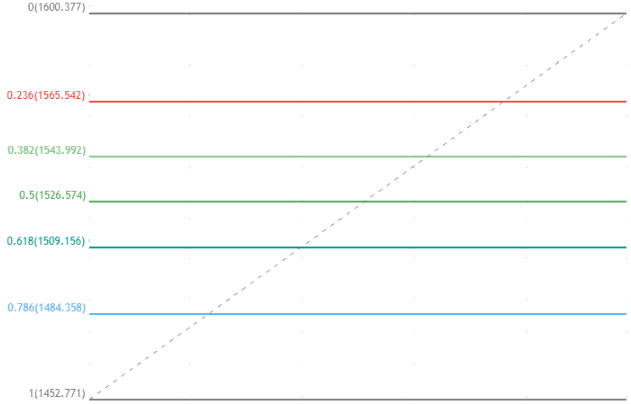
Then here’s what most Fibonacci tools’ numbers look like: 0.236, 0.382, 0.618, 0.786, 0.886, 1.236
Wait, what?
Where did those numbers come from?
The answer is that the numbers we use for your Fibonacci trading tools are “ratios,” and not “sequences.”
If you divide the next number on the sequence which is 21 and 34 for example…
You get 0.6176 (61.8%).
But if you divide the two numbers with a gap between them on the sequence which is 21 and 55 for example…
You get 0.3818 (38.2%).
Now if you think about it, using percentages or ratios in the financial markets are more relevant instead of using the sequence themselves, right?
So now that you know what this whole Fibonacci sequence and ratio is all about…
Let’s dive into how you can use this Fibonacci for trading.
Sounds good?
Then read on!
What Are The Different Fibonacci Trading Tools And How To Apply Them
Despite a whole spectrum of Fibonacci tools out there, these two are the most widely used:
- Fibonacci retracement
- Fibonacci extension
And to be honest, it’s all you need!
(And I’ll show you later how you can use this as a Fibonacci trading strategy)
Now let me briefly explain them and show you how to apply them…
Fibonacci retracement
Besides the numbers being based on the Fibonacci sequence…
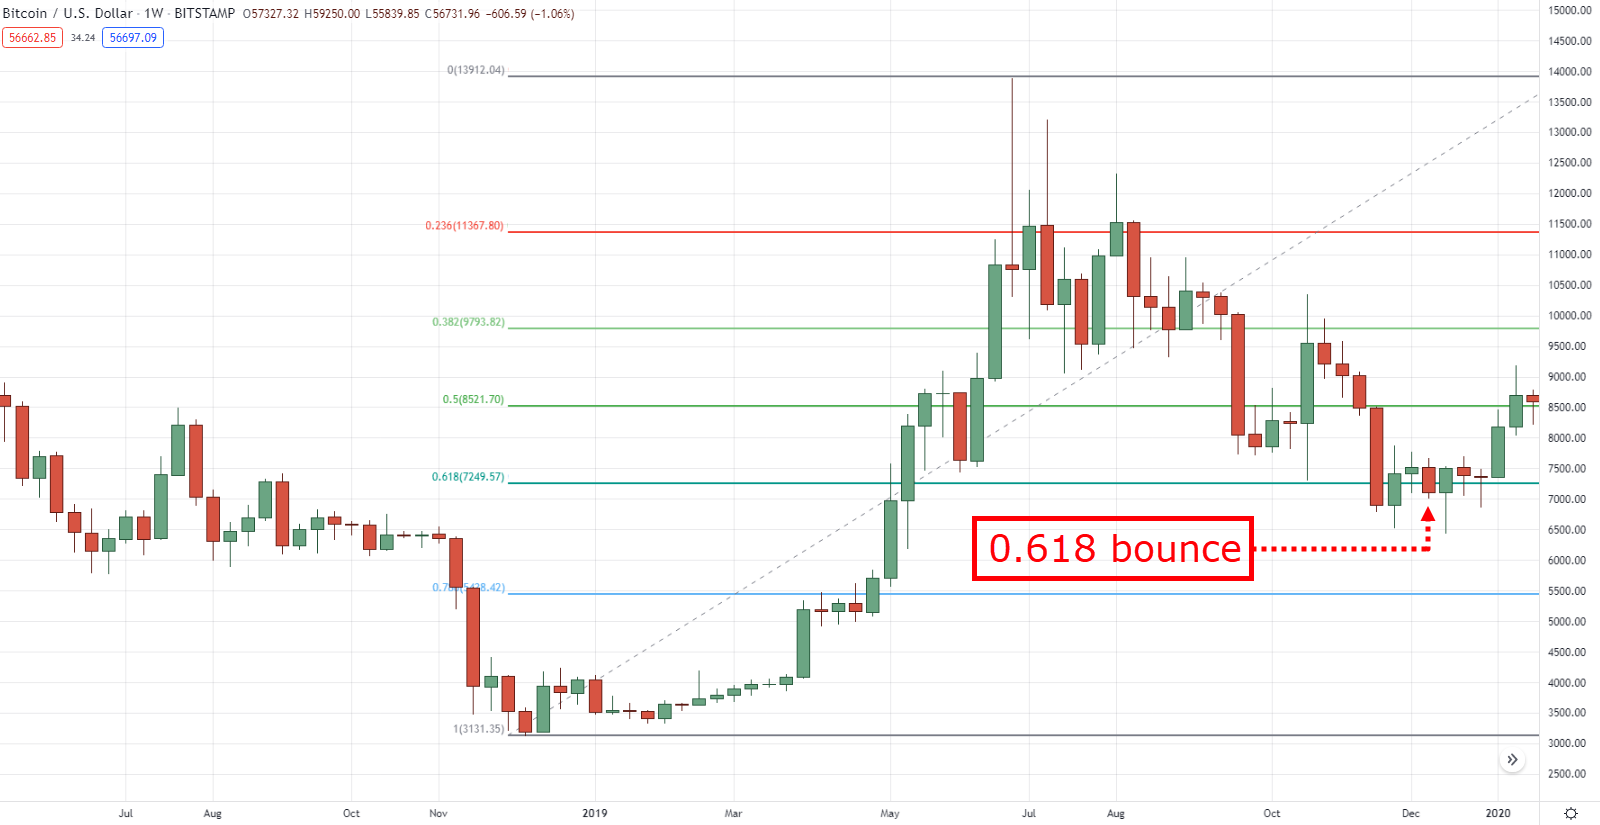
One of its purposes is to “predict” when the pullback will end as traders anticipate a trend reversal when the price reaches the golden ratio of 31.8% or 6.18% if it breaks.
61.8% bounce on BTCUSD weekly timeframe:
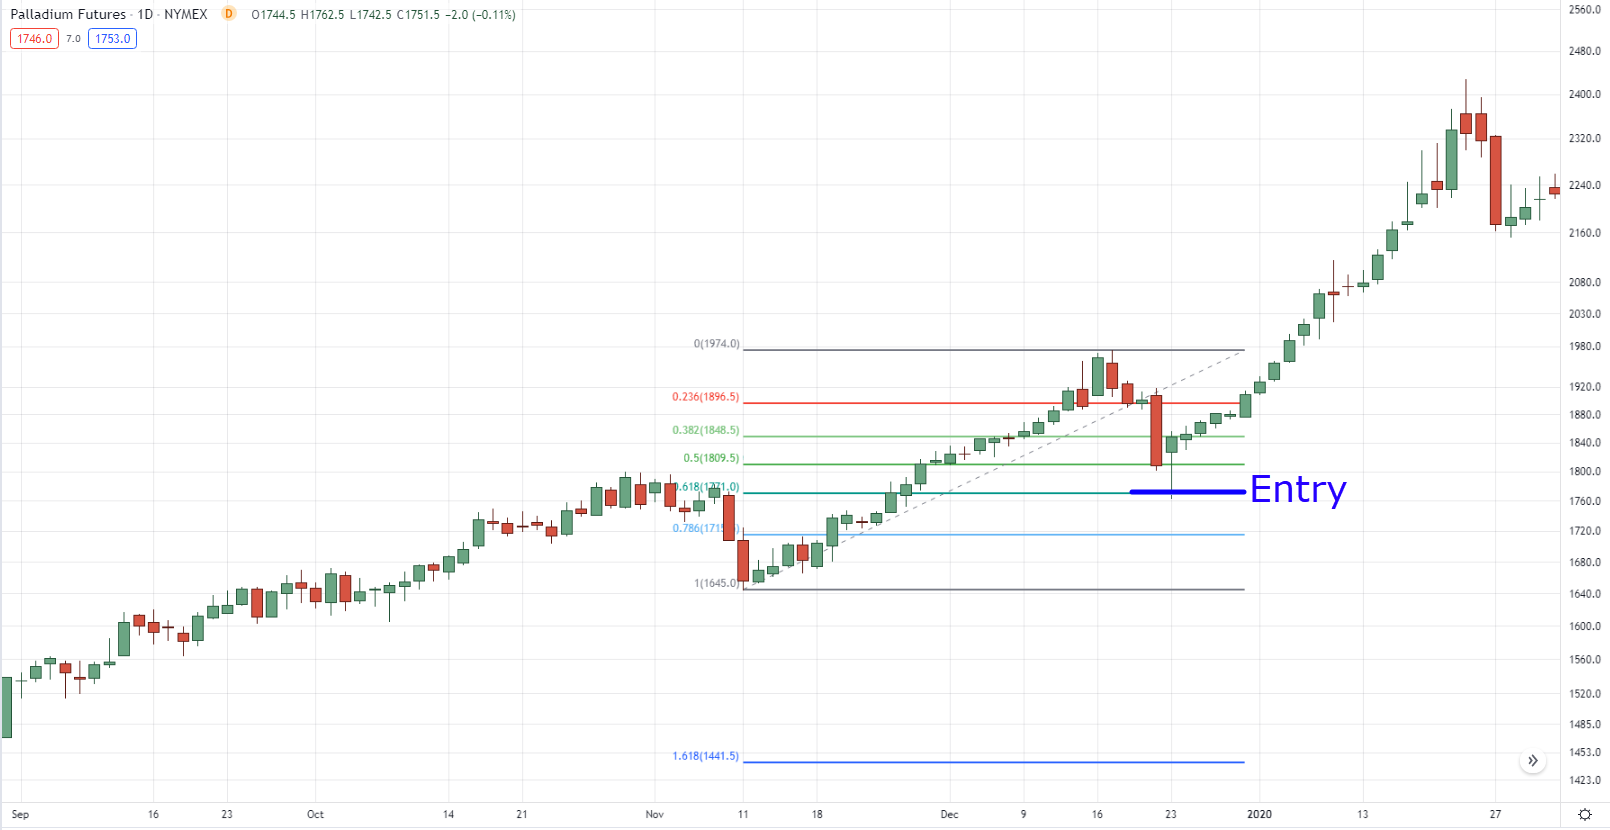
However, many traders use this tool to enter pullbacks to hop into an existing trend.
Fibonacci retracement entry at Palladium daily timeframe:
In contrast…
Fibonacci extension
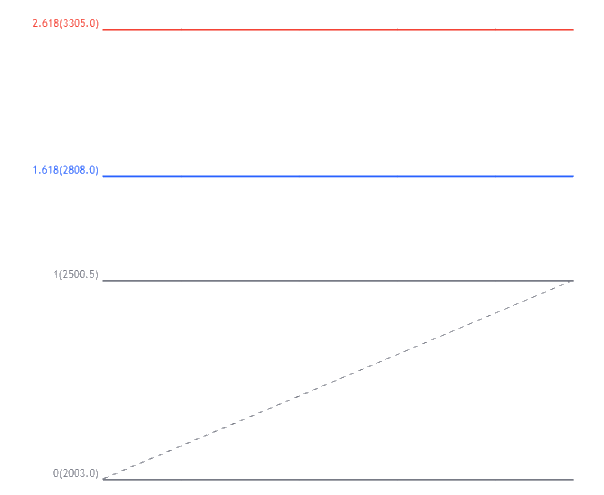
Traders use this tool to “predict” how far a trend will go.
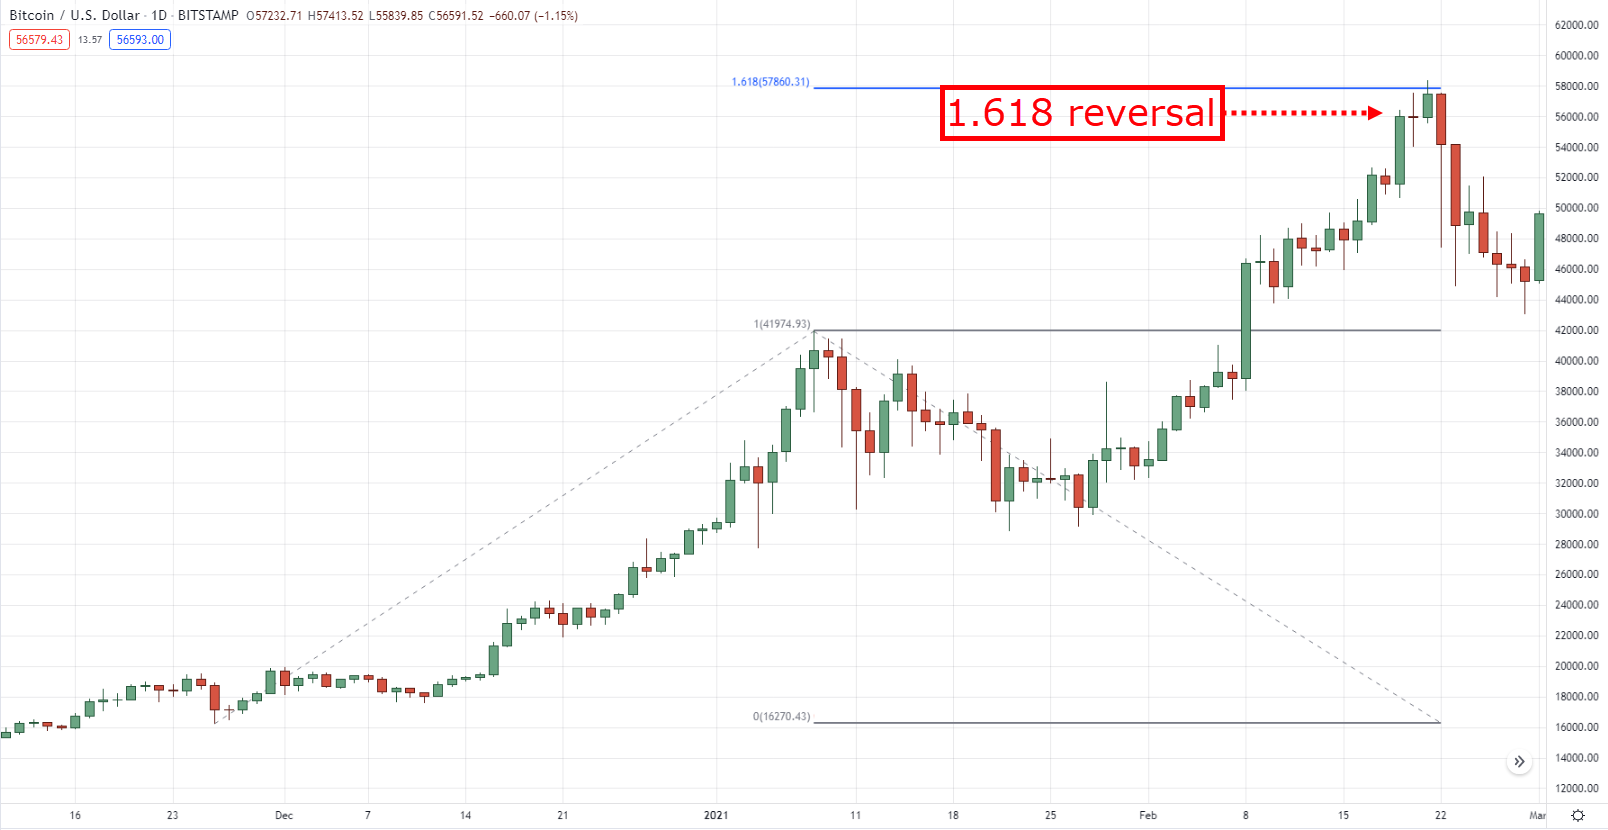
Such as anticipating a trend reversal when the price reaches 161.8% or 261.8%.
1.618% reversal at BTCUSD daily timeframe:
Sounds pretty good, right?
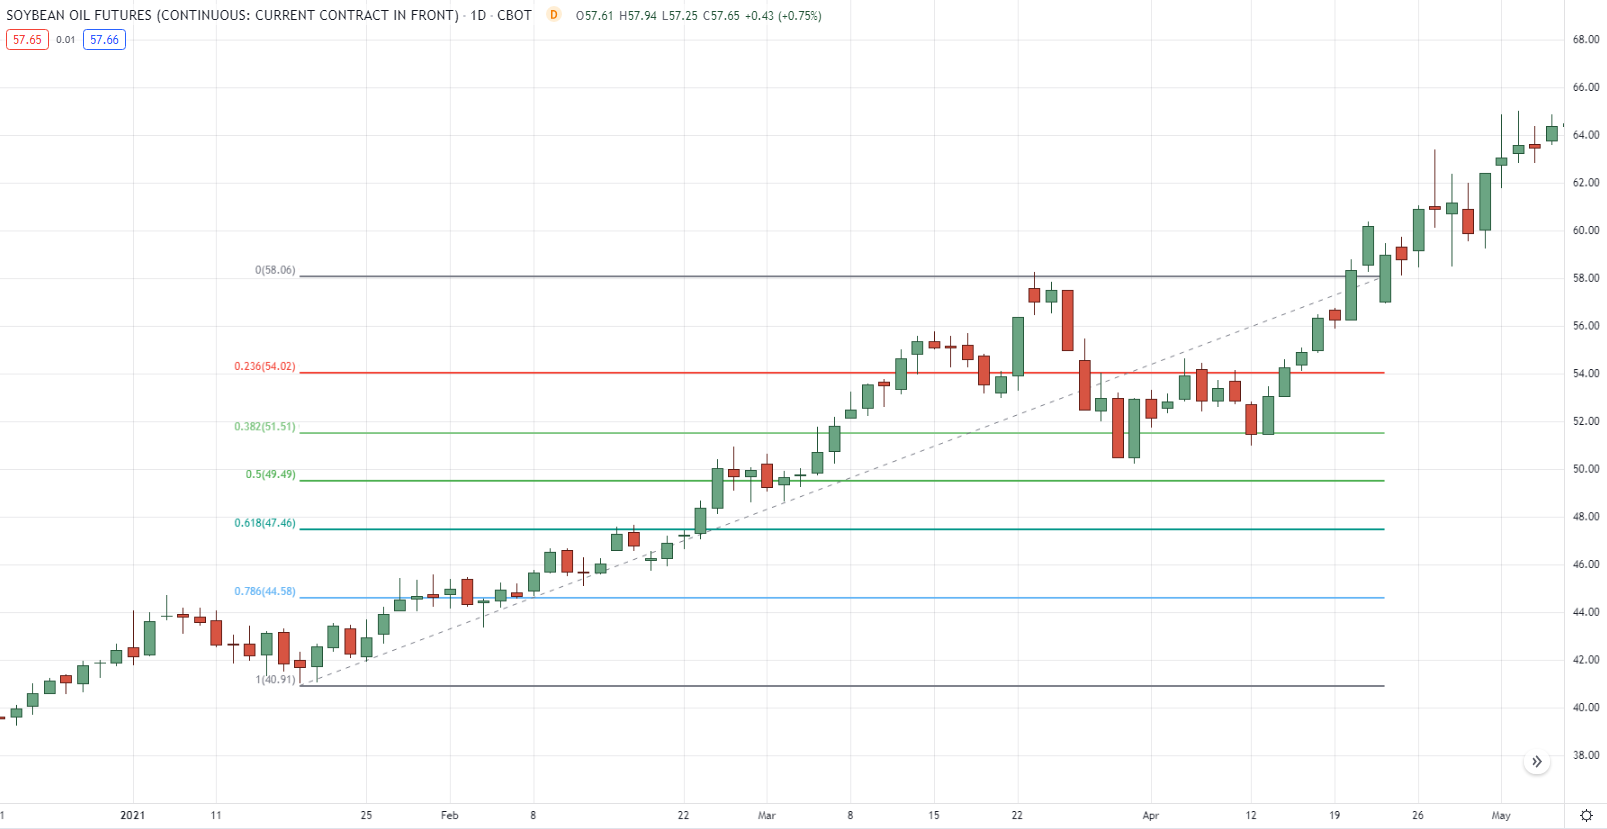
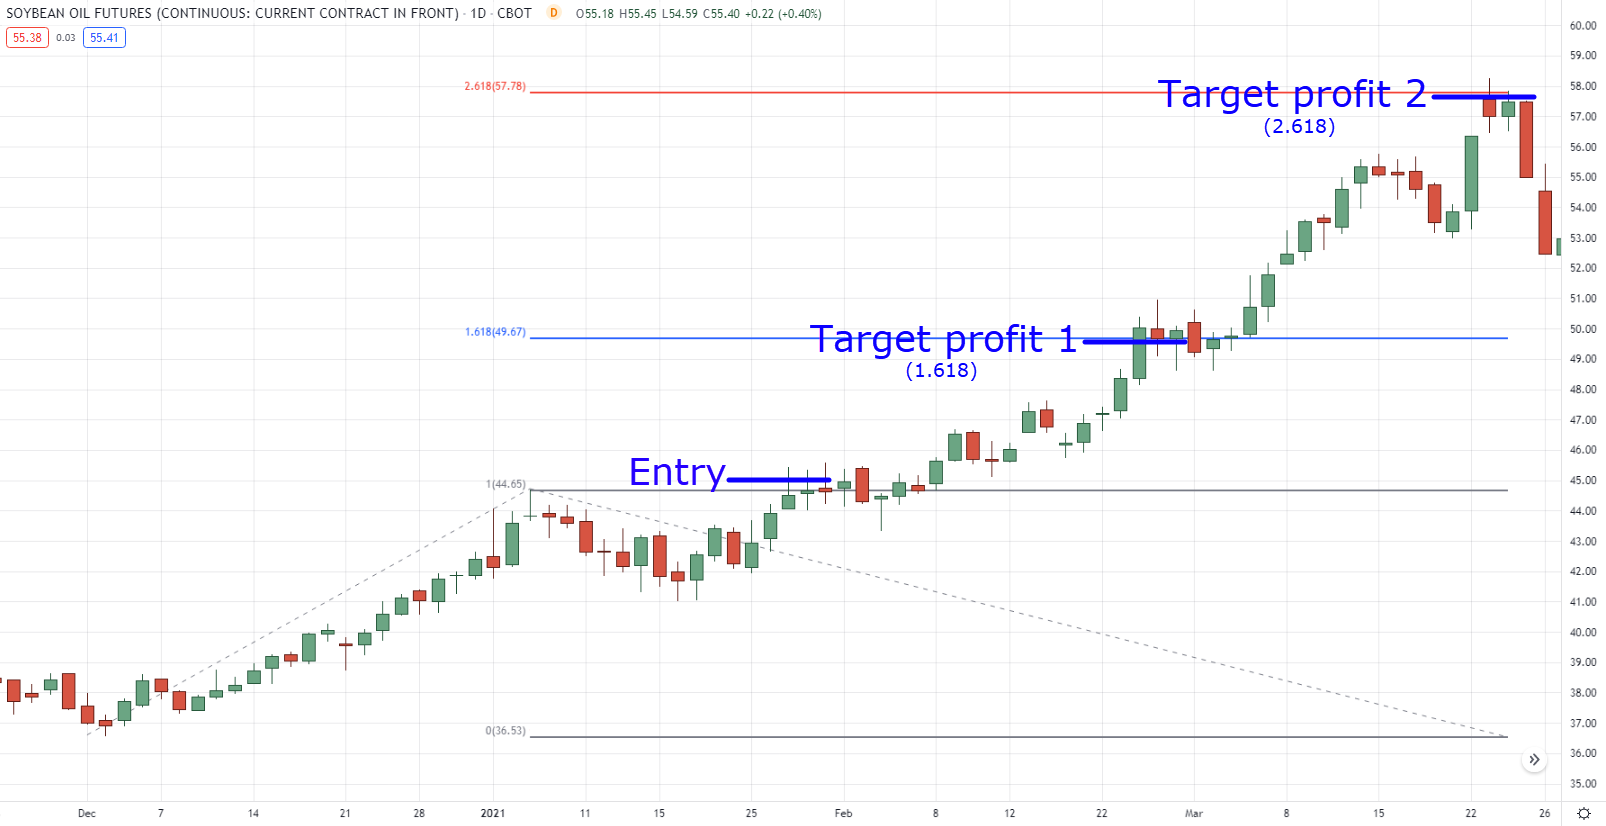
But at the same time, many traders use this tool to determine where they should take profits.
Fibonacci extension take profit levels at Soybean Oil daily timeframe:
Aha, you’re getting ideas now, right?
But I know you have this question in your mind right now:
“Cool charts, bro, but how can we apply these tools in real-time?”
“Do we include the wick? Or just the body?”
I feel you, and I’ve gone through that as well.
So let me keep things as simple as possible.
Since we use the Fibonacci retracement tool to time pullback reversals, you’d want to measure the whole trending move from:
Yes, that includes the wicks.
Now, it’s similar to the Fibonacci extension tool as well.
Since we’re looking to time trend reversals, you’d want to measure the entire previous trending move as well!
Even with that said…
It will still take time and practice to plot them correctly as the markets’ price action can be choppy at times.
Nonetheless, I highly suggest you familiarize yourself with market structures by reading this article here: How to Read Price Action (For Dummies)
Makes sense?
Good!
Now, the following sections can be uncharted territory for you since I’ll be shelling out some information some traders might not agree on.
However…
I think that the information is necessary for you to use Fibonacci trading tools with confidence.
Ready?
Then let’s get right into it…
The Wrong Way To Use Fibonacci Trading Tools
As you know…
Common Fibonacci trading tool sequences contain:
- 23.6%
- 38.2%
- 50.0%
- 61.8%
- 78.6%
- 88.6%
- 123.6%
- 138.2%
- 161.8%
- 178.6%
- And so on…
However, once you’ve used Fibonacci trading tools for quite some time, you’ll start to experience:
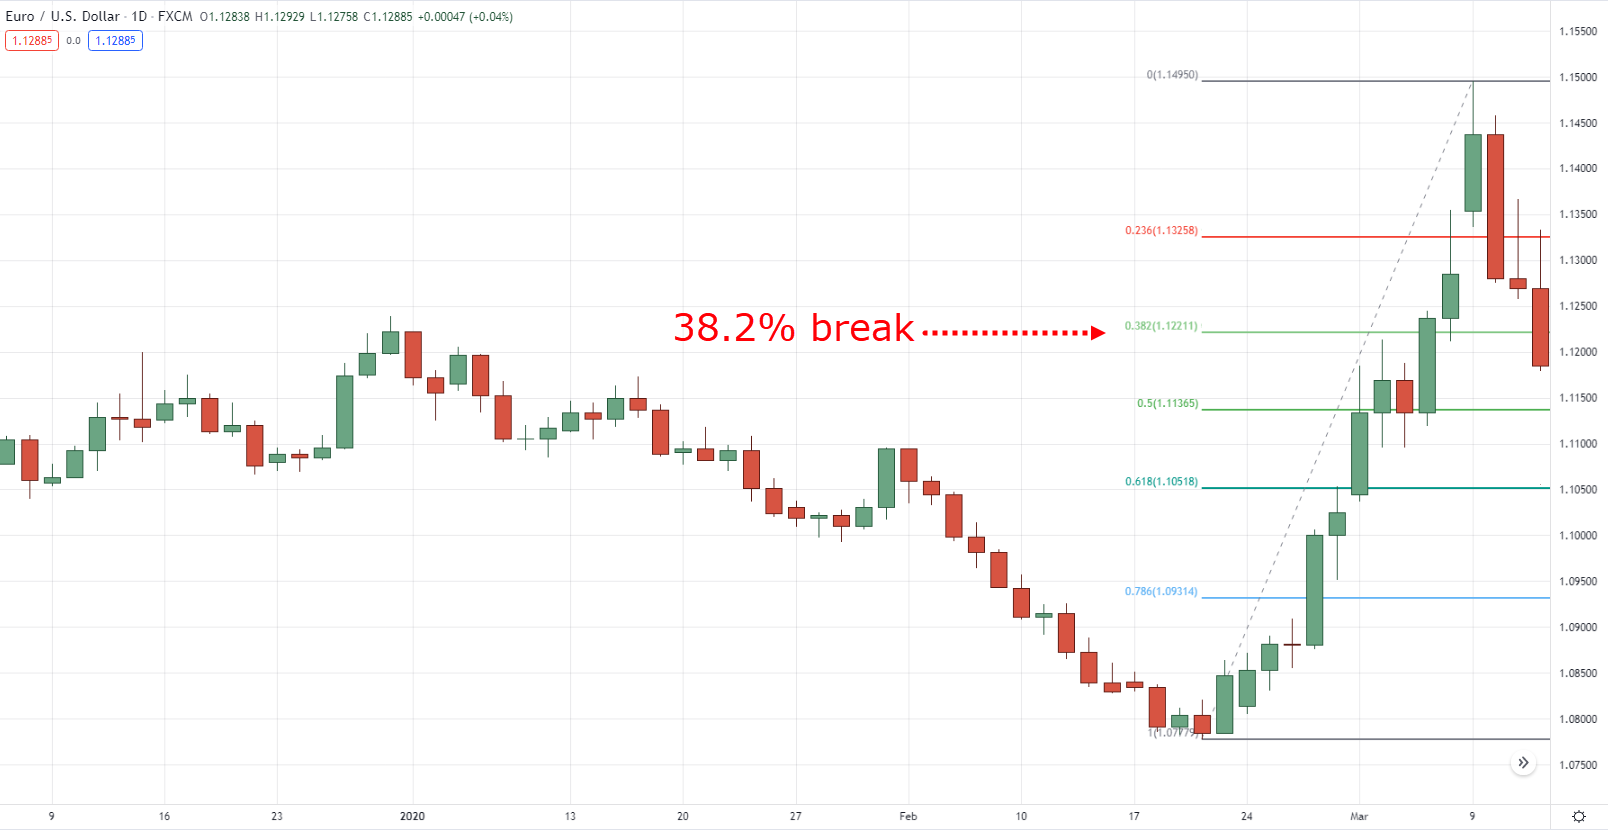
“Ah crap, the price has broken and closed below 38.2%, it will bounce on the 61.8% keep HODLing!”
38.2% break at EURUSD daily timeframe:
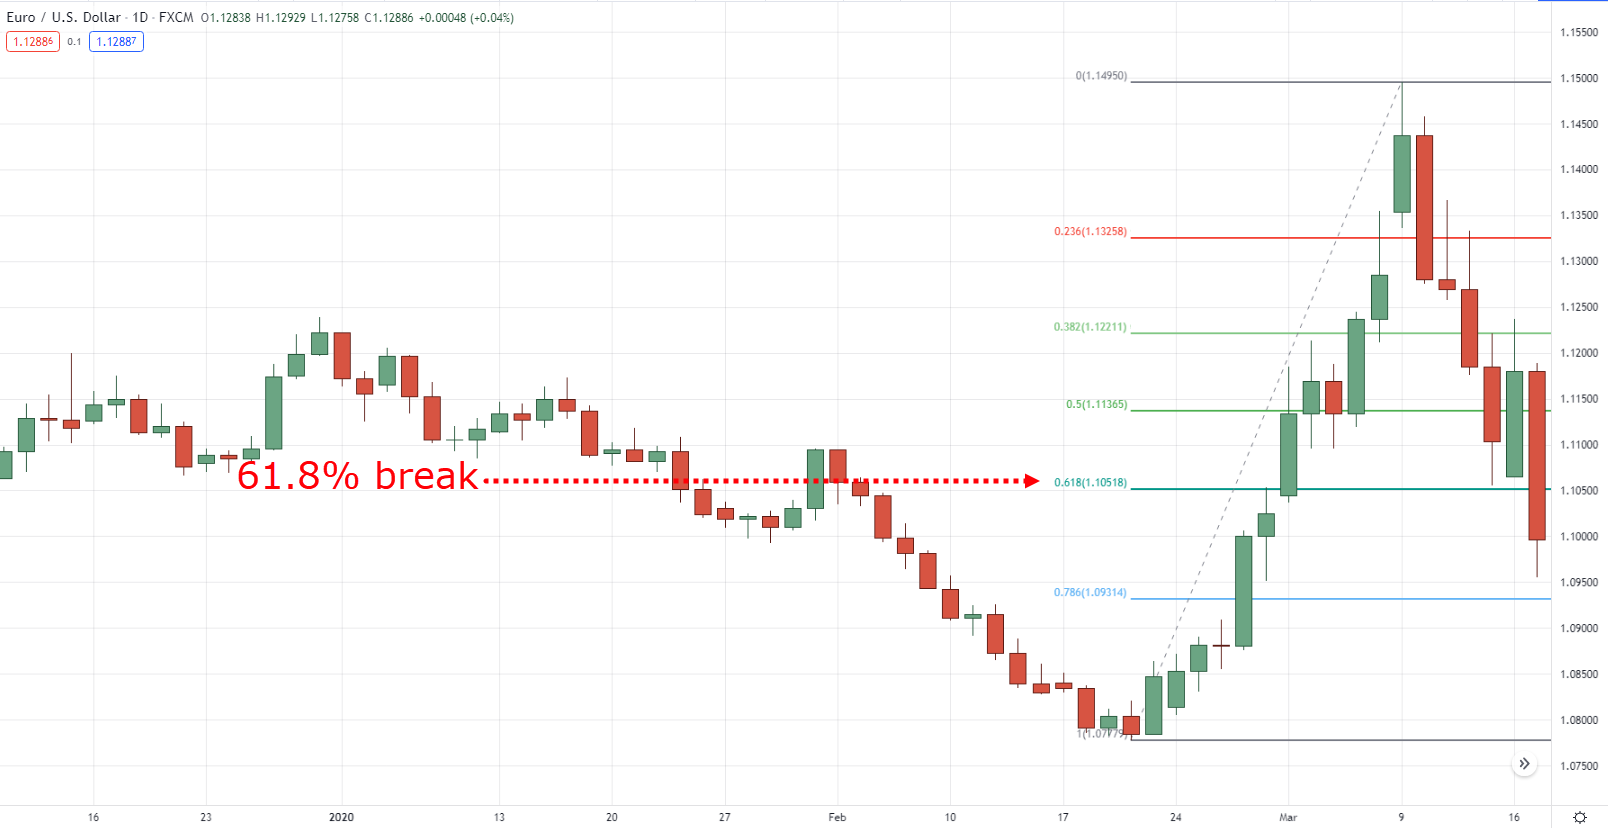
“What the hell? Price has broken and closed below 61.8%, I’m sure it will bounce on 78.6% this time. Time to buy more!”
61.8% break at EURUSD daily timeframe:
Before you know it…
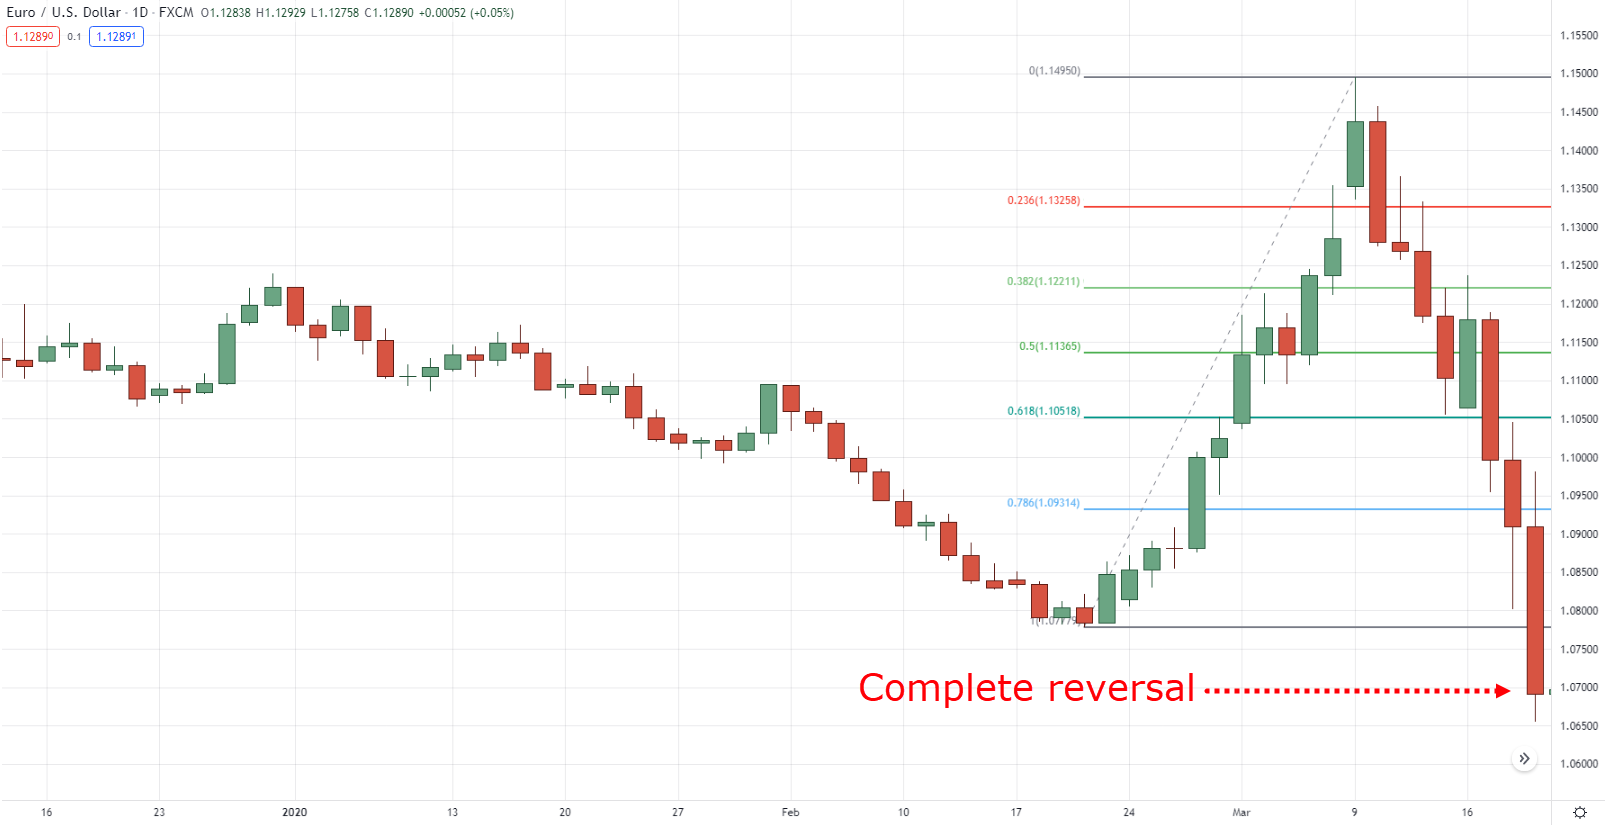
The trend has completely reversed, and you have lost everything.
Complete reversal at EURUSD daily timeframe:
Can you see what I mean?
There’s always a new “golden ratio” for the price to fall into.
At the same time…
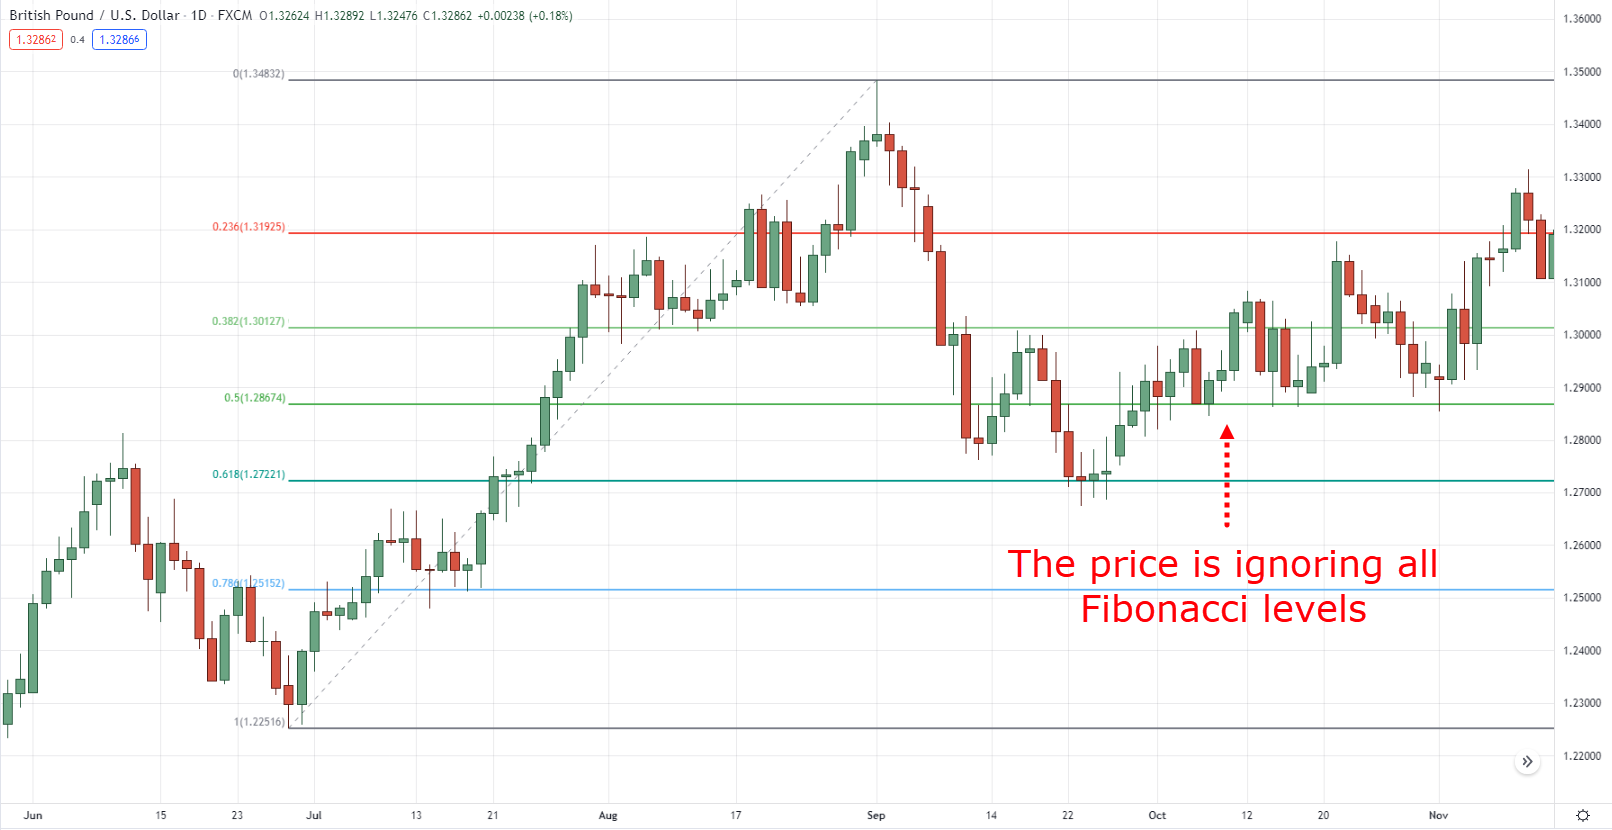
Prices can reverse between the Fibonacci levels like it’s nothing:
What’s the bottom line?
The bottom line is that you can’t necessarily depend on those Fibonacci sequence numbers because they’re not as “golden” as you think — the market goes where it wants to go.
So at this point, you’re probably wondering:
“Does this mean the Fibonacci trading tools don’t work?”
“Are these tools pretty much useless in the long run?”
“What’s the solution?”
“What’s the alternative?”
Don’t worry.
I’ll make sure to answer all of them before this guide ends.
But the good news is this:
Fibonacci trading tools are not useless.
Have you noticed how I always add the word “tool” whenever I mention Fibonacci?
Because that’s what they are!
You see…
If you use the Fibonacci retracement and extension as “tools” to complement your trading method, you’ll start to take advantage of them rather than depend on them.
What do I mean?
It means that you shouldn’t use Fibonacci trading tools as sentiment tools.
Instead…
It would help if you used them as trade management tools to time your entries and exits objectively and consistently.
So stick around and let me teach you how in the next section…
Fibonacci Trading Techniques To Improve Your Strategy
So, what is Fibonacci trading and how can you improve your strategy with it?
Now, I won’t teach you how to use Fibonacci trading tools to analyse the market or be a Fibonacci expert analyst in this section.
Instead, I will teach you how to use them and take advantage of them in your trading.
Because in the end…
Being a good analyst is different from being a good trader.
Make sure to remember that when using Fibonacci for trading.
Now, how you take advantage of the Fibonacci trading tools boils down to two things:
- Entry and exit triggers
- Scaling out of your trade
- Scaling into your trade
Let me explain…
Fibonacci trading – Entries and exits on a trending market
When timing your entries in an existing trend…
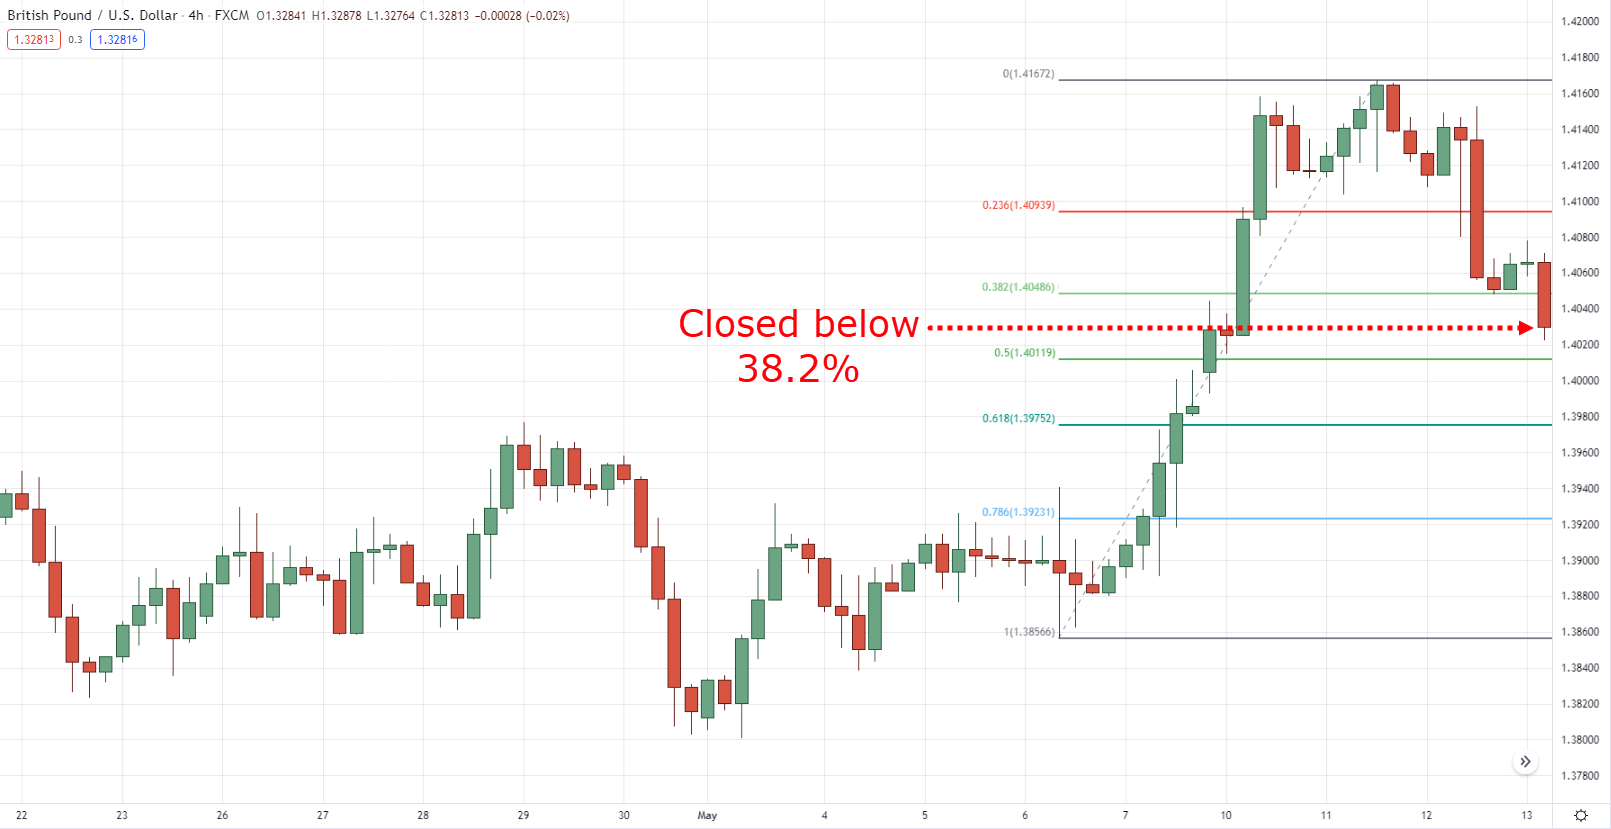
You can consider waiting for the price to make a valid candle close below 38.2%.
The price closed below 38.2% at GBPUSD daily timeframe:
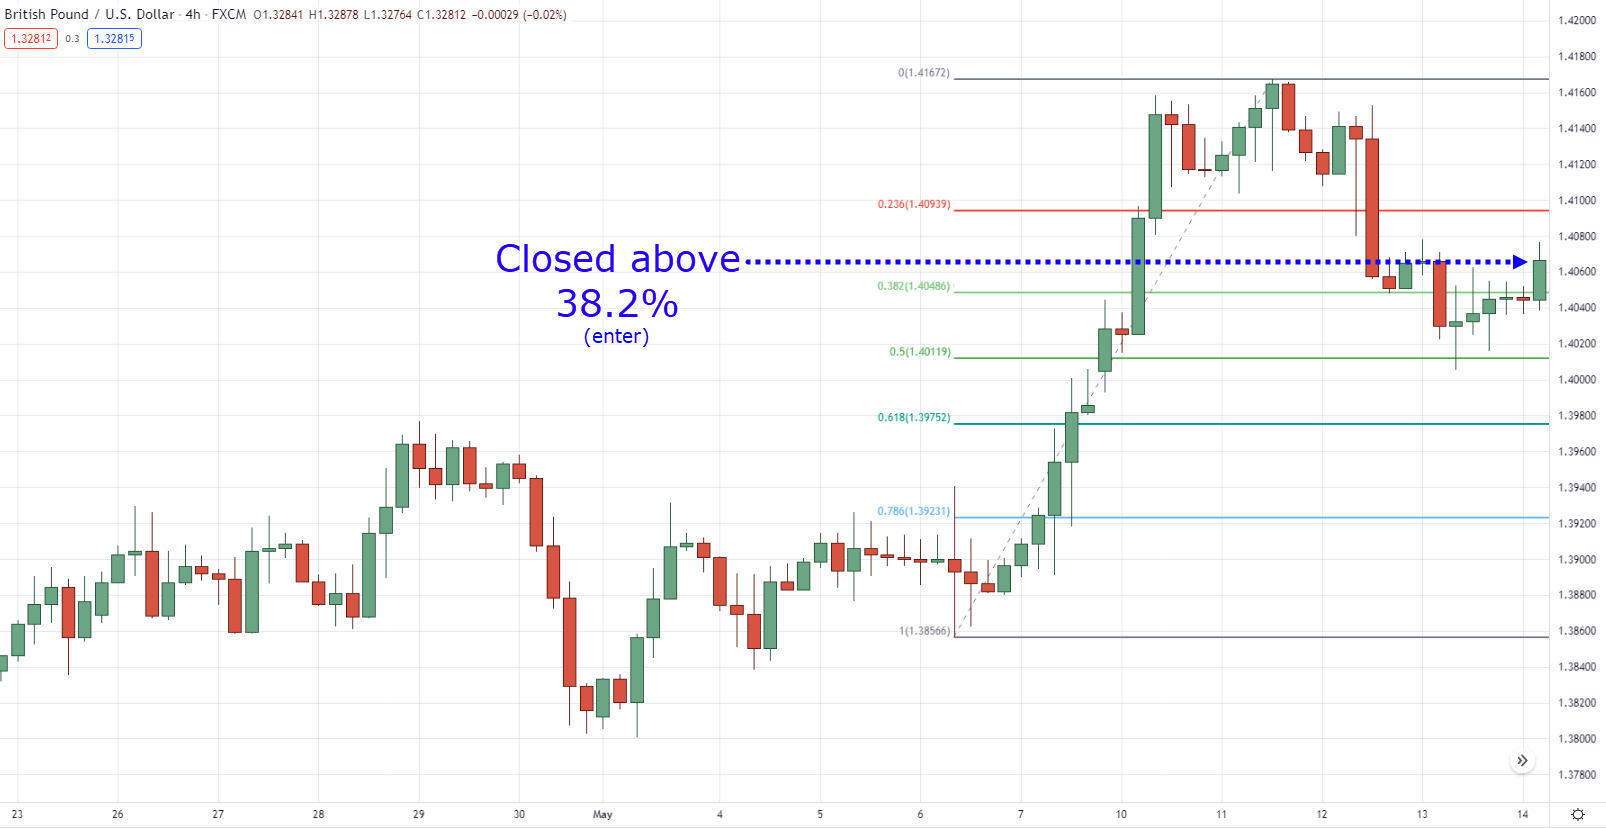
Then wait for the price to close back above 38.2% as your entry trigger.
The price closed above 38.2% at GBPUSD daily timeframe:
If you’re wondering, you can apply the same concept with the 61.8% level.
But here’s the principle behind it…
You are looking to capture false breakouts, and you’re using the Fibonacci retracement tool as a way for you to enter them objectively!
Okay, so how about exits? How do you set your stop loss and where to take profits?
Don’t worry, I’ll show you.
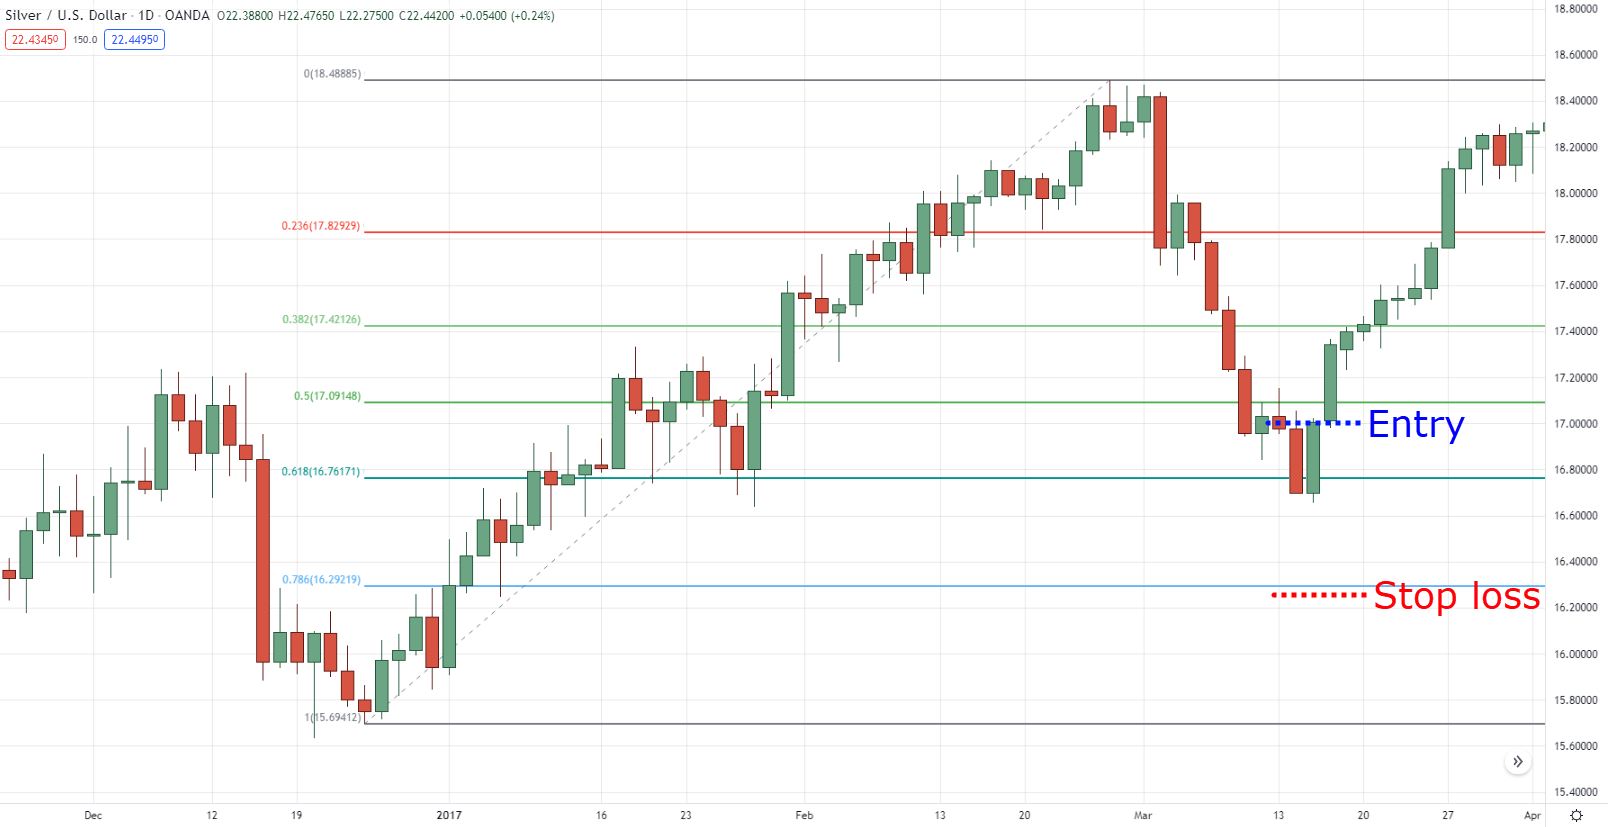
So, assuming you entered a false break at the 61.8% level…
You can consider placing your stop loss below the next Fibonacci level, which is the 78.6%
78.6% initial stop loss at XAGUSD daily timeframe:
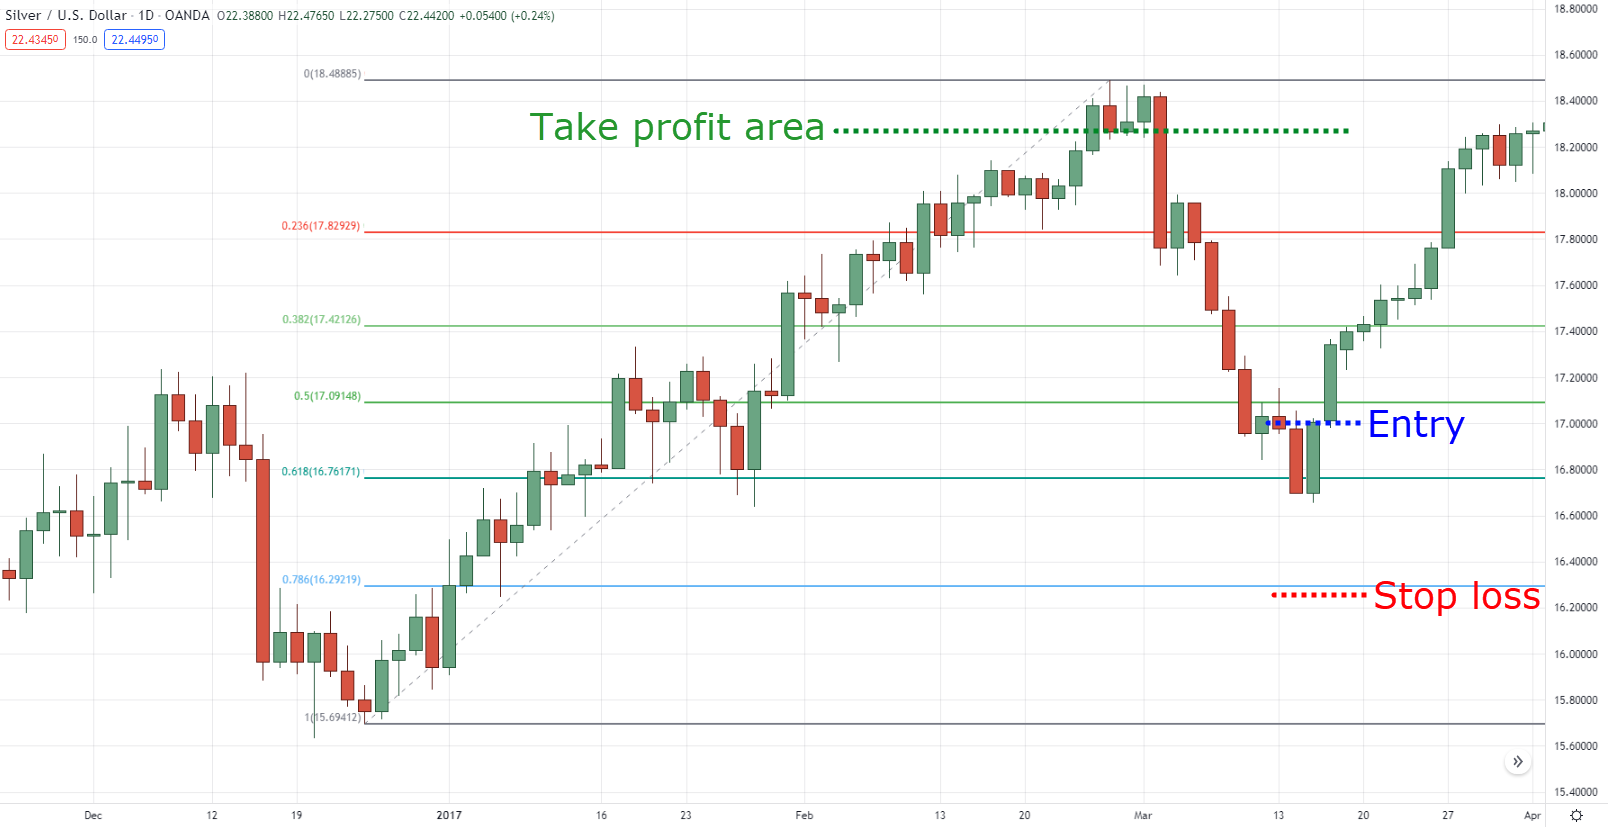
And take profits before the nearest swing high (or the 100%) as you want to exit the trade before potential selling pressure kicks in.
Take profit area at XAGUSD daily timeframe:
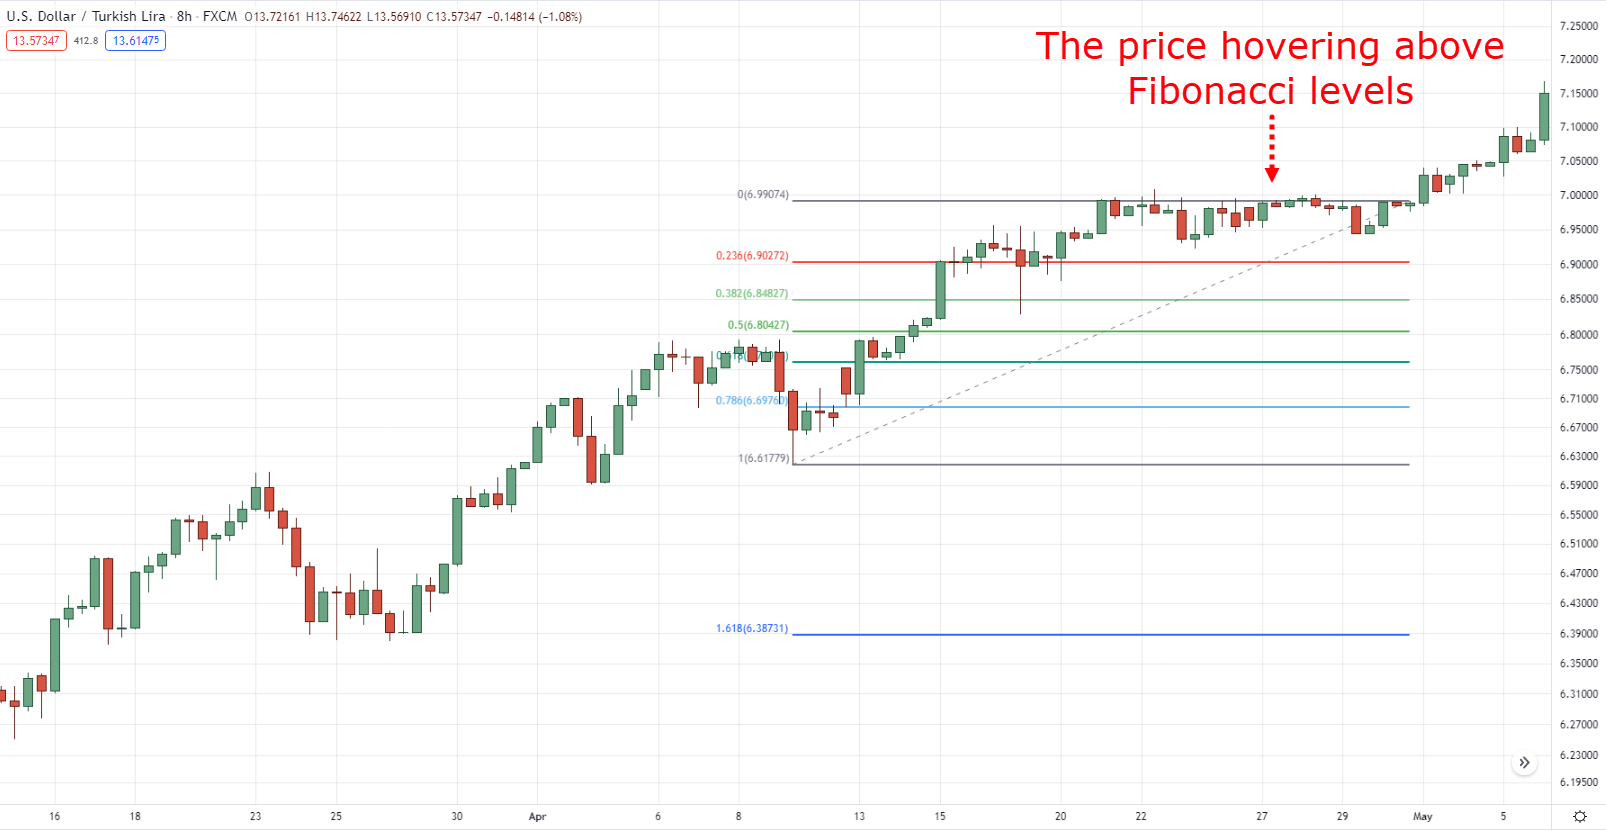
Now, what if the price is making parabolic trending moves?
Parabolic trend on USDTRY 8-hour timeframe:
As you can see, it’s barely touching any of the “golden” ratios; what should you do?
Simple.
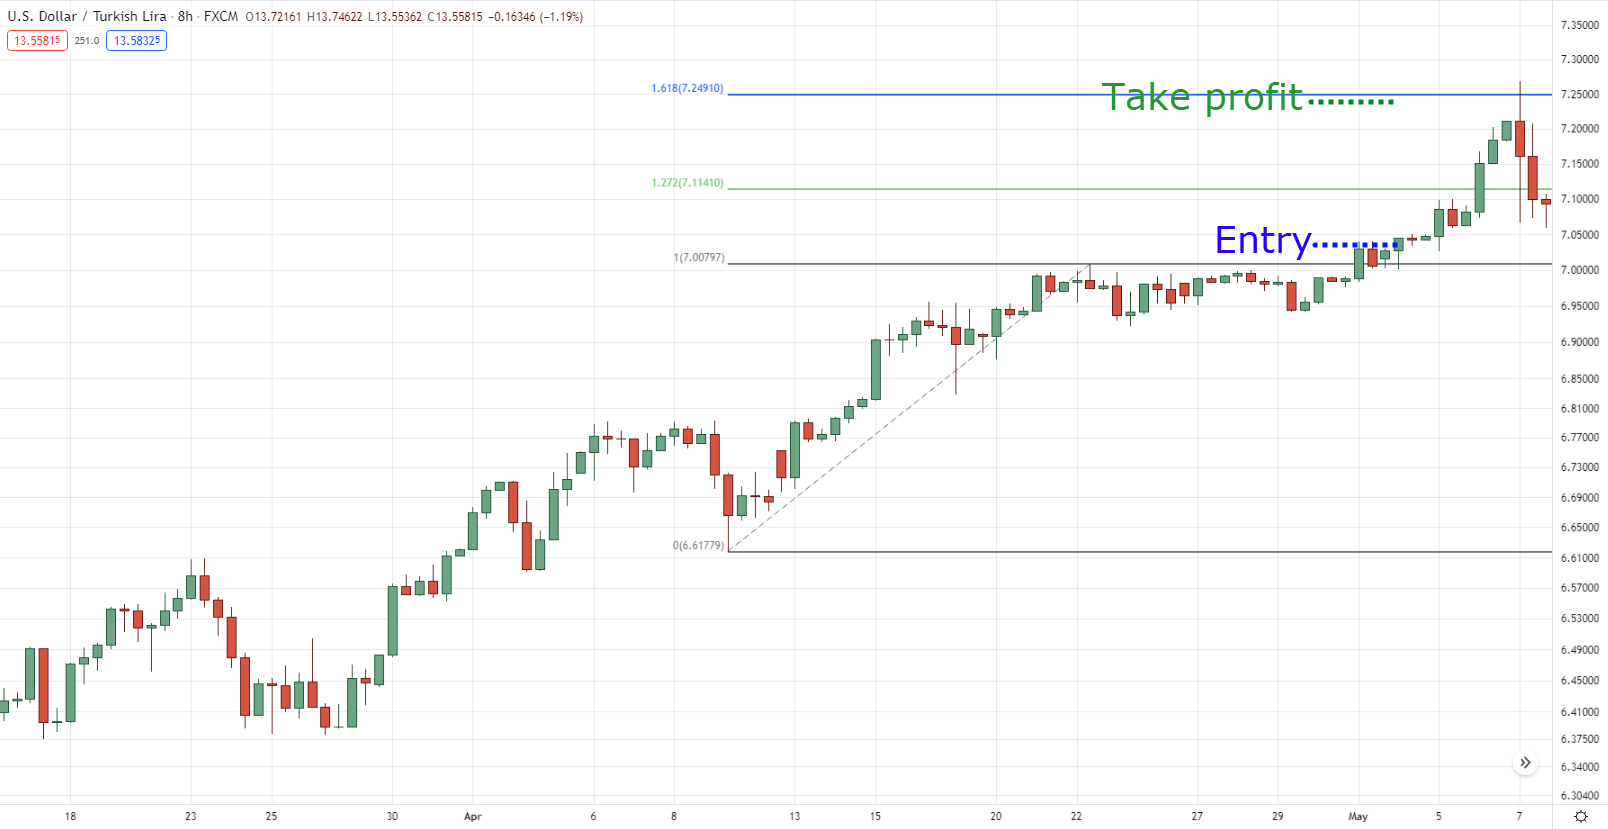
Enter the breakout, and use the Fibonacci extension tool to time your entries before 161.8%
Breakout setup on USDTRY 8-hour timeframe:
At this point…
I’ve only shared how to use Fibonacci trading tools on trending markets.
So how about ranging markets?
Fibonacci trading – Entries and exits on a range market
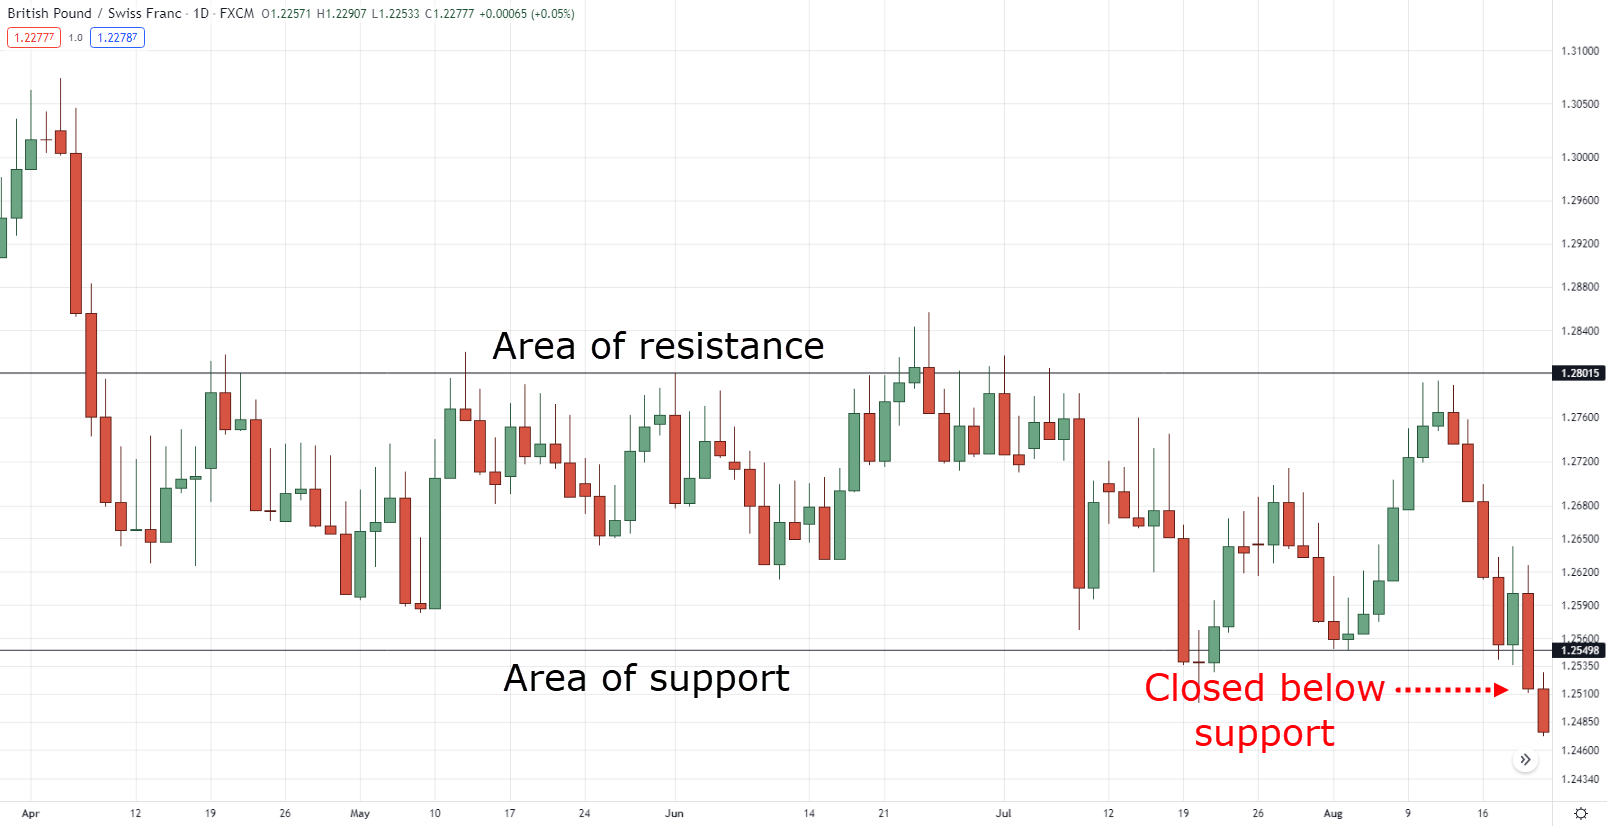
Like what I taught you a while ago, you want the price to close below the support area.
Range market on GBPCHF daily timeframe:
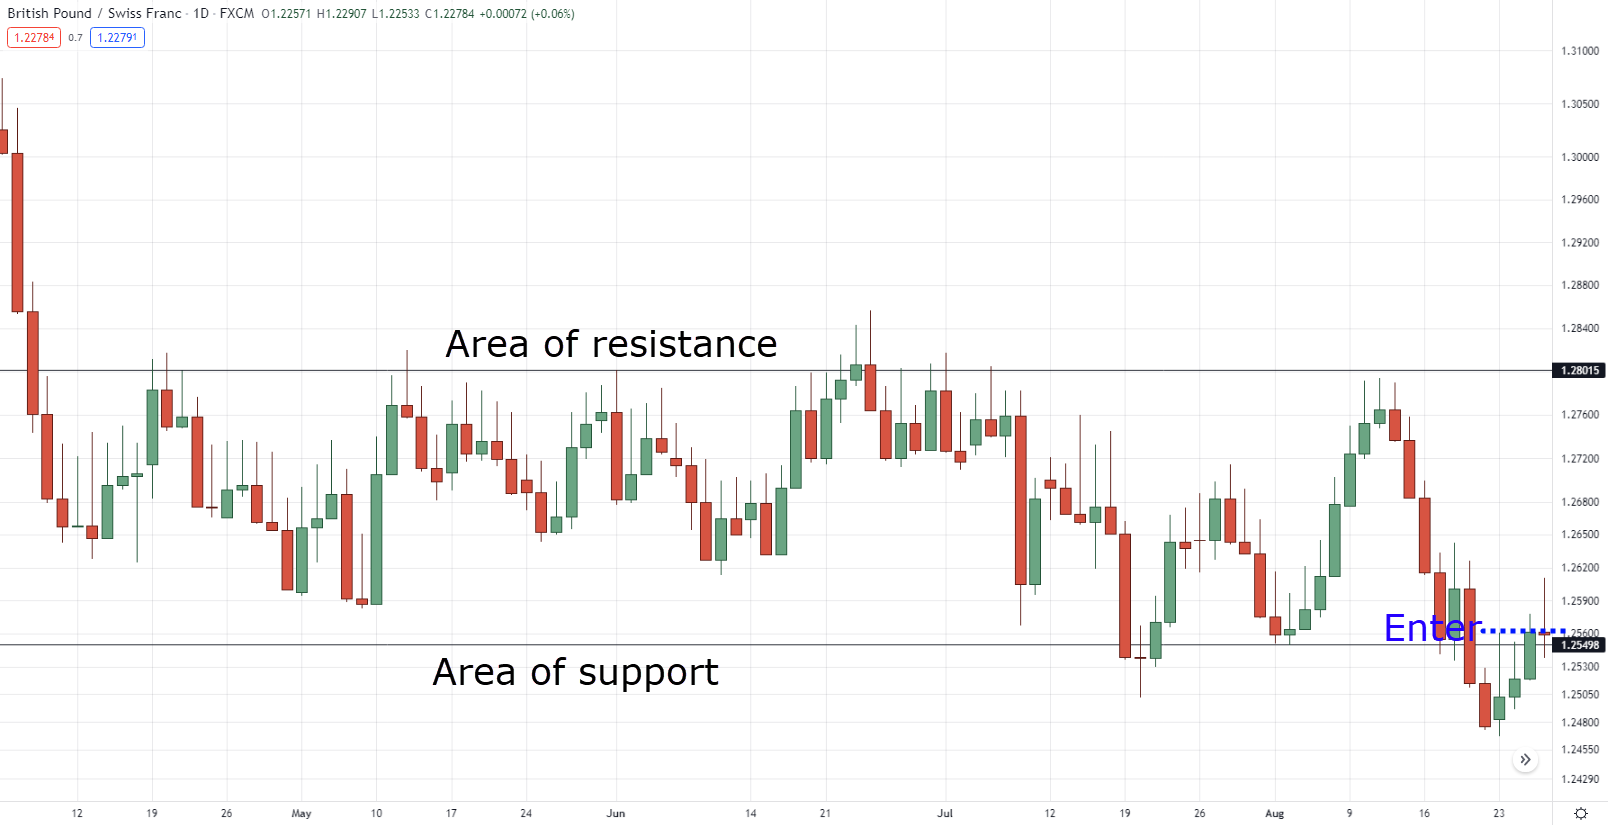
Then enter the trade when the price closes back above the area of support.
Range market entry at GBPCHF daily timeframe:
In this case, you can see that we are using price action to compliment the Fibonacci trading tool.
Pretty powerful, am I right?
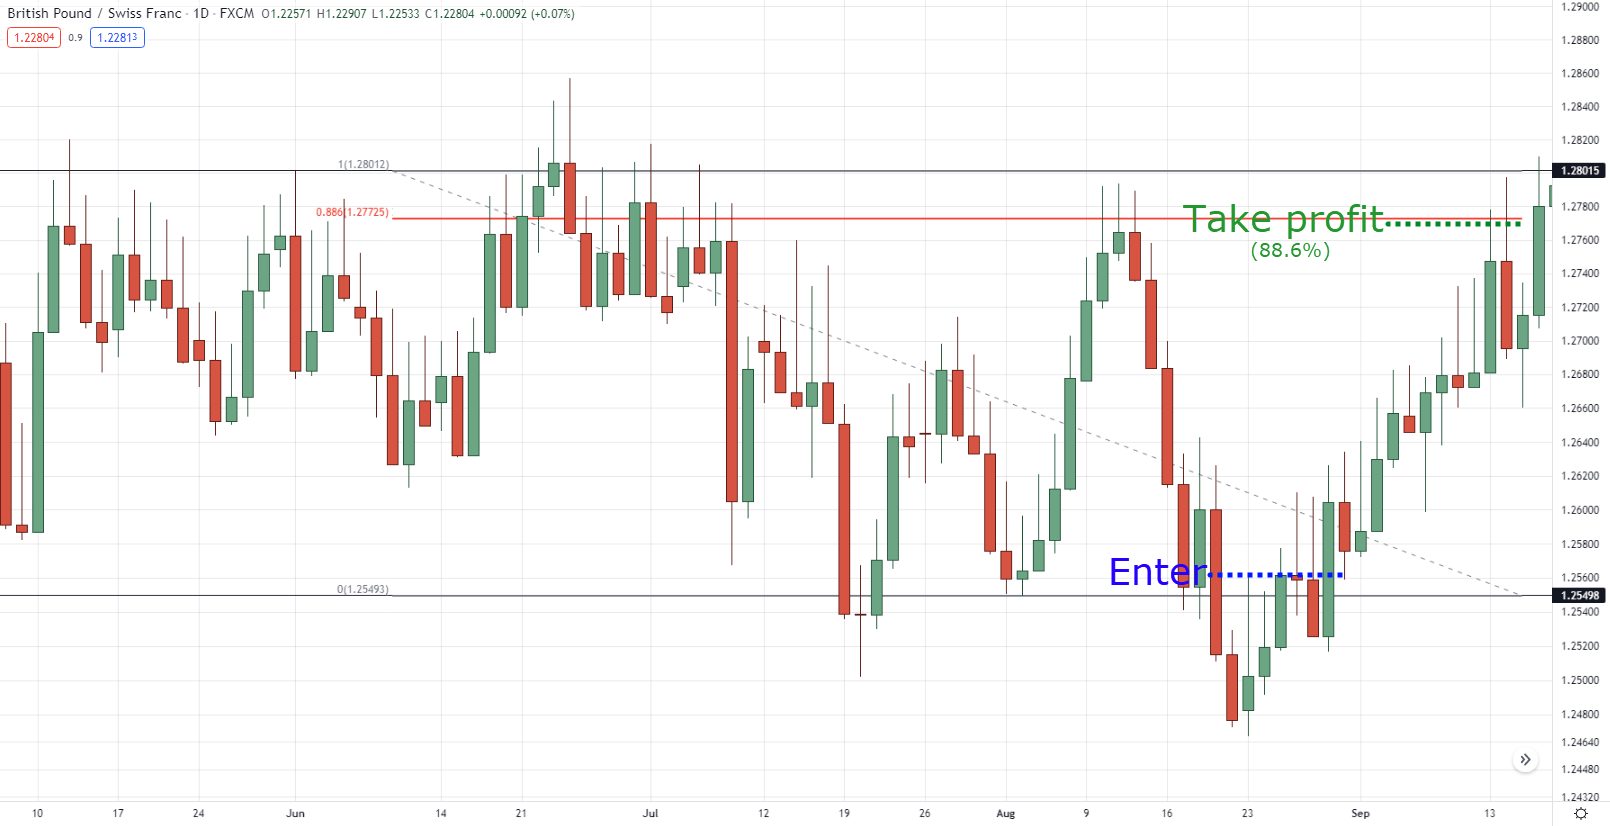
Finally, you can consider taking your profits at the Fibonacci retracement 88.6% level.
88.6% take profit at GBPCHF daily timeframe:
Again, what’s the principle behind it?
Why should we take profits at 88.6%? Why not at resistance itself?
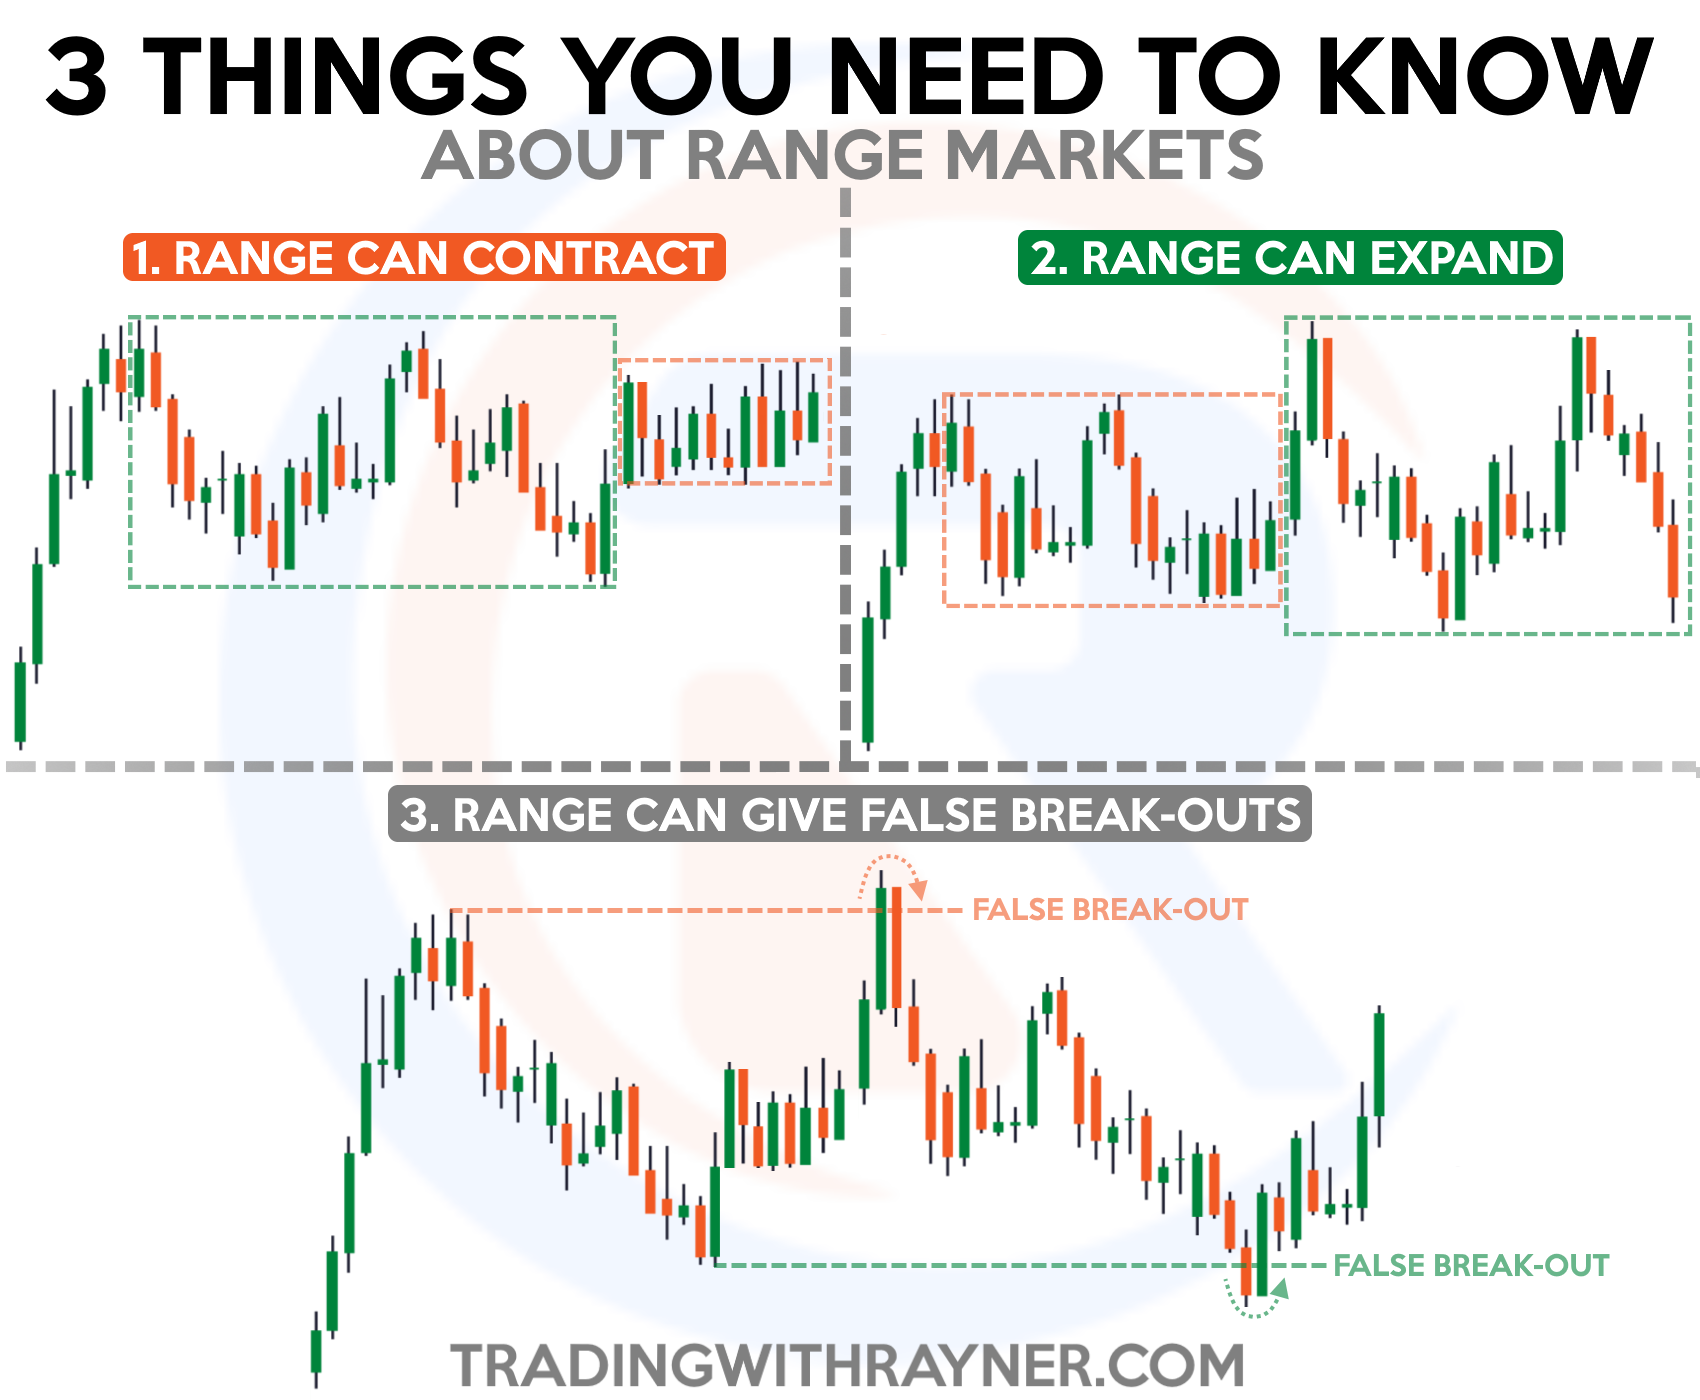
You see, trading on range markets can be difficult.
It can contract, expand, and make false breakouts.
Here’s what I mean…
Of course, we take advantage of the false breakout to enter our trades!
But it pays to take profits before potential sellers (or a potential contraction) come in.
Makes sense?
Fibonacci trading – Scaling out of your trade
Scaling in or out of your trades is somewhat of an advanced topic.
However…
These trade management techniques on your arsenal can single-handedly improve your trading psychology, decrease your risk, and potentially increase your rewards.
Cool?
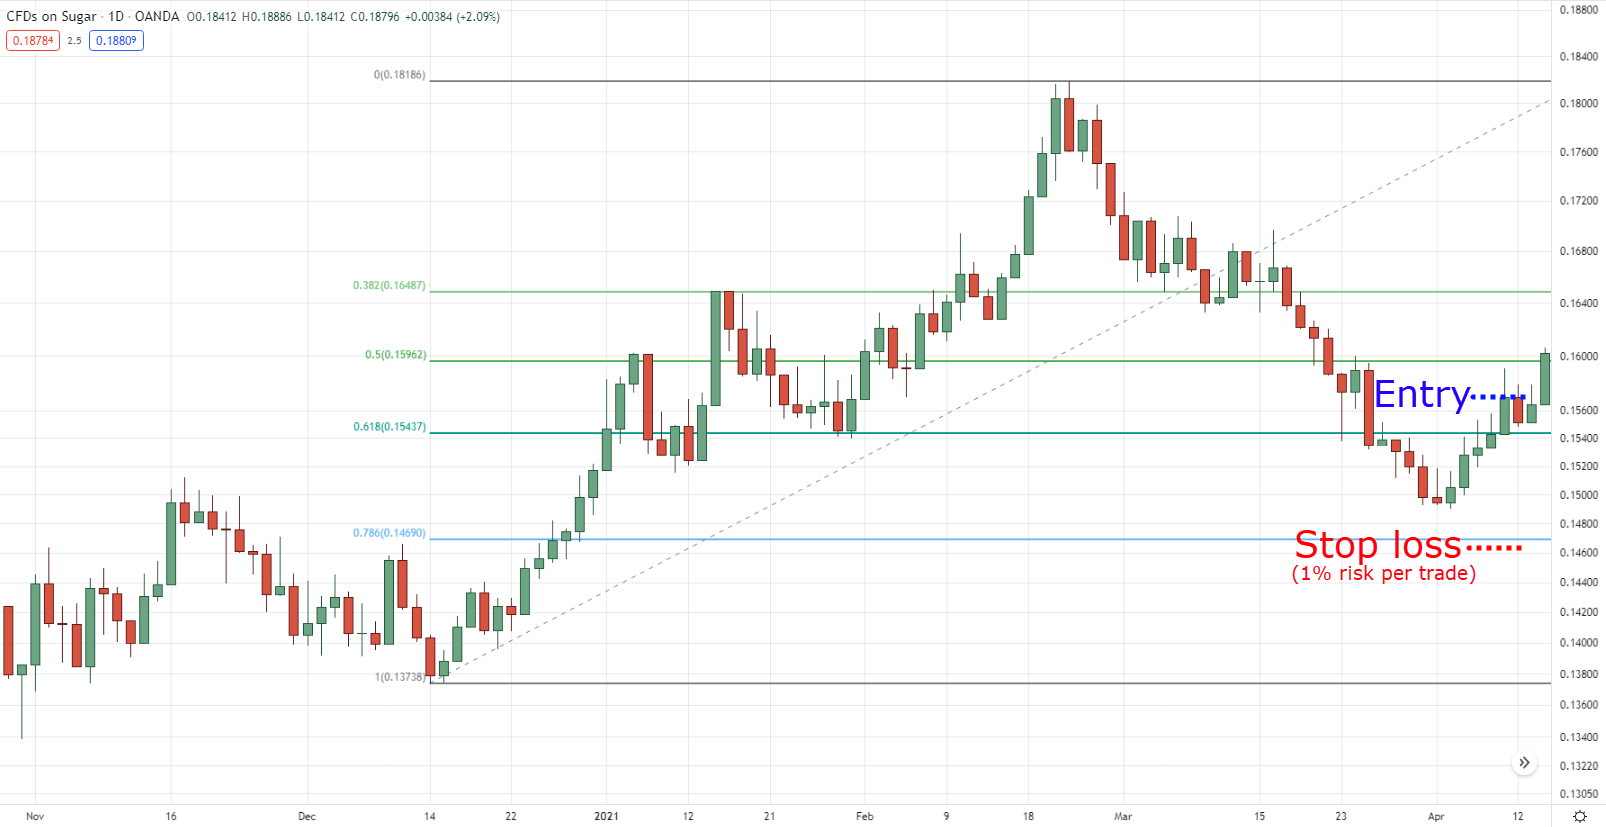
So with that said, let’s go back to our previous example where you enter a pullback on the 61.8% reversal with a 1% risk per trade.
61.8% pullback setup on Sugar daily timeframe:
If you’re a conservative type of trader but at the same time, you’re willing to wait a little longer to take profits…
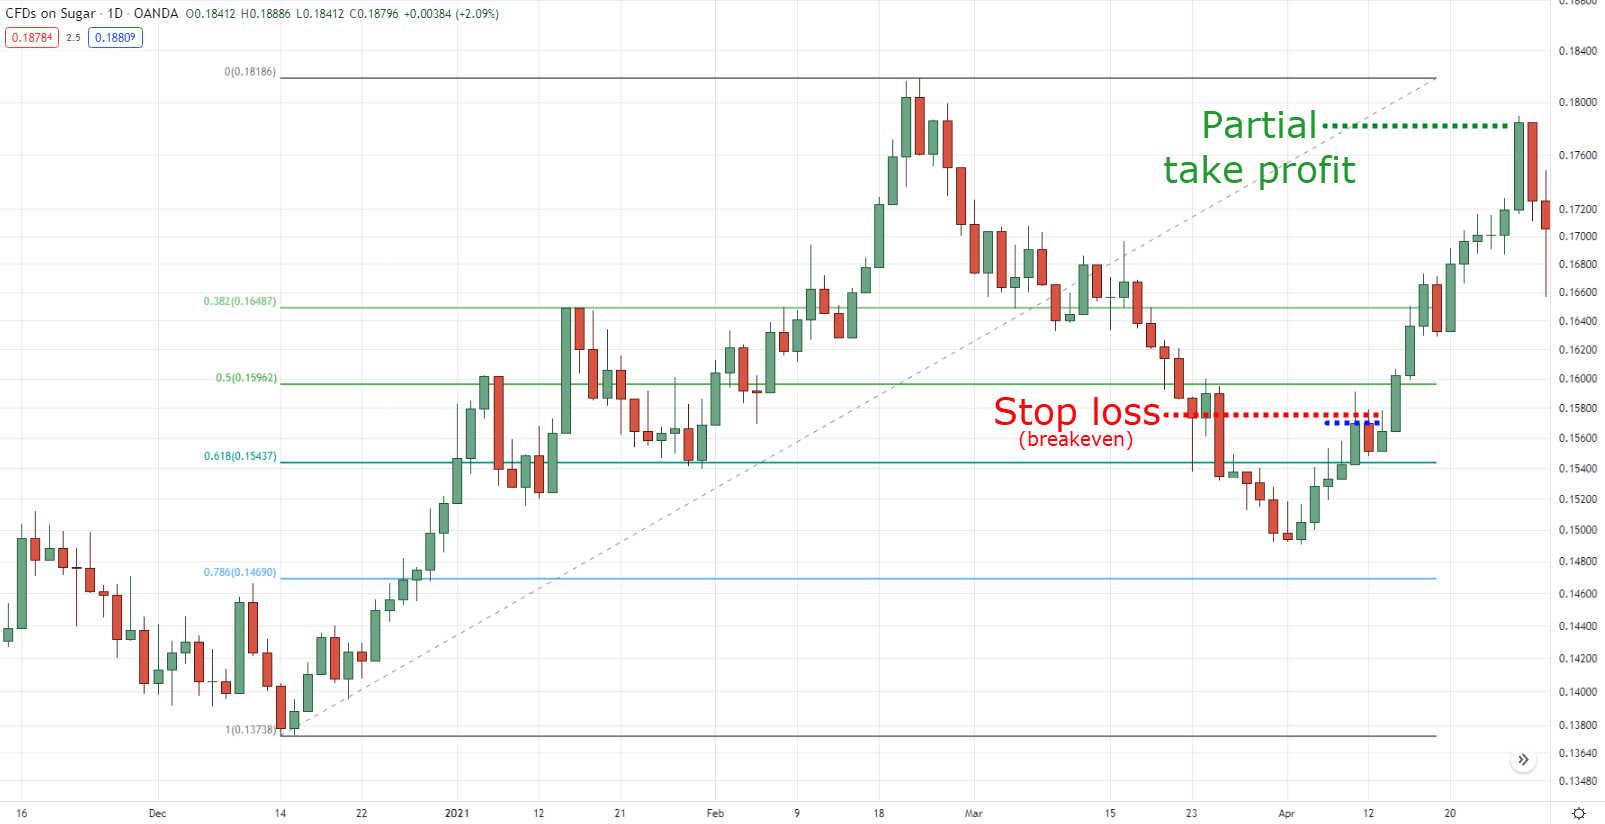
You can partially take your profits once the price reaches the previous high then move your stop loss to breakeven.
Moved stop loss to breakeven on Sugar daily timeframe:
So, what will you do with the rest of the position?
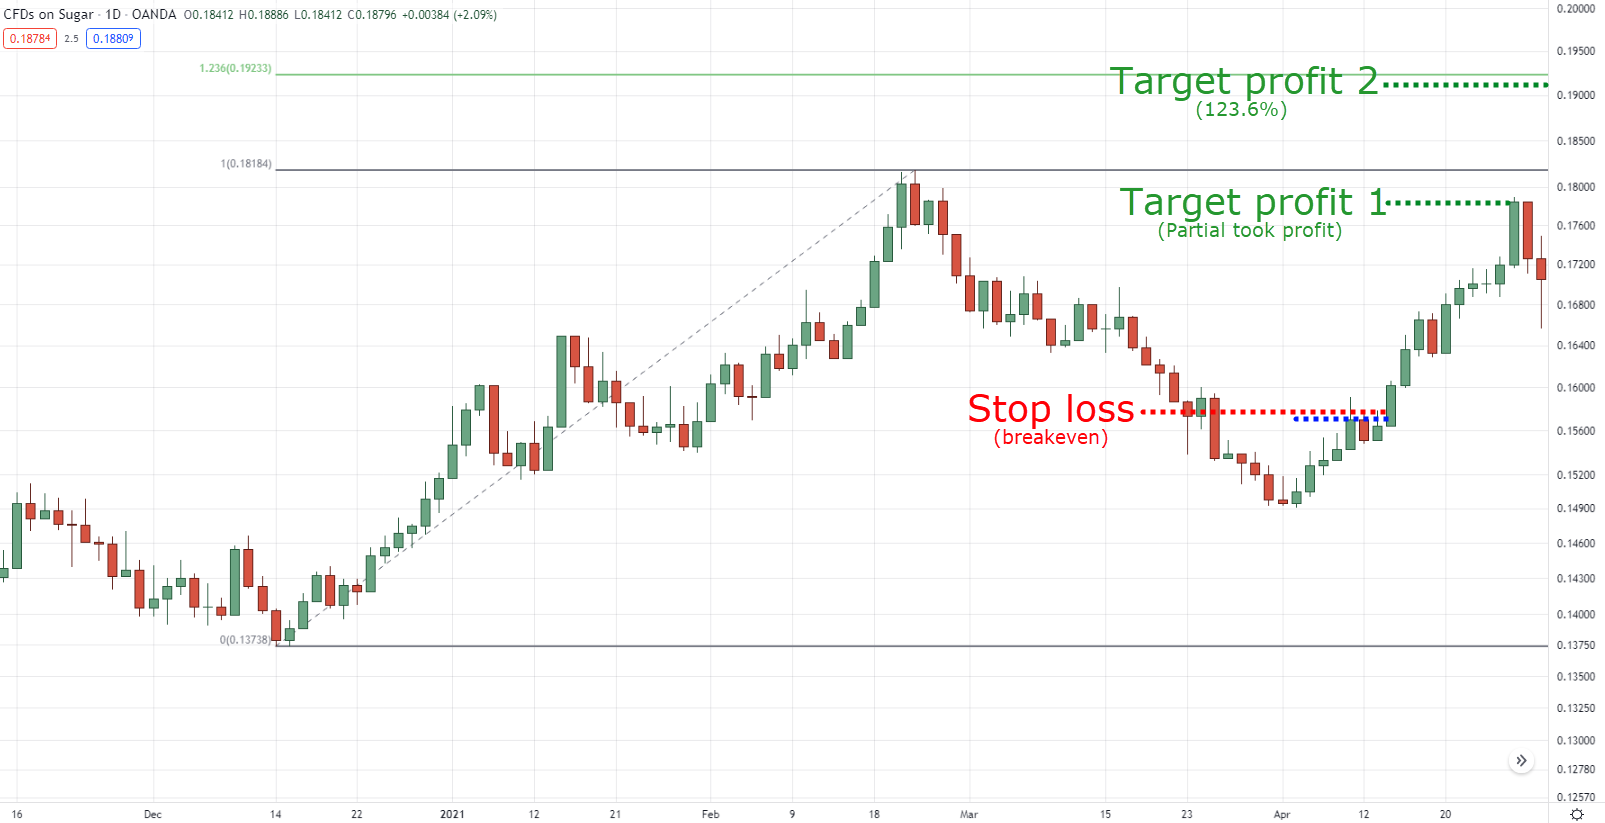
Simple, we use the Fibonacci extension tool and consider taking your profits at the 123.6% level.
123.6% take profit level on Sugar daily timeframe:
Finally…
What about scaling in?
Fibonacci trading – Scaling into your trade
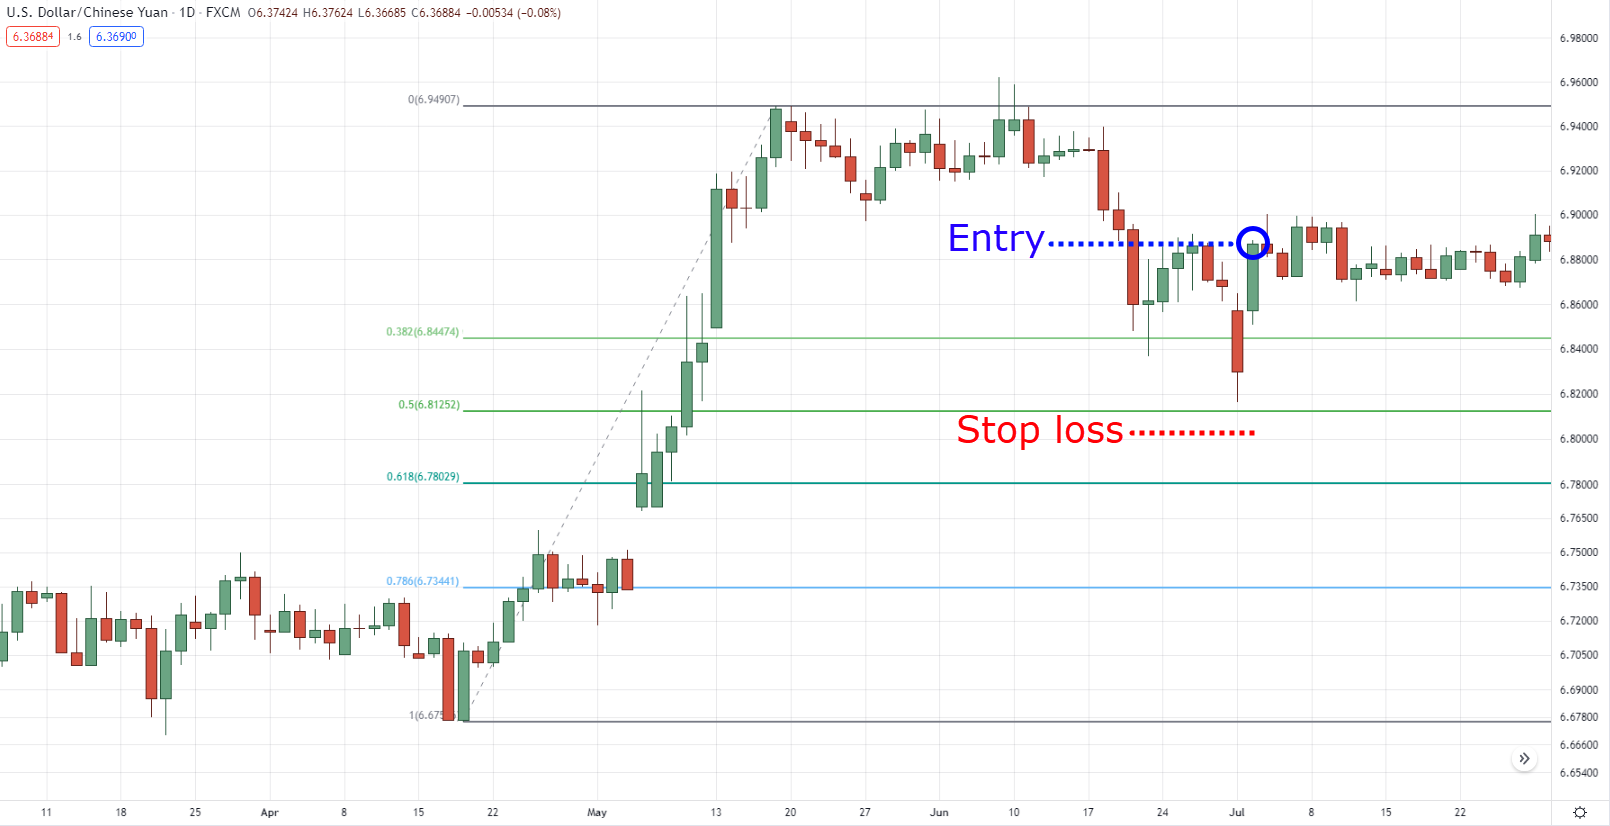
First, let’s look at a trading setup that you should be familiar with already.
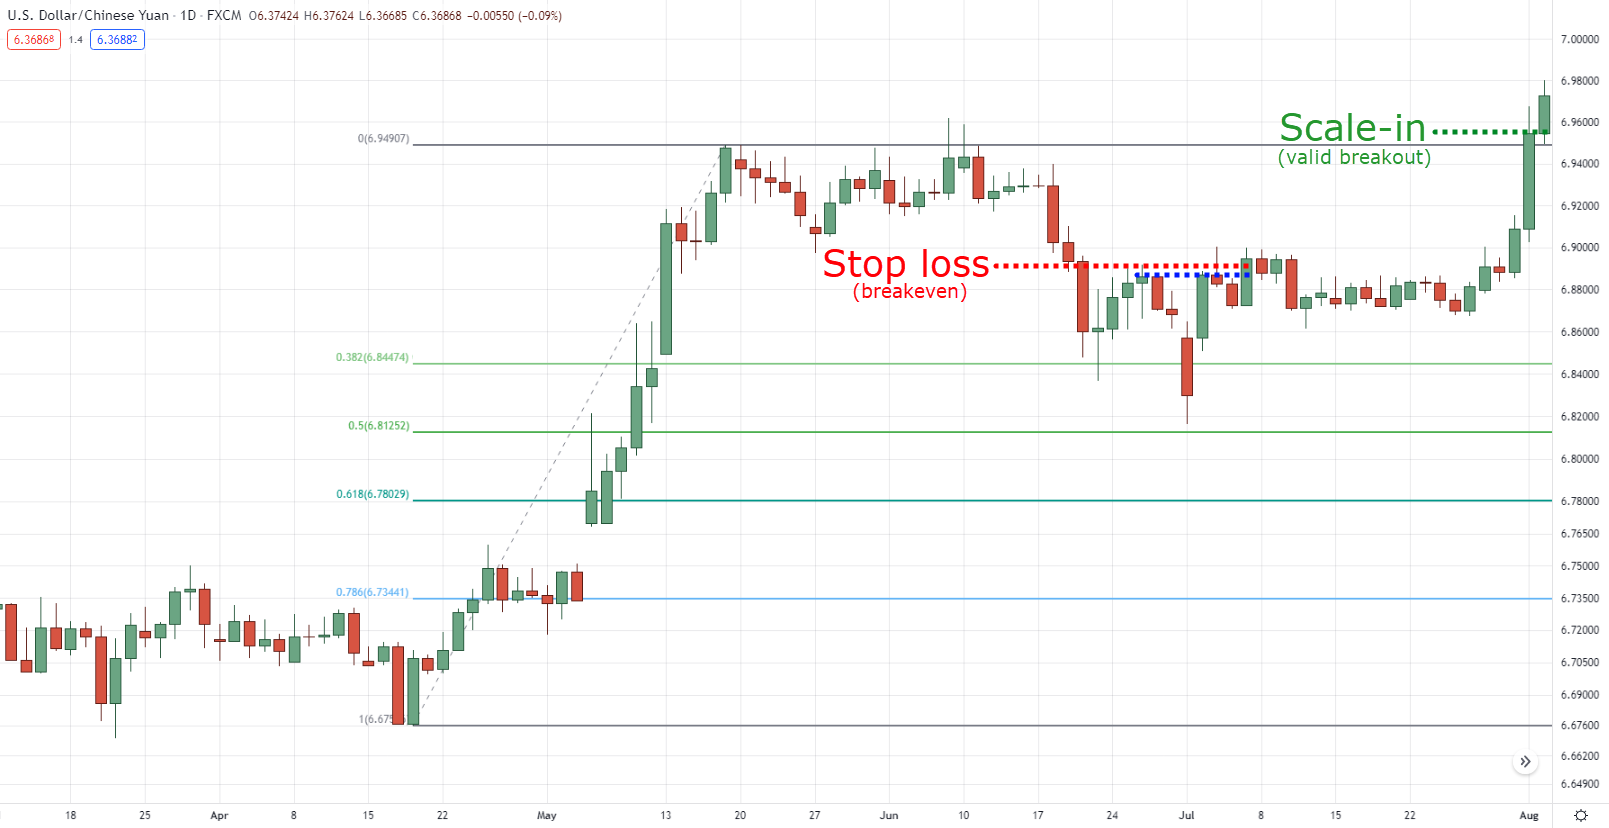
38.2% pullback setup on USDCNH daily timeframe:
What’s the difference now?
The setup is still the same, but instead of risking 1% per trade…
If your stop loss is hit, you’d be risking 0.5% risk per trade.
That’s right.
You trade with a smaller size!
Now, why would you want to do that, you may ask?
Imagine you’re dating someone…
If you give your 100% to that special someone at the early stage in dating and that person didn’t end up being the one, how would you feel?
Devastated, of course, it sucks!
But if you give a fraction of your effort to “test the waters” and see if this person is interested…
If it doesn’t work out, it would feel less painful because not much is invested.
It’s the same with this technique!
You want to make sure that the market is interested in you first by risking small…
Then eventually scale into your trade by risking another 0.5% once it closes and makes a valid breakout!
Scale in on USDCNH daily timeframe:
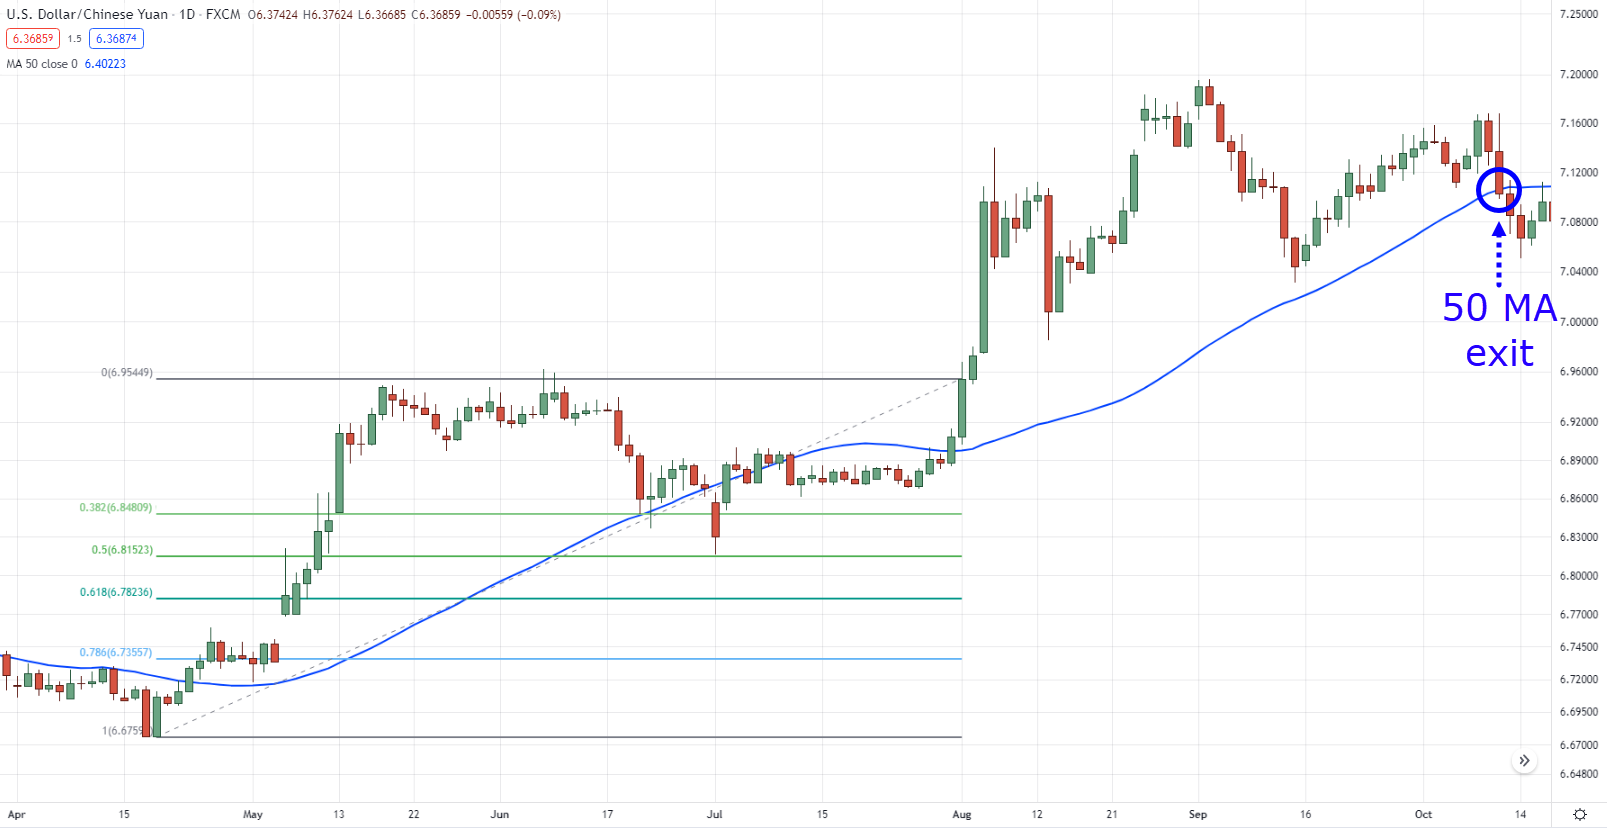
Instead of using the Fibonacci extension to have fixed profits, I suggest you use a trailing stop loss such as the 50-period moving average.
50-period moving average trailing stop loss on USDCNH daily timeframe:
Because it wouldn’t make sense to have fixed target profits now that things have worked out between you and the market.
That’s it!
That’s how you use Fibonacci for trading!
Sounds fantastic, right?
With that said, let’s do a quick recap on what you’ve learned today…
Conclusion
When used properly, the Fibonacci retracement and extension could be decisive in adding objectivity to your trading decisions.
But regardless of what you’ve learned today…
Always make sure to backtest some of these trading concepts to the point that you’ve owned the knowledge because it’s your trading journey, after all!
So here’s what I want to know…
Have you tried other Fibonacci tools out there?
How do you use Fibonacci in your trading?
Let me know in the comments below, and I’d love to learn from you as well.






Great content,the most information about fib in one blog ✨✨
Thank you JJ
Thank you, Salai!
JJ’s a pretty nice catch-phrase haha
“1, 1, 2, 3, 5, 8, 13, 21, 34, 55, 89, 144, 233, 477”
FYI, the last number shld be 377, not 477.
Thank you for pointing it out Lincoln!
I really appreciate your efforts on the topic you’ve taught us but please can u provide for us the actual real and profitable settings for the Fibonacci tools mostly the Fibonacci extension
Hey there Miracle, all of the settings I have showed you with the Fibonacci could be used for profitable trading!
Of course, a Fibonacci is only one moving part of your trading plan such as your market selection, risk management, and trade management, so it’s best you put your emphasis on that as profitability comes with the balance of all of those!
Your real life examples (pictures) are the best!
Hah, thanks, Nick!
Thank you to explain this topic very clearly.
You’re welcome, Icryps!
Glad you enjoyed the guide!
The fib is a great tool to use when trading and am so thank full for the more insights you have provided in this lesson especially the scaling in was fire. thank you so much Rayner.
Awesome to her that, Micheal!
You’re welcome!