You’ve probably seen headlines like these…
“Dow plunges 1000 points, erases gain for 2018!”
“Oil heads for seventh weekly loss on signs of global supply glut”
“Bitcoin crashes, now what?”
And you think to yourself…
Is this a good time to buy?
Well, not so fast.
Because the last thing you want is to catch a falling knife.
Instead, a better approach is to identify the Double Bottom pattern so you can pinpoint market reversals with deadly accuracy.
But first…
What is a Double Bottom Pattern and how does it work?
To be able to learn how to trade double bottom pattern, you must first know what it is and how it works in detail.
Now, a Double Bottom Pattern is a bullish trend reversal pattern (and we call the opposite a Double Top).
It has three parts to it:
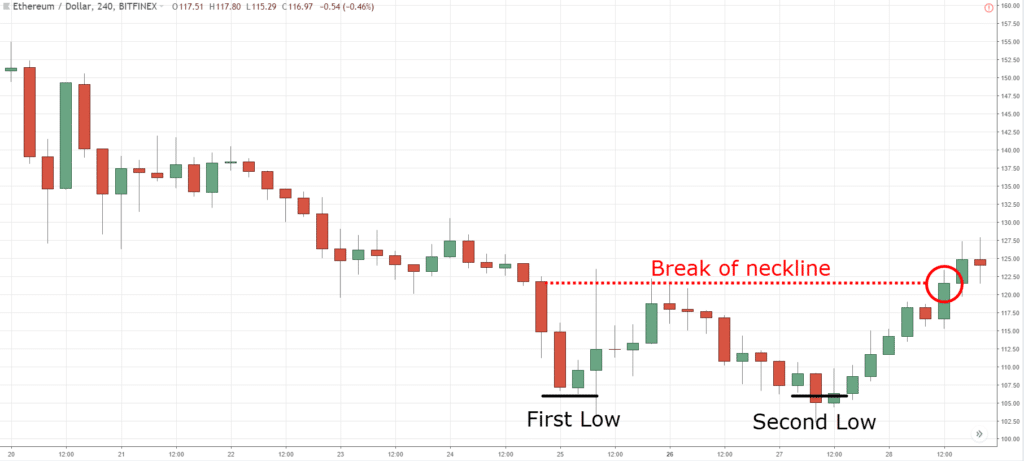
- First low – first price rejection
- Second low – second price rejection
- Neckline – an area of resistance
Now you’re probably wondering:
“What does a Double Bottom pattern indicate?”
I’ll explain…
First low – The market bounces higher and forms a swing low. At this point, it’s likely a retracement in a downtrend.
Second low – The market rejects the previous swing low. Now, there’s buying pressure, but it’s too early to tell if the market could continue higher.
Break of neckline – The price broke above the Neckline (or Resistance) and it signals the buyers are in control — the market is likely to move higher (this is also where you look for trading opportunities when it comes to double bottom trading)
In short, the Double Bottom Pattern signals the downtrend has possibly bottomed out, and the price is about to move higher.
Here’s what it looks like:
Seems easy, right?
But before you trade the Double Bottom pattern, you want to avoid this common trading mistake…
Don’t make this mistake when trading the Double Bottom pattern…
So what is it?
Well, many traders buy the break of the neckline after a Double Bottom is formed.
But watch out.
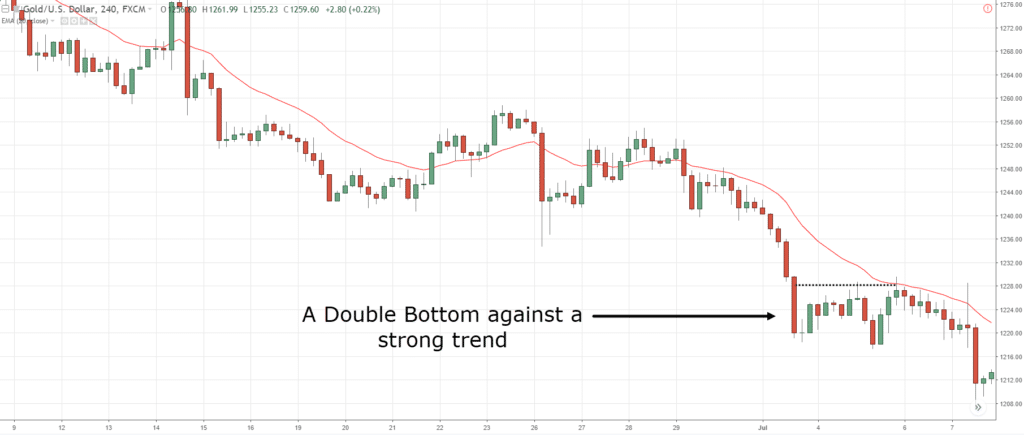
Because if the market is in a strong downtrend and it forms a “small” Double Bottom, then chances are, the market is likely to continue lower.
So how do you avoid it?
Here’s how…
- Add the 20-period Moving Average (MA) to your chart
- If the price is below the 20MA, don’t buy the Double Bottom
Here’s an example:
Now you’re probably wondering…
“Then how do I trade the Double Bottom pattern?”
Well, that’s what I’ll cover next.
Read on…
The False Break: How to trade the Double Bottom Pattern and profit from “trapped” traders
Now…
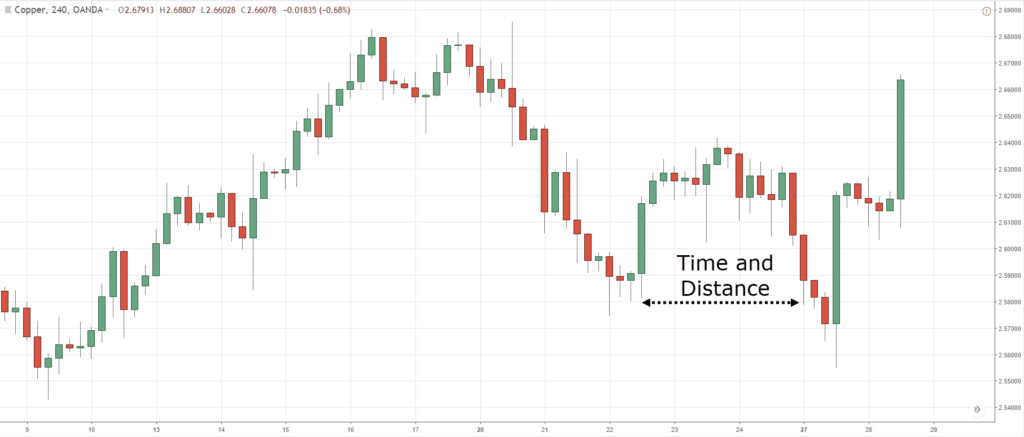
When you trade the Double Bottom, you must pay attention to the time and space between the lows — the larger the “gap”, the better.
Why?
Because when the lows are far apart, it gets the attention of more traders who could push the price higher.
Here’s what I mean…
And with this concept, you can use it to profit from “trapped” traders.
Here’s how…
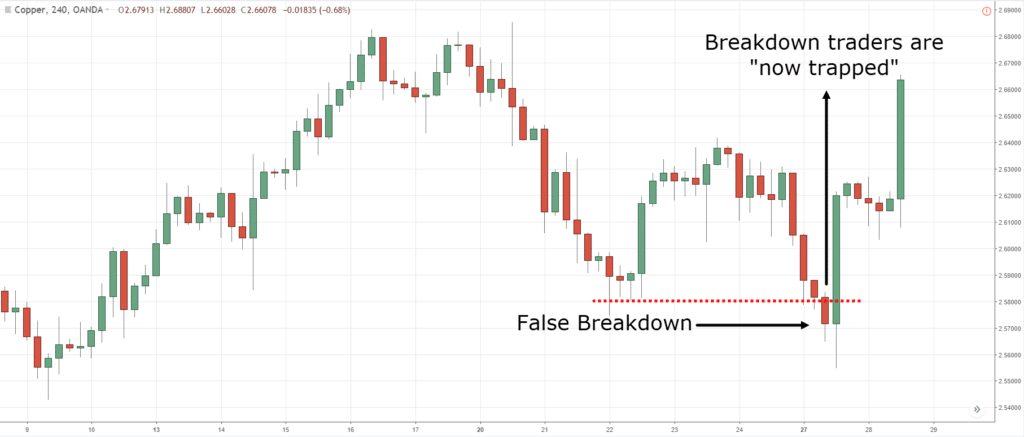
- The first and second lows should have time and space between them
- Let the price break below the first low
- Wait for a rejection of lower prices and then go long
An example:
The idea is simple.
As the price breaks below the first low, bearish traders will short the markets and have their stops above the lows.
But if the price quickly reverses higher, the short traders are “trapped”.
And you can take advantage of it by going long, anticipating if the price moves higher, it’ll trigger their stops and push the market in your favor.
That’s it!
That’s how to trade the double bottom pattern!
Does it make sense?
Great!
Then let’s move on…
The Double Bottom Breakout Technique
Here’s the thing:
You don’t want to “chase” a breakout after the Double Bottom is formed because the price is likely to reverse lower.
Instead, you want to see strength from the buyers before buying a breakout.
Here’s how to trade double bottom pattern…
- Identify a potential Double Bottom
- Let the price to trade break above the previous swing high
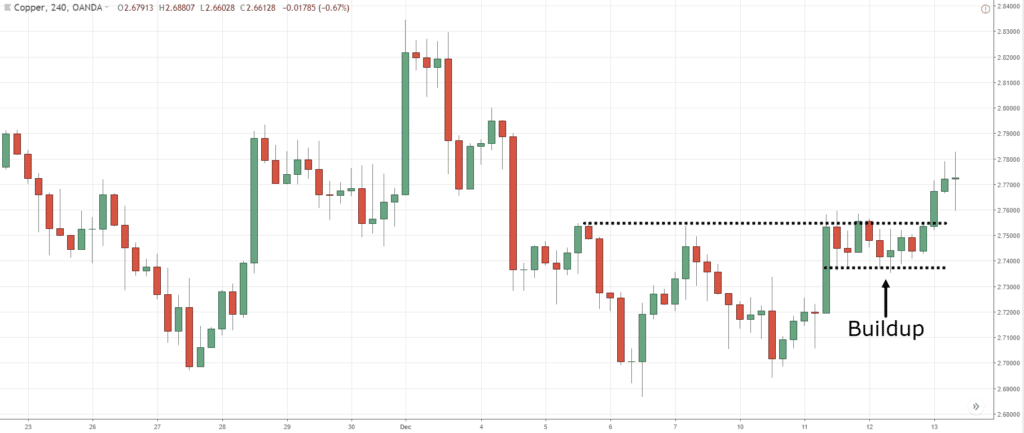
- Wait for a weak pullback to form (a series of small range candles)
- Buy on the break of the swing high
Here’s an example:
Now, this is a powerful technique for two reasons…
Higher probability trading setup
You’re not catching a falling knife. Instead, you have a double bottom trading strategy that lets the price break above the previous swing high to show strength from the buyers.
When there’s a weak pullback, it tells you there’s a lack of selling pressure. Also, you can set your stop loss below the swing low which offers a better risk to reward.
Now you might be wondering…
“But what if there’s no pullback, and the price makes a sudden breakout without warning?”
Well, that’s what I’ll cover next.
Read on…
Don’t chase the markets, do this instead…
Now:
If the price makes a sudden breakout, the last thing you want to do is “chase” the market.
Why?
Because you don’t have a logical place to set your stop loss, and you’ll likely get stopped out on the pullback or reversal.
So, what can you do?
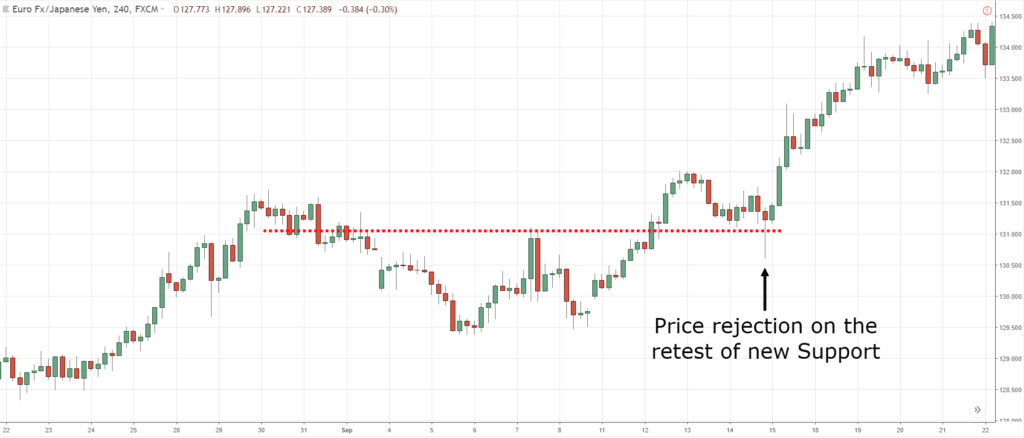
You wait for the re-test of the breakout level.
Here’s how…
- If the price makes a sudden breakout, wait for it to re-test previous Resistance turned Support
- If there’s a re-test, wait for a bullish reversal candlestick pattern to form
- If there’s a bullish reversal candlestick pattern, go long on next candle with stops 1 ATR below the low
Here’s what I mean…
Pro Tip:
Sometimes, the market might not re-test the level you’re looking at.
Instead, it’ll form a Bull Flag chart pattern (which is another setup you can trade).
If that happens, you can go long when the price breaks above the Bull Flag and have your stops 1 ATR below it.
How to pinpoint Double Bottom reversals with deadly accuracy
Here’s the deal:
Not all Double Bottom are created equal.
You can have two identical Double Bottom pattern, but one has a high probability of reversal, and the other is likely to fail.
So now the question is, how do you filter for the high probability pattern?
Well, the answer is…
Multiple Timeframes.
Here’s how it works…
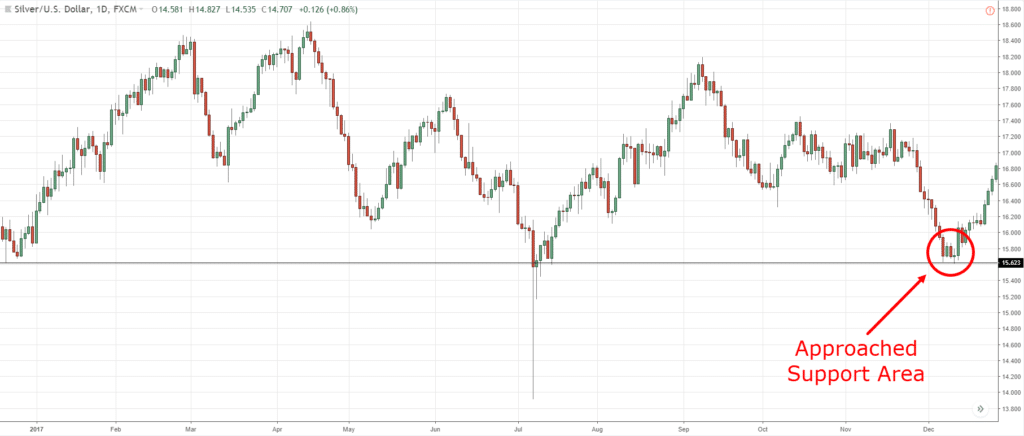
- Identify a higher timeframe Support area
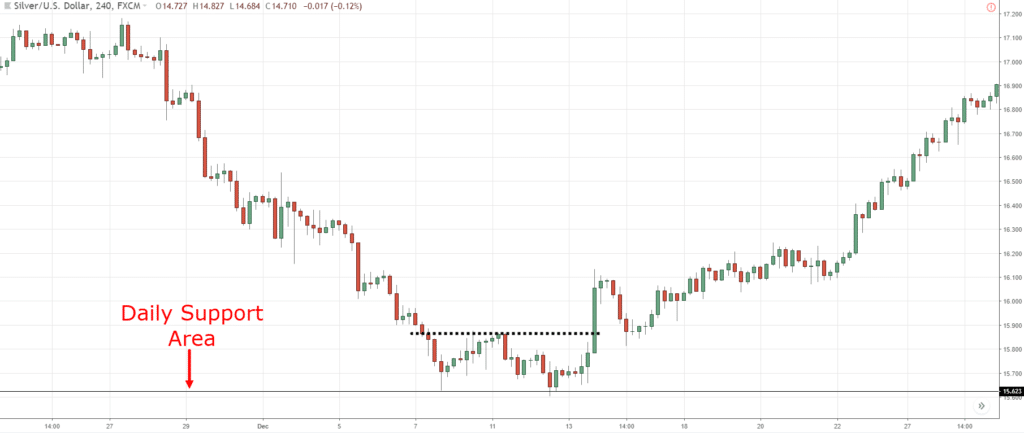
- Go down to a lower timeframe and look for a Double Bottom pattern that leans against the higher timeframe Support
Here’s an example:
On the higher timeframe, the price is at Support area…
On the lower timeframe, you get a Double Bottom pattern…
Now…
You can combine this multiple timeframe analysis with the entry techniques you’ve learned earlier — you’ll realize your reversal trades will dramatically improve.
There you go, that’s how you go about double bottom trading!
This is powerful stuff, right?
Conclusion
So here’s what you’ve learned today:
- The Double Bottom signals the downtrend has possibly bottomed out and the price could possibly move higher
- Don’t buy a Double Bottom in a strong downtrend (when the price is below 20MA)
- You can use the False Break technique to profit from “trapped” traders
- If you want to trade the Double Bottom Breakout, wait for a buildup to form at the neckline so you have a favorable risk to reward
- You can use multiple timeframes to improve the accuracy of your reversal trades
Now, it’s your turn to share…
How do you trade the Double Bottom Pattern?
Leave a comment below and share your thoughts with me.


…brilliantly written article as always!!
Thank you, Gavin!
Good job Rayner, appreciate your efforts in sharing your knowledge and helping retail traaders like us. Thanks
You’re welcome bud!
so great Rayner ….thank you so much
My pleasure, Ali!
Thank you Rayner I didn’t know how to trade. I lost a lot . Thanks to you video lessons I am doing much better. Gracias.
Hi Eddy,
You are welcome.
Cheers.
Pagol kothakar
Excellent explanation Rayner. If I see a valid double bottom and subsequent price action, I use a very similar technique for exiting a long term trend trade.
Nice!
You open my eyes.i will recommend my fellow country men to follow you.thank you
Cheers Tumelo!
I always combine it with an rsi oversold but it should rest on the higher time frame support
Thanks for sharing!
Im really impressed in how you make something so complicated so easy to understand…
I’m happy to be of help!
Rayner I will tell you the truth this article is what we call eye opener …you just explained what is giving me headache for so long ….in short you a good tutor Rayner
I’m glad to be of help, Fatai!
Thank you Rainer. Very well written.
Cheers!
Tks Rayner. Very interesting and well described
Thank you, Alan!
Amazing .. You explained it so well.. Thank you
You’re welcome, Dipti!
Sounds really logical, yet few will think of it! Thanks!
My pleasure!
Hi Rayner,I have never seen someone so giving like you(unselfish), I have paid thousands of dollars before for useless material ,but now I am getting world-classs teaching/material for free.
Thanks very much.
God blessed you
Mankgodi (south Africa)
Thank you for your kind words, I appreciate it!
Rayner… you’re an inspiration to us! Thanks a lot for your super extra effort…
You’re welcome, Toniagot!
thank you my great man
Cheers Sina!
Thank you very much Rayner,
You are a master in explaining the trading system with clear pictures.
My pleasure bud!
Thanks Mr Teo,
You’re welcome, Bukuru!
I’m so grateful for sharing your ideas, my confidence level up after all what i learned from you, a million thanks Rayner
Awesome to hear that, Friah!
Unbeatable explanation. Thanks a lot.
My pleasure!
You are simply the best I have met in my trading journey. Big thanks
I’m glad to be of help, cheers!
Thanks again Raynor
Cheers
I’ve enjoyed all your presentations on YouTube, you’re an excellent teacher… many thanks and blessing for your continued success.
Thank you, Lydia!
As a trend follower,
sometimes I use this strategy without realizing it.
especially the part where u said don’t buy the double bottom wen price is beneath the 20MA(bcus I apply 20MA,50MA and 200MA )
U have opened my eyes to see that I’m on the part to be a successful and great trader.
I think trend followers can also incorporate this strategy too
THANKS RAYNER
Awesome to hear that, Daniel!
Hi Rayner thank you for sharing good stuff king
Cheers!
Wow the best explanation i have seen, thanks I will definitely be trying this out in my trading.
Let me know how it works out for you, cheers!
Superb explanation sir
Thank you, Jyothi!
Great stuff Rayner , you content is so amazing , i have learned a lot from you stuff, do great the world will be a better place . My friend .
I appreciate the kind words, Lindani!
I use RSI divergence from oversold zone and bullish engulfing candle to enter
Thanks for sharing!
Just founded another pattern to try, thanks for posting lots of lessons for us who just started trading.
You’re welcome, Kevin!
Great stuff my friend
Thank you!
Great Article. More Grace to you.
Cheers
Hi Rayner, do you have an ebook on double tops and bottoms if so please share link.
I don’t have.
I read almost your techniques and following you, really I liked, thanks for grooming me as good trader, thanks Rayner for sharing your tips and ideas:)
You’re welcome, Kannan!
Wow wonderful you make trading easy good job bro
It ain’t easy, but hopefully, with the concepts I’ve shared, it makes you lose less and hopefully, make some.
I learned a lot bro. Thank you so much ..soon I will join pro traders edge
You’re welcome!
Thank you very much Rayner for such a elobarative explanation.Even a beginner can quickly catch up…Keep going Rayner and many thanks once again..
Cheers
I just want to ask sir, what if the double bottom pattern is underneath, the 20 EMA but crossing it . I want to show the picture but dont know how to upload it.
Thanks a lot Reyner
Cheers
Best Tutor of our time. Best ever happening to us in the trading world. I hope the world of traders realize what you are doing someday soon. You deserve an International Recognition…
Glad to be of help!
Beautifully explained
Highly appreciated
Shall go with it
N
If I succeed i will cum back here to inform u
Thanks
Hi Ravi,
I’m glad to hear that!
Cheers…
Thanks for the info but not trading a double bottom when the price falls below the 20ma is too restrictive. In almost any down trend the price will break the 20ma. One would miss 80% of the double bottoms if not 90%
Hi Hans,
Thanks for contributing. Means a lot.
Cheers.
You’re a hero as always
Hey Alexander,
You are our hero!
Cheers.
can I trade using double bottom using 3,5,10 min time frames ?
Thank you for this information.
Can you tell something about potential targets with this patterns?
I ditch almost all indicators. I’m thankful that I read your blog. Appreciate you sharing your insights in trading.
Awesome, Whzz!
Awesome bro
Thumbs up, Ashish!
reminder to self: always refer back to tradingwithrayner before action on any position. =)
Hi, Eileen!
Thanks for sharing. So Glad to hear that Tradingwithrayner helps you on your trading journey.
Cheers!
Cool article. I have learned a lot. Thanks. Goood wooork.
Hi Victor!
Jarin here from TradingwithRayner Support Team.
I am glad to know you learn a lot from our blogs!
Cheers to that!
EW, Looks like a nearly perfect double bottom on both the daily and weekly charts.
great learning. learned lot from you….. hope will meet you one day….
Thanks, Ravi!
Once I lost some of my double top trades, I was thinking of alternative ways to survive on the pattern. I put a strategy to a paper which drawn on my mind, and Googled it.
Finally, I just found your article. You know what? your strategy is exactly the same with my (mind) drawing!
A bunch of thanks Rayner for confirming it!
Glad to know that Indika!