Have you ever traded the Symmetrical Triangle chart pattern (aka Symmetrical Wedge pattern)?
If you did, then you know it’s not as easy as it seems.
For example:
You might have thoughts like…
Should I trade the breakout of the Symmetrical Triangle or do I wait for a pullback?
Where should I put my stop loss so the market doesn’t hunt my stops?
How do I know which direction the Symmetrical Triangle break out?
Now if you face any of those issues, don’t worry.
Because in today’s lesson, you’ll have the answers to these questions (and more).
You’ll learn:
- What a Symmetrical Triangle chart pattern is and how it works
- Don’t make this BIG mistake when trading the Symmetrical Triangle, here’s why…
- How to better time your entries when trading the Symmetrical Triangle
- Symmetrical Triangle: How to maximize your profits and ride enormous trends
- A Symmetrical Triangle Trading Strategy
OK, let’s get down to business…
What is a Symmetrical Triangle chart pattern and how does it work?
The Symmetrical Triangle (aka Symmetrical Wedge pattern) is a volatility contraction pattern.
This means volatility in the market is shrinking and a sign the market is likely to breakout, soon.
Now you’re probably wondering:
“So how do I identify a Symmetrical Triangle?”
Here’s how…
How to identify a Symmetrical Triangle correctly
- The sides of the triangle slope equally (that’s why it’s symmetrical)
- The triangle has lower highs AND higher lows – at least two of each
- It looks like a funnel, with the price “squeezing” from the left towards the right
Now, the price cannot be “squeezed” forever.
Eventually, it must break out.
And when it happens, it offers profitable trading opportunities for the astute trader (more on that later).
But for now, here’s an example of a Symmetrical Triangle…
Pro Tip:
A Symmetrical Triangle pattern usually takes a few months to form.
If the duration is only a few days or weeks, then it’s probably not a Symmetrical Triangle and possible another Trend Continuation pattern (like Flag, Pennant, etc.).
Don’t make this BIG mistake when trading the Symmetrical Triangle, here’s why…
Now…
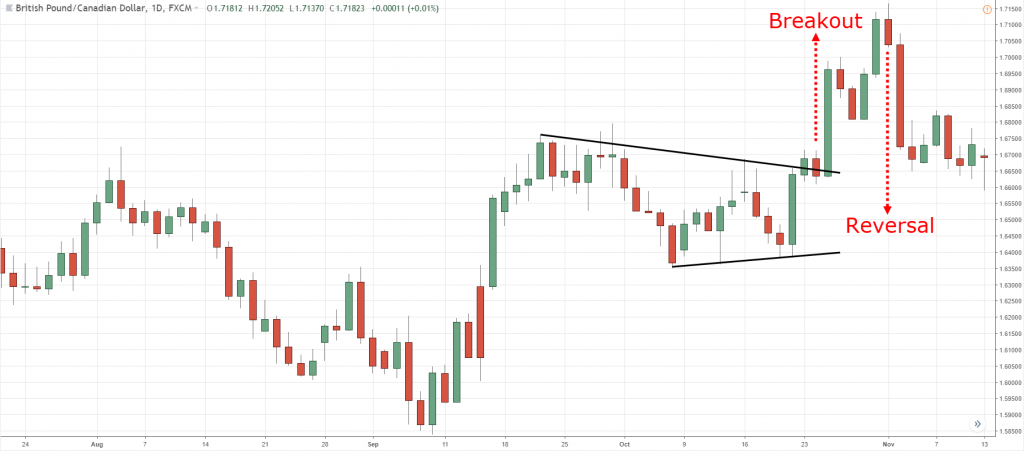
A common mistake traders make is “chasing” the breakout of a Symmetrical Triangle.
Why?
Because in the short-term, the buying pressure is exhausted and have no more “energy” to push the price higher.
So what happens?
The “smart money” starts to take profit.
Then, bearish traders will look to short the markets.
Slowly, the market starts to reverse…
At this point, traders who bought the highs are sitting in the red.
And when they can’t take the pain any longer, they cut their losses.
The result?
Increased selling pressure which causes the market to reverse lower.
Here’s how it looks like…
Now you’re wondering:
“Is there a better way to trade the Symmetrical Triangle?”
You bet!
And that’s what I’ll cover next.
Read on…
How to better time your entries when trading the Symmetrical Triangle
You’ve probably heard this a gazillion times…
The trend is your friend.
And it’s true.
So, how do you trade with the trend?
Well, you can use an indicator like the Moving Average (MA).
For example…
If the price is above the 200-period MA, then you have a long bias.
If the price is below the 200-period MA, then you look a short bias.
Using this simple rule, you’ll be on the right side of the market more often than not — and improve your winning rate.
Next…
Let’s find out how you can better time your entries when trading the Symmetrical Triangle.
Here are 2 techniques you can use:
- Trailing stop loss
- The Re-test
I’ll explain…
The first pullback
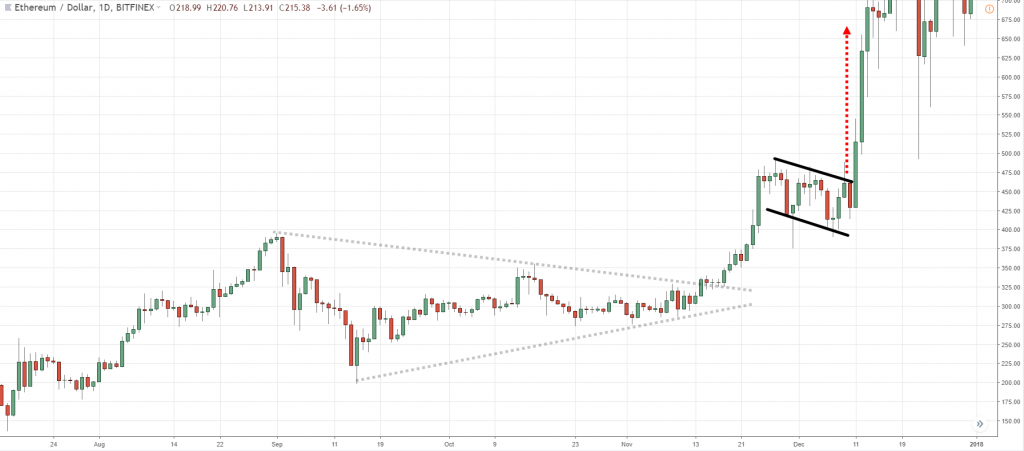
Often, the price breaks out of the Symmetrical Triangle and it becomes “overextended”.
Here’s how to trade Symmetrical Triangle using the first pullback:
Now, you don’t want to enter right now because the price is “overextended” and your stop loss is wide.
So, what do you do?
Well, you can wait for a pullback to occur (like a Bull Flag pattern).
Once it’s formed, you can long the break of the highs and have your stop loss below the swing low.
This offers a more favorable risk to reward on your trade.
An example:
Next…
The Re-test
Sometimes…
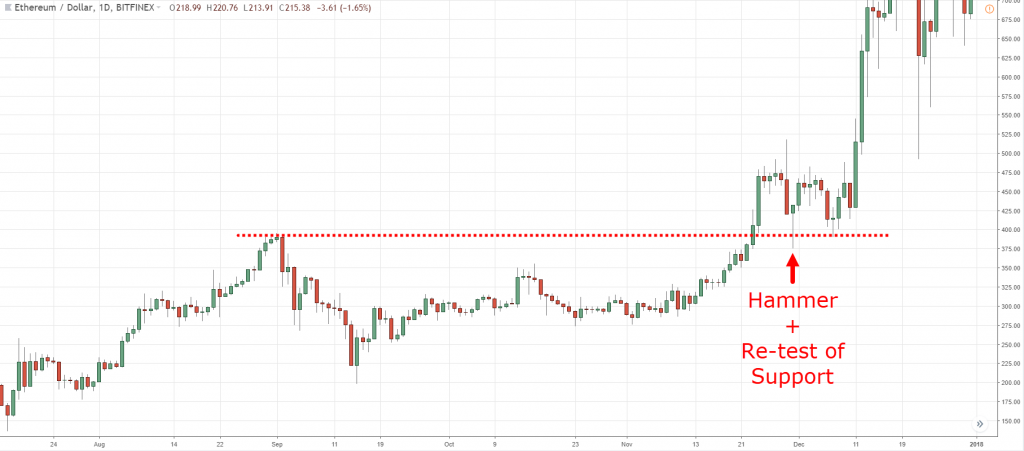
When the price breaks out of the Symmetrical Triangle, it might re-test the previous market structure.
If it does, you can look for a reversal candlestick pattern (like Hammer, Engulfing pattern, etc.) to time your entry.
Here’s an example…
Moving on…
Symmetrical Triangle: How to maximize your profits and ride enormous trends
Here are 2 techniques you can use:
- Trailing stop loss
- Price projection
I’ll explain…
1. Trailing Stop Loss
Here’s the thing:
No one knows how high or low the market can go.
And by trailing your stop loss, you allow the market to reward you as it moves in your favor.
Over here, you’ll not be limited by a Symmetrical Triangle pattern’s target profit level.
For example:
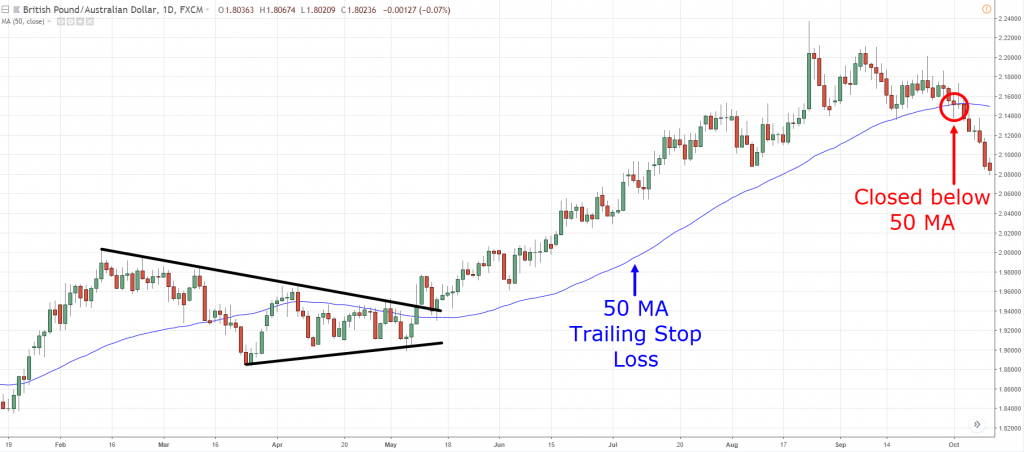
You can use the Moving Average (MA) to trail your stop loss.
For example:
You can use the 50MA to trail your stop loss
If the price closes below it, then you’ll exit the trade.
Here’s what I mean…
Pro Tip:
You can use the 20MA if you want to ride short-term trends or 200MA if you want to ride long-term trends.
Now…
If you want to learn more, go watch this training video below on how to trail your stop loss…
2. Price projection
This technique is based on classical charting principles.
Here, you’ll project the Symmetrical Triangle pattern’s target profit level.
Here’s how it works:
- Take the distance between the high and the low of the Symmetrical Triangle — the widest point of the pattern
- “Copy and paste it” at the breakout point
- Exit your trade at the price projection level
Here’s an example:
Symmetrical Triangle Trading Strategy
Now, let’s take what you’ve learned and develop a trading strategy.
If you have followed me for a while, you know I like to use the IF-THEN template to develop my trading strategies.
Here’s how it works…
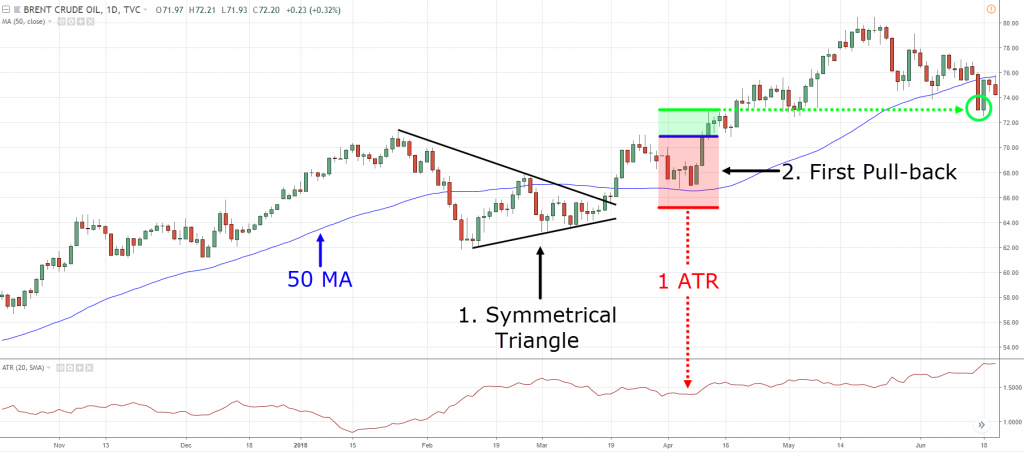
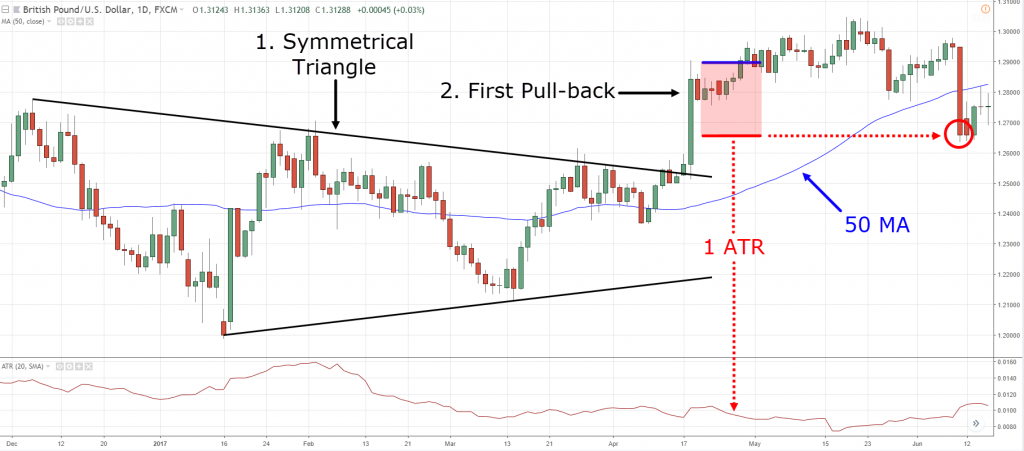
If the price forms a Symmetrical Triangle, then wait for the price to break out.
If the price breaks out, then wait for the first pullback (ideally small bodied candles).
If the price does a pullback, then go long on the break of the highs.
If the price breaks the highs, set your stop loss 1 ATR below the swing low.
If the price moves in my favor, then trail my stop loss using the 50MA.
Here are some examples…
Red = Initial Stop Loss
Blue = Entry
Green = Exit
Brent Crude Oil Daily:
USD/JPY Daily:
GBP/USD Daily:
Frequently asked questions
#1: You mentioned that a Symmetrical Triangle usually takes a few months to form. Other than that, is volume important in trading the Symmetrical Triangle?
I don’t look at volume for my trading.
#2: How do we know if a Symmetrical Triangle is bullish or bearish in nature?
One way to tell is to look at the trend of the higher timeframe.
If the higher timeframe is in an uptrend, then chances are, the symmetrical triangle would breakout higher.
If the higher timeframe is in a downtrend, then it will likely breakdown lower.
Conclusion
Here’s what you’ve learned today:
- The Symmetrical Triangle is a sign the market is about to break out
- Don’t “chase” the breakout of a Symmetrical Triangle because that’s when the price is likely to reverse
- You can enter on the First Pullback or Re-test of the Symmetrical Triangle
- You can maximize your profits by using a trailing stop loss or the price projection technique
- A Symmetrical Triangle trading strategy (a template you can use)
Now here’s a question for you…
How do you trade the Symmetrical Triangle chart pattern?
Leave a comment below and share your thoughts with me.
2. Price projection
This technique is based on classical charting principles.
Here’s how it works:
- Take the distance between the high and the low of the Symmetrical Triangle — the widest point of the pattern
- “Copy and paste it” at the breakout point
- Exit your trade at the price projection level
Here’s an example:
Symmetrical Triangle Trading Strategy
Now, let’s take what you’ve learned and develop a trading strategy.
If you have followed me for a while, you know I like to use the IF-THEN template to develop my trading strategies.
Here’s how it works…
If the price forms a Symmetrical Triangle, then wait for the price to break out.
If the price breaks out, then wait for the first pullback (ideally small bodied candles).
If the price does a pullback, then go long on the break of the highs.
If the price breaks the highs, set your stop loss 1 ATR below the swing low.
If the price moves in my favor, then trail my stop loss using the 50MA.
Here are some examples…
Red = Initial Stop Loss
Blue = Entry
Green = Exit
Brent Crude Oil Daily:
USD/JPY Daily:
GBP/USD Daily:
Frequently asked questions
#1: You mentioned that a Symmetrical Triangle usually takes a few months to form. Other than that, is volume important in trading the Symmetrical Triangle?
I don’t look at volume for my trading.
#2: How do we know if a Symmetrical Triangle is bullish or bearish in nature?
One way to tell is to look at the trend of the higher timeframe.
If the higher timeframe is in an uptrend, then chances are, the symmetrical triangle would breakout higher.
If the higher timeframe is in a downtrend, then it will likely breakdown lower.
Conclusion
Here’s what you’ve learned today:
- The Symmetrical Triangle is a sign the market is about to break out
- Don’t “chase” the breakout of a Symmetrical Triangle because that’s when the price is likely to reverse
- You can enter on the First Pullback or Re-test of the Symmetrical Triangle
- You can maximize your profits by using a trailing stop loss or the price projection technique
- A Symmetrical Triangle trading strategy (a template you can use)
Now here’s a question for you…
How do you trade the Symmetrical Triangle chart pattern?
Leave a comment below and share your thoughts with me.





Enter on the first pullback or re-test the symmetrical triangle.
Use a trailing stop or price rejection to maximize profit.
Yup yup.
Thanks
cheers
First re-test then I enter
After symmetrical triangle breakout do not chase it, wait for first pullback/re-test then enter!..
Nice!
By waiting for the first pull back or retest after a breakout then you shoot it
Don’t shoot me.
has ha > shoot the market not you Rayner
RAYNER YOU ARE TRULY A HERO FOR STOCK MARKET LEARNING
Cheers bud
U are the best teacher
Cheers bud
Excellent thanks!
Cheers!
Great teacher
Brother Rayner
You’re the best teacher of my learning trading experience …
Thanks a lot bro
My pleasure!
Rayner you are really one of the best. you type is rare.. tanx for the unmerited knowledge you ave shared
My pleasure!
1st- Find a symmetrical pattern.
2nd- Wait for the breakout.
3rd- Wait more for the first pullback.
4th- Trade the long, putting 1 ATR as stop loss.
Thanks for all the examples
My pleasure!
Hi Rayner,it’s a great learning from you but i have a question why do you use volume in your analysis?
I don’t use it in my trading but I’m currently researching on it.
Thanks for the knowledge
My pleasure!
Raynor pls what tool do u use for writing and drawings in ur videos and chart, they’re really helpful pls how do I get them ,anyways first pullback is a deadly price action and it really pays thnx
I use Camtasia for it.
What would a reasonable projection in a ATH breaking scenario?
This article is super useful, thank you Rayner!
Would this apply to any timeframe?
Hi Carl,
A Symmetrical Triangle usually takes a few months to form.
If the duration is only a few days or weeks, then it’s probably not a Symmetrical
If symmetric triangle breakout and then retest where can I place my initial SL? 1). Below retest Trendline ?
2 ) below opposite slope trendline ?
[…] are other variations to it like Symmetrical Triangle and […]
Charts and Trading – You made it so clear and easy…thanks!!!
You’re welcome!
thanks Reyner…crystal clear..
You are most welcome, Rajesh!