You’ve probably heard the term Double Top hundreds of times.
And you might have even attempted to trade this pattern yourself.
But when you look at the charts in real time, it’s not as simple as it seems.
You encounter issues like:
Do I enter on the re-test or the break of the neckline?
Do I set my stop loss above the highs?
Should I wait for confirmation first?
Now it can get frustrating, right?
But here’s the good news:
In this trading guide, you’ll learn how to trade the Double Top chart pattern step by step — that includes specific trading strategies and techniques you can use to profit in the financial markets.
Specifically, you’ll learn:
- What is a Double Top chart pattern and how does it work
- Don’t make this fatal MISTAKE when trading the Double Top chart pattern
- The ONE thing you must pay attention to when trading Double Top
- A Double Top trading strategy that takes advantage of “trapped” traders
- Double Top Breakout: How to find insanely profitable risk to reward trading setups
- How to use the Double Top chart pattern and pinpoint market reversals with deadly accuracy
Or if you prefer…
You can watch this training video below:
What is a Double Top chart pattern and how does it work
A Double Top is a reversal chart pattern.
It consists of three parts:
- First Peak – the first price rejection
- Second Peak – the second price rejection (retest of previous high)
- Neckline – an area of Support
Here’s an example:
Now you’re probably wondering:
“What does the Double Top chart pattern really mean?”
I’ll explain…
First peak – The market does a pullback. At this point, you can’t tell for sure if it will be a reversal as trending markets do a pullback from time to time.
Second peak – The market got rejected at the same area, again. This is a first sign that the market could reverse lower.
Break of neckline – The sellers are in control and the market could continue lower.
So in essence, the Double Top chart pattern signals a possible trend reversal as the market is unable to move higher.
Does it make sense?
Great!
Because in the next section, you’ll learn the biggest mistake traders make when trading the Double Top chart pattern — and how you can avoid it.
Don’t make this deadly mistake when trading the Double Top chart pattern…
Here’s the deal:
Not all Double Top chart patterns are created equal.
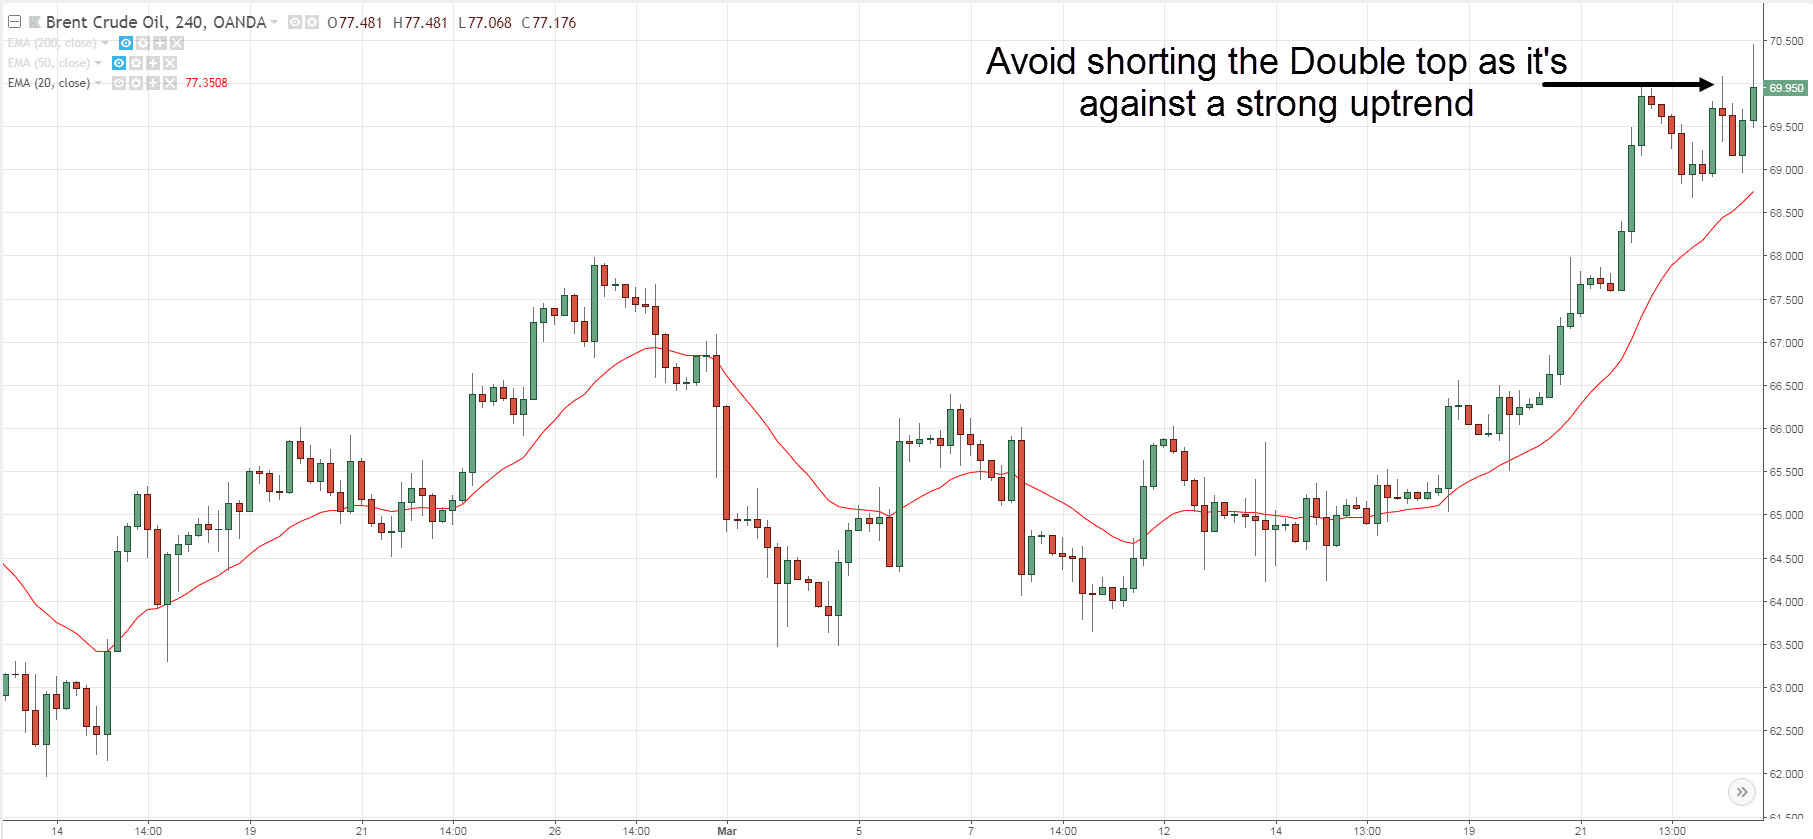
If you spot a Double Top in a strong uptrend, chances are, the market will continue heading higher.
So, the last thing you want to do is go short just because you spot a Double Top chart pattern.
Here’s what I mean…
So a simple filter you can use is this…
If the market is consistently above the 20MA, don’t short a Double Top chart pattern.
“Rome was not built in a day and no real movement of importance ends in one day or in one week. It takes time for it to run its logical course”. — Jesse Livermore
This is the ONE thing you must pay attention to when trading Double Top chart pattern…
It’s called time and space.
Now it may seem like there are 2 things, but it’s only 1 because “time and space” is a name I’ve given.
Here’s how time and space works…
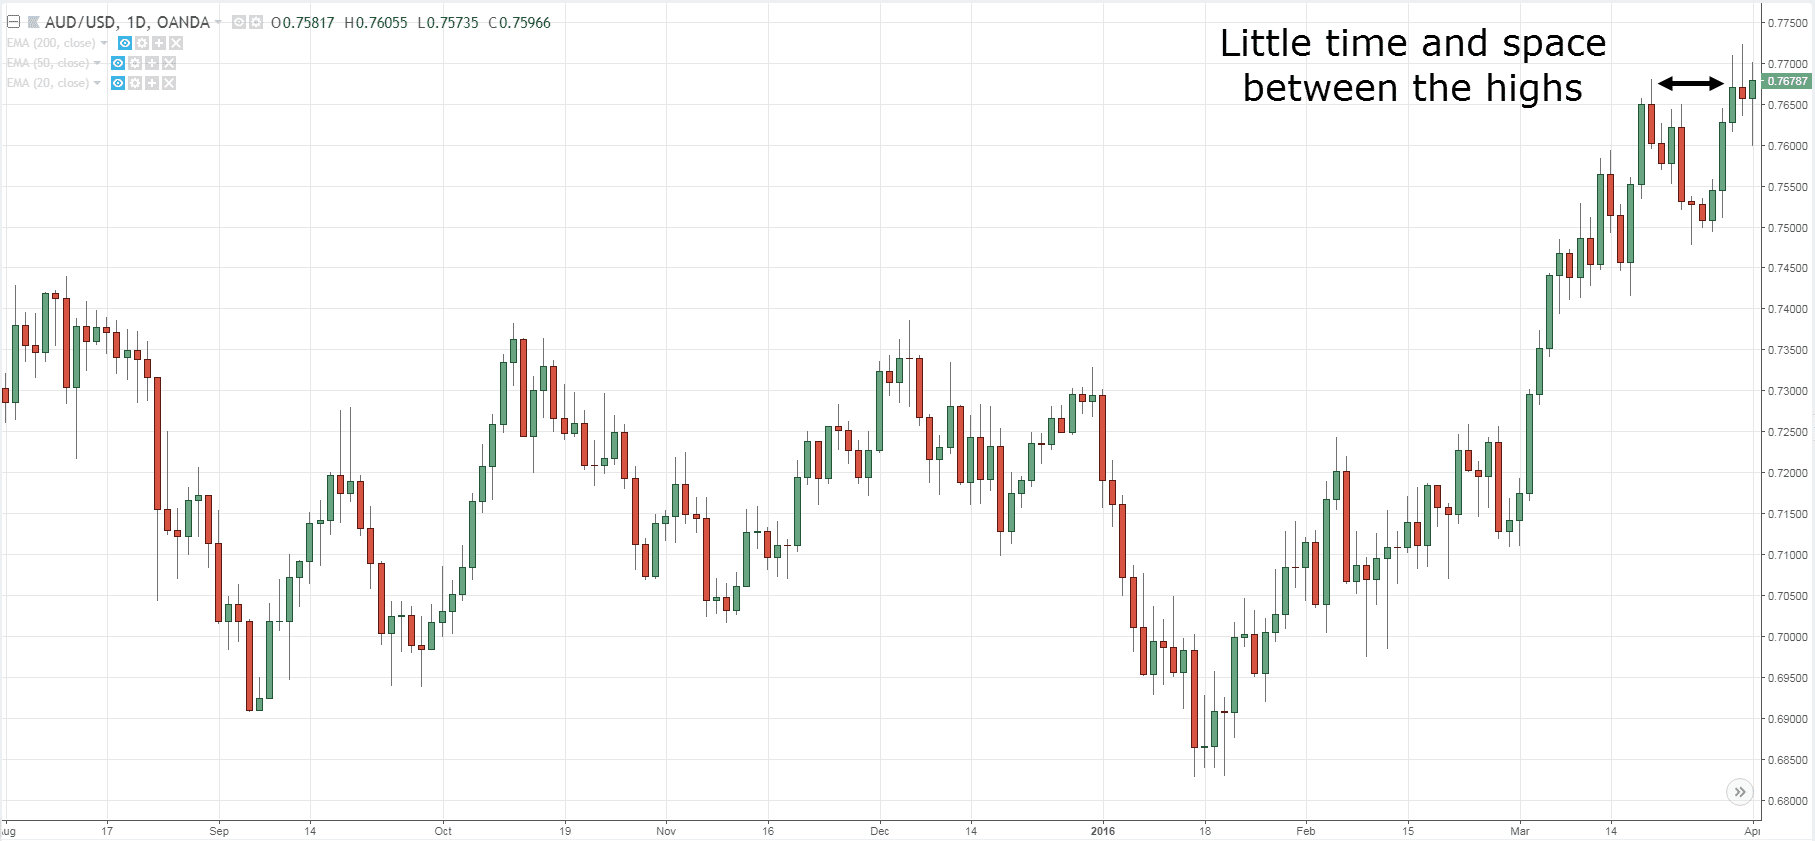
Recall, I mentioned you don’t want to short a Double Top against a strong uptrend.
And if you look at the chart below, the time and space between the first and second peak are very close.
An example:
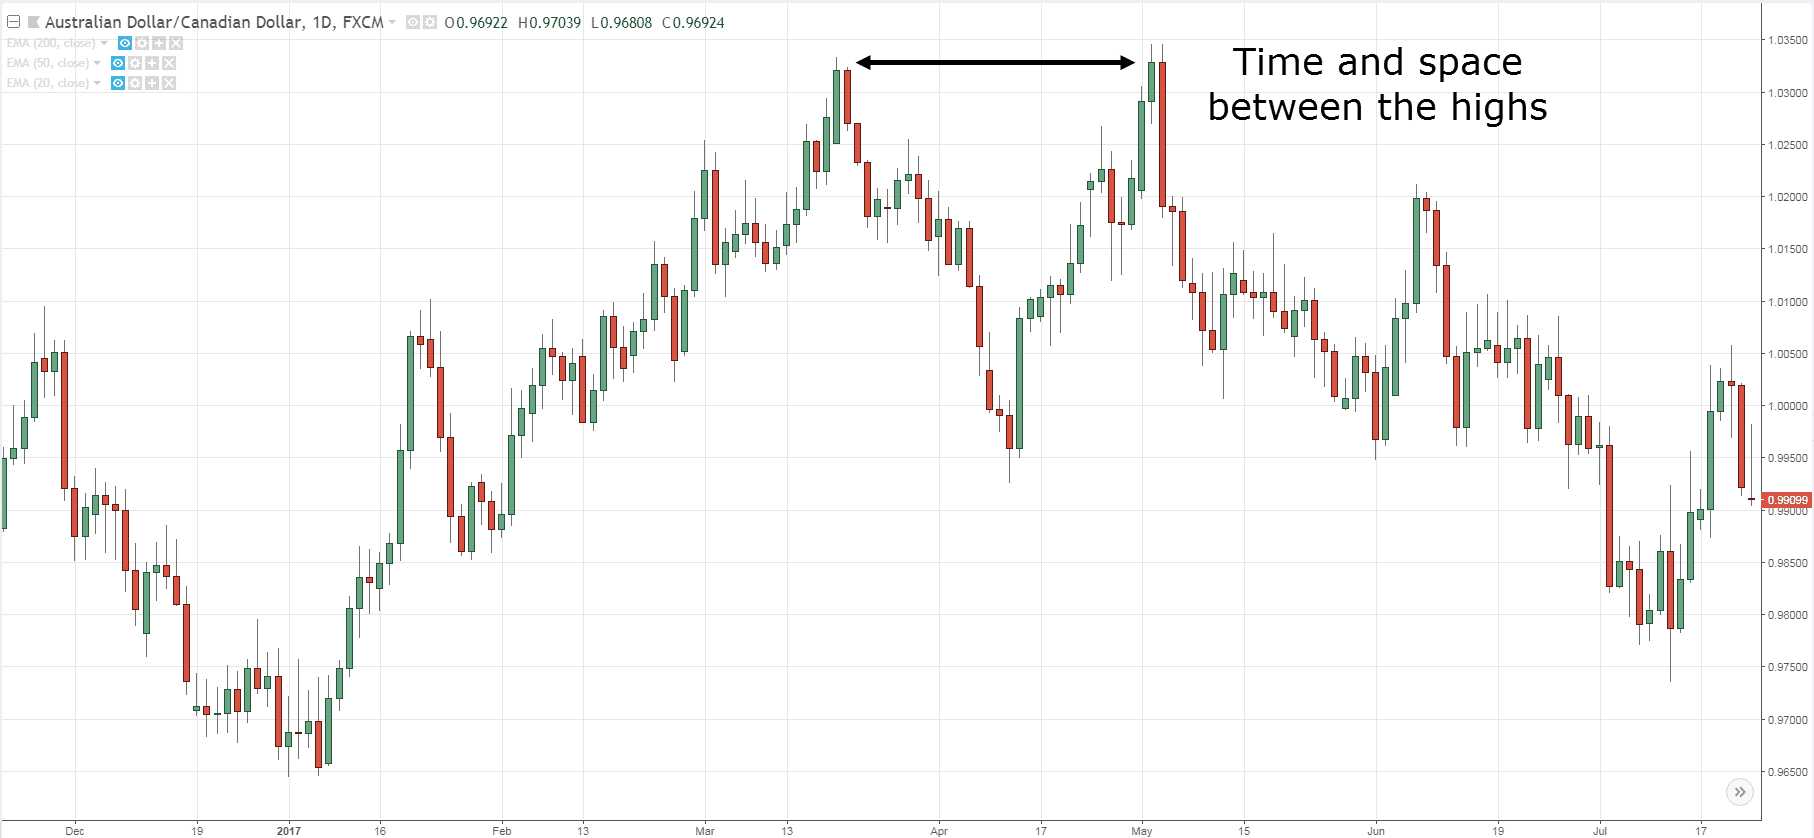
Instead, you want to trade Double Top when the time and space is far apart between the first and second peak.
Here’s what I mean:
Now you’re probably wondering:
“Why do you want time and space to be far apart?”
Here’s why…
When there are more time and space between the first and second peak, the swing levels becomes more significant as traders become aware of the price level.
And when a level receives more attention, it attracts more order flow (as more traders will trade around that area).
So, when a major group of traders gets it WRONG, it presents an opportunity you can take advantage of.
Here’s how…
A Double Top trading strategy that takes advantage of “trapped” traders
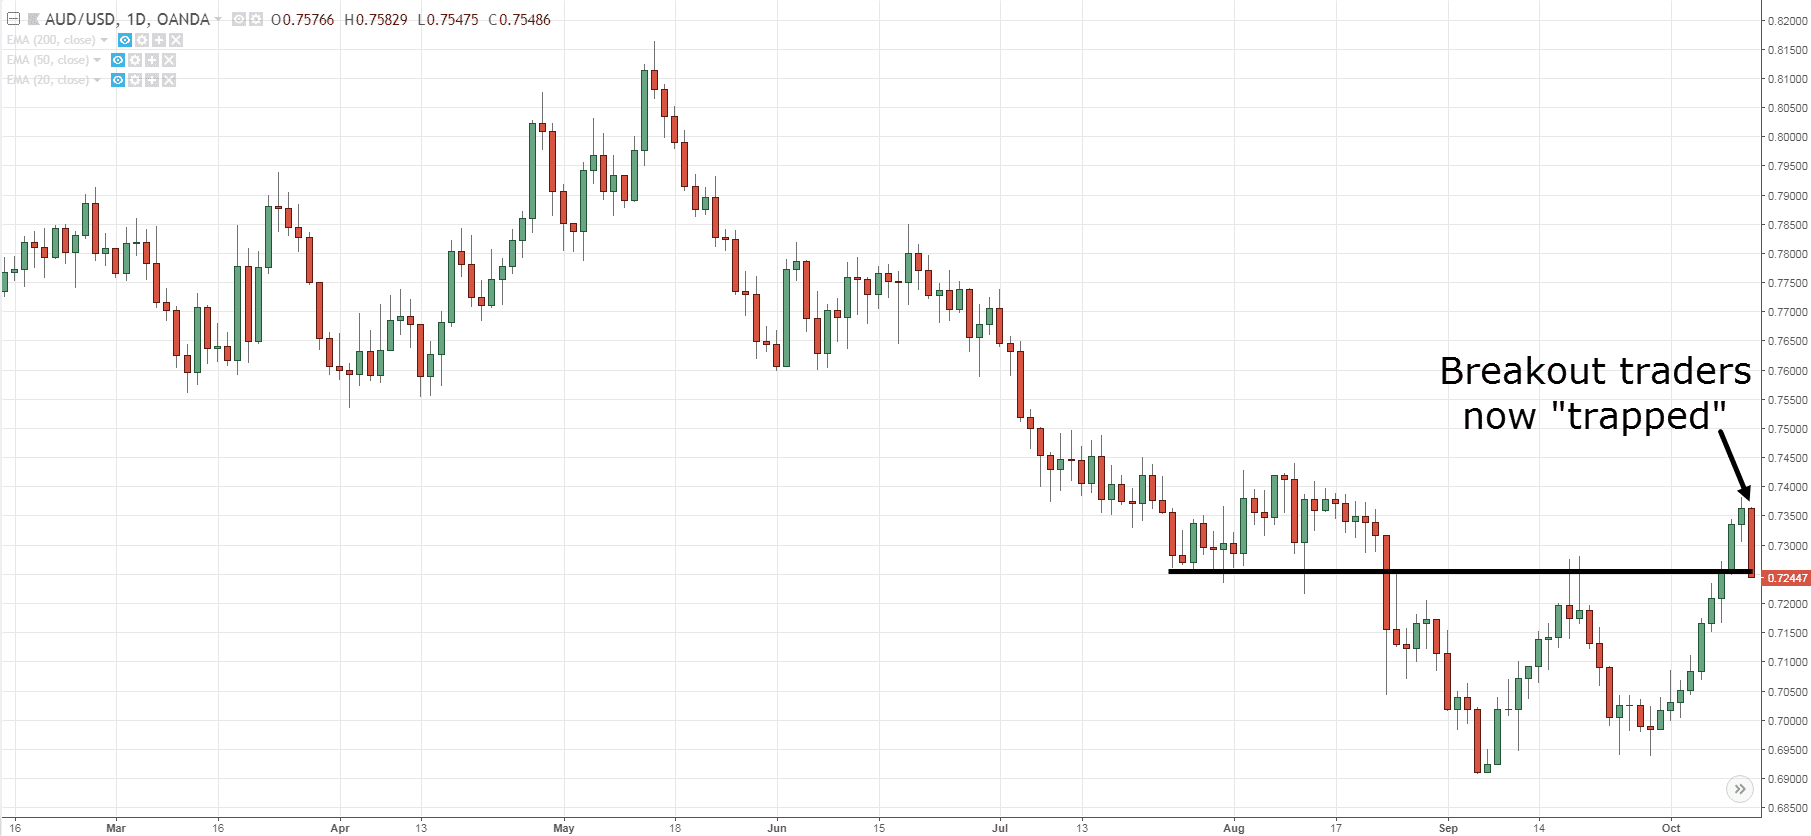
Look at the chart below:
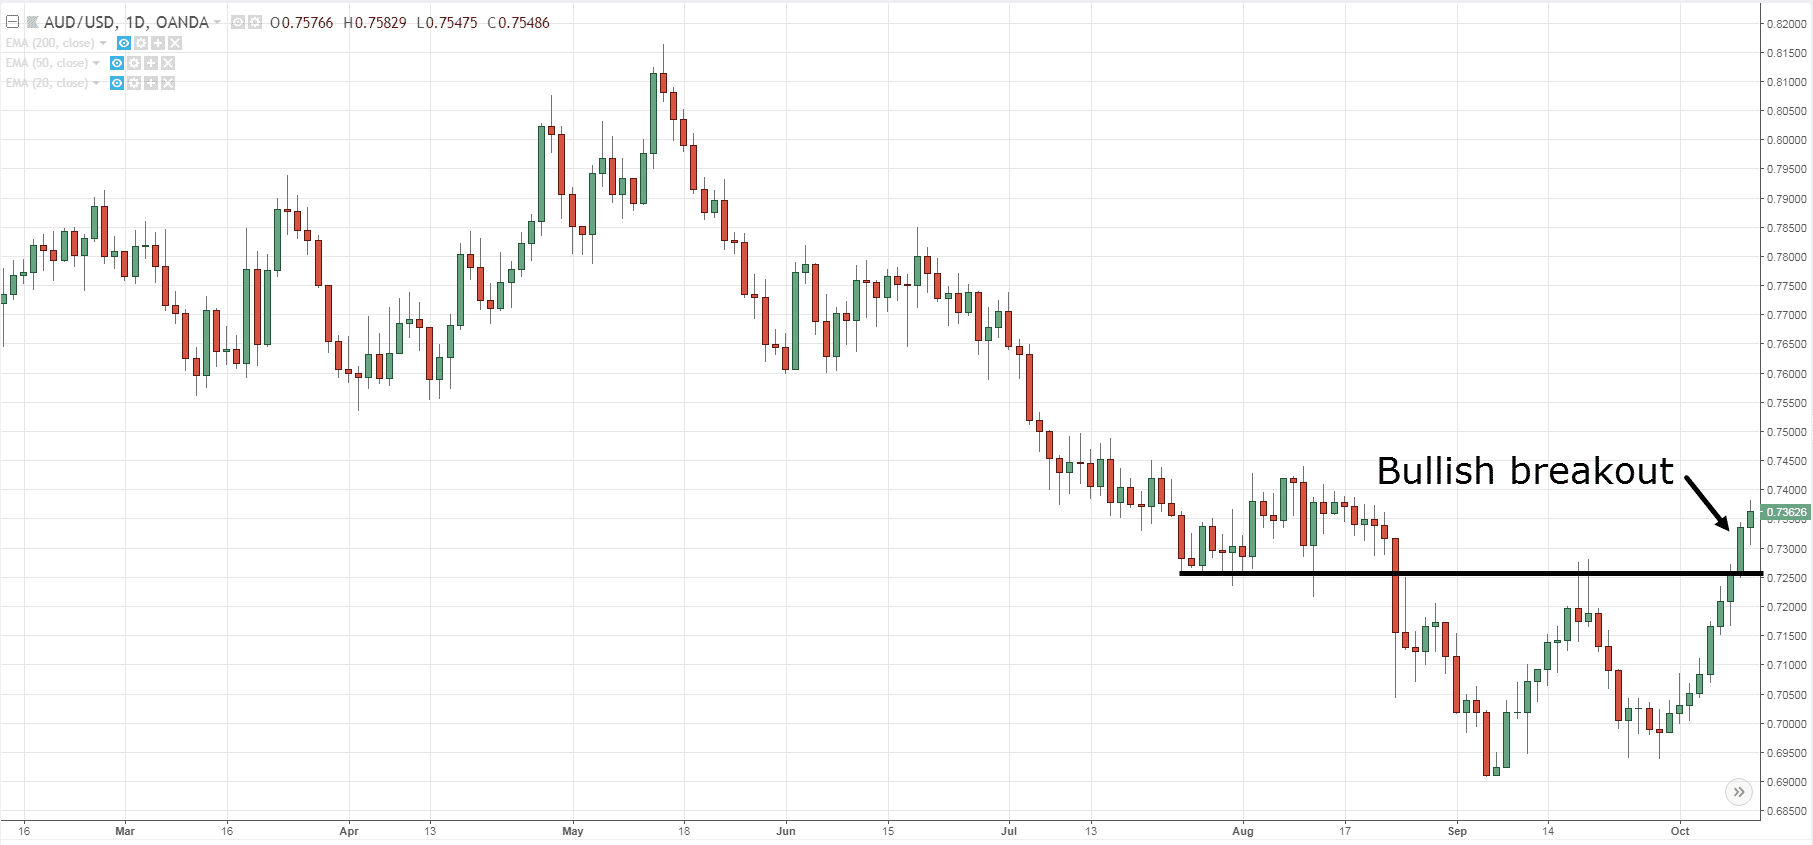
At this point, many traders will look to long the breakout.
Just look at how BULLISH the candle is!
And here’s what happens next…
Ouch.
Traders who got long the breakout are now “trapped” as the market did a sudden reversal.
Now when this happens, it presents a trading opportunity for you to take advantage of this group of “trapped” traders.
How?
By going short after the market does a false breakout.
And if the market continues lower, it will trigger the stop losses of breakout traders which fuels further price decline.
An example:
Pro Tip:
When you’re trading this strategy, you’re likely to be trading against the long-term trend.
So, don’t be too aggressive with your target profits.
Instead, you can consider taking profits at the nearest swing low (or neckline).
Double Top Breakout: How to find insanely profitable risk to reward trading setups
Here’s the thing:
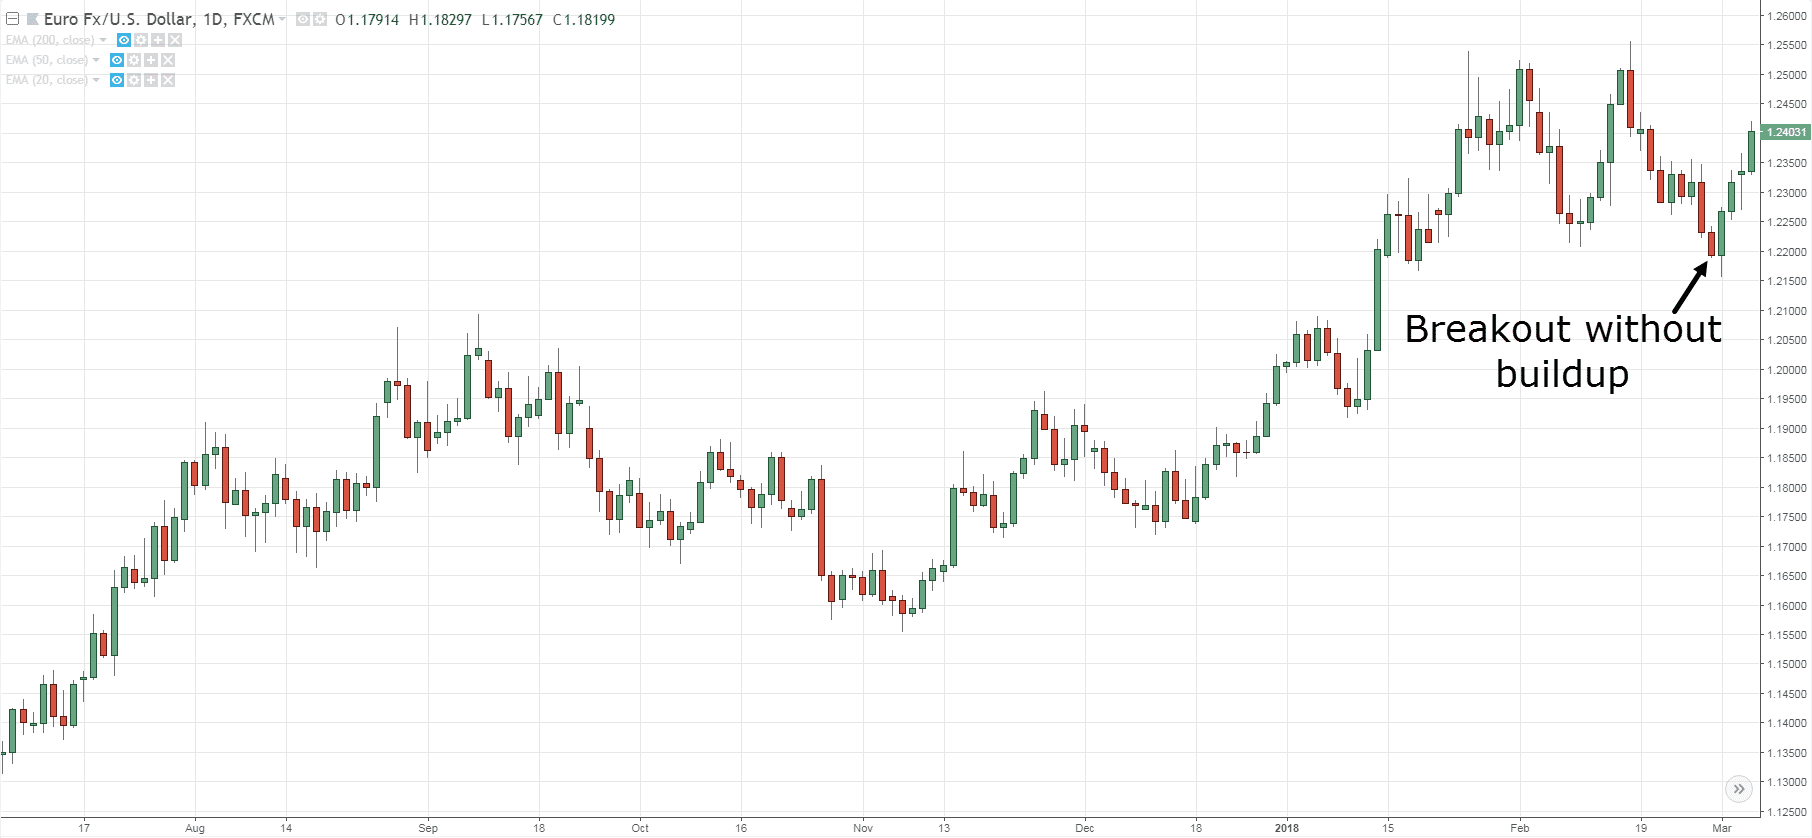
Most trading gurus will tell you to short the Double Top breakout when the price breaks below the neckline and have your stop loss placed above the highs.
An example:
However, there are 2 issues with this:
- After a strong move lower, the market could quickly reverse higher and stop you out of your trade
- Your stop loss is very large and it doesn’t offer a favorable risk to reward on your trade
So, my suggestion is…
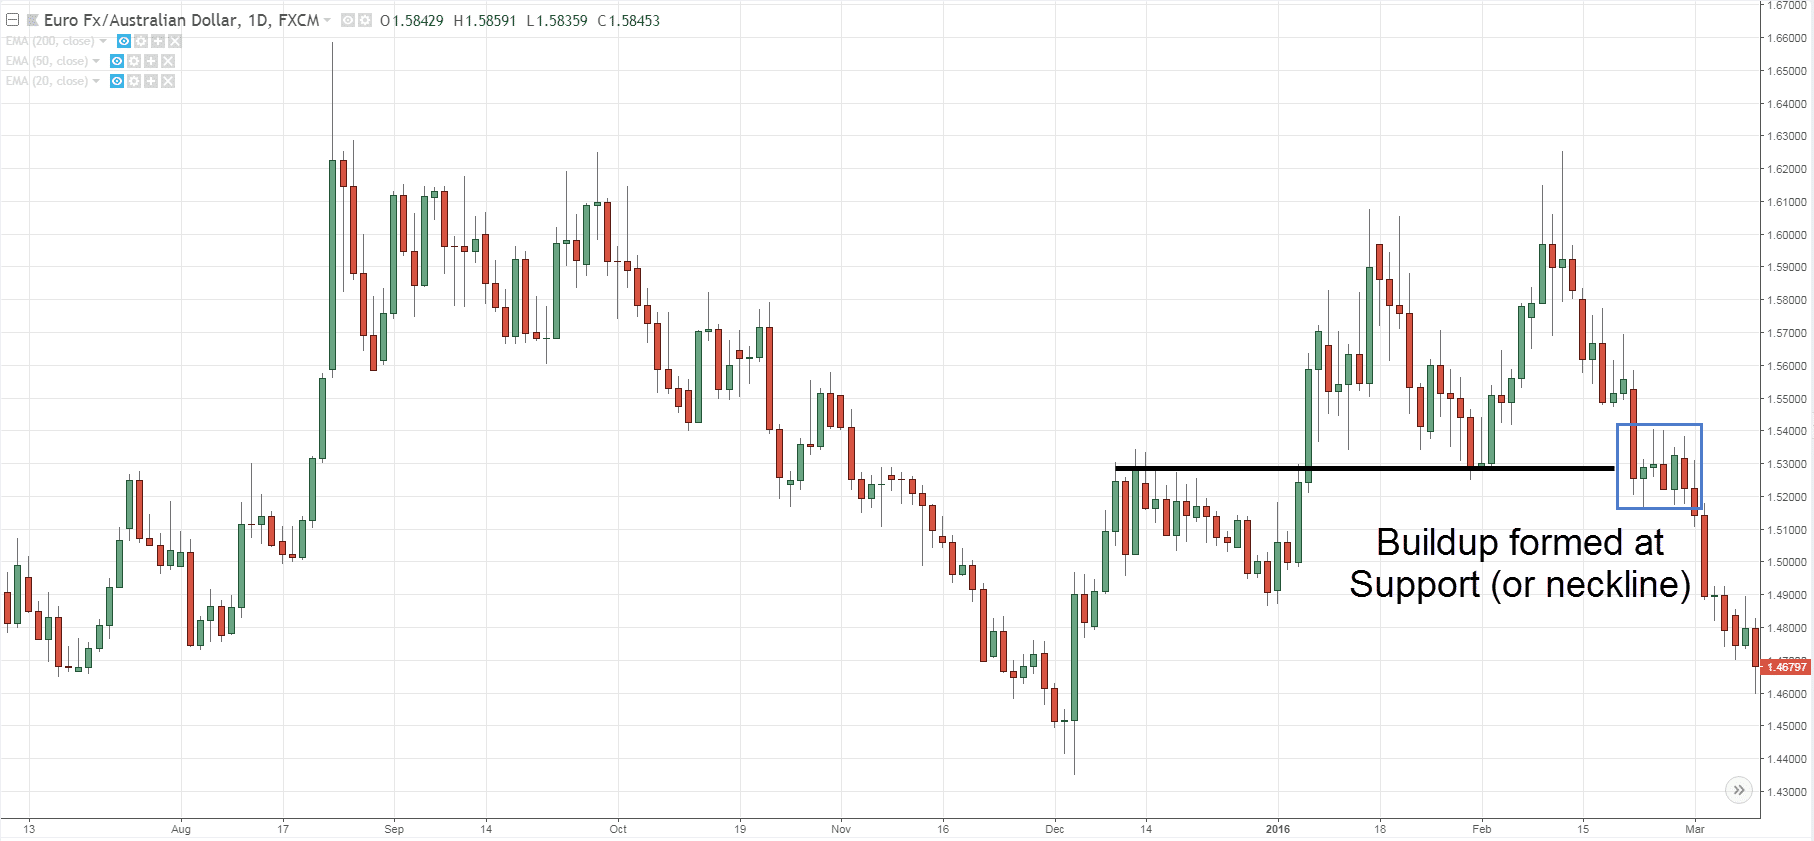
Wait for a buildup to form.
Here’s why:
1. A higher probability of success
Traders who are long near the neckline (or at Support) will cut their losses if the market continues to head lower.
Their stop loss orders add further selling pressure — which increases the probability of success.
2. A more favorable risk to reward
You have a tighter stop loss as you can reference the highs of the buildup to set your stop loss. This improves your risk to reward on your trade.
So here’s how a buildup looks like…
Pro Tip:
You have no idea how far a breakout can go.
So, if you want to take advantage of the move, consider trailing your stop loss and ride the momentum for all it’s worth.
Moving on…
In the next section, you’ll learn how to use the Double Top chart pattern and pinpoint market reversals with deadly accuracy.
How to use the Double Top chart pattern and pinpoint market reversals with deadly accuracy
Now…
The Double Top is considered as a trend-reversal pattern.
However, that’s not to say you can’t use it to pinpoint market reversals with deadly accuracy.
Want to know the SECRET?
It’s this…
Here’s how it works…
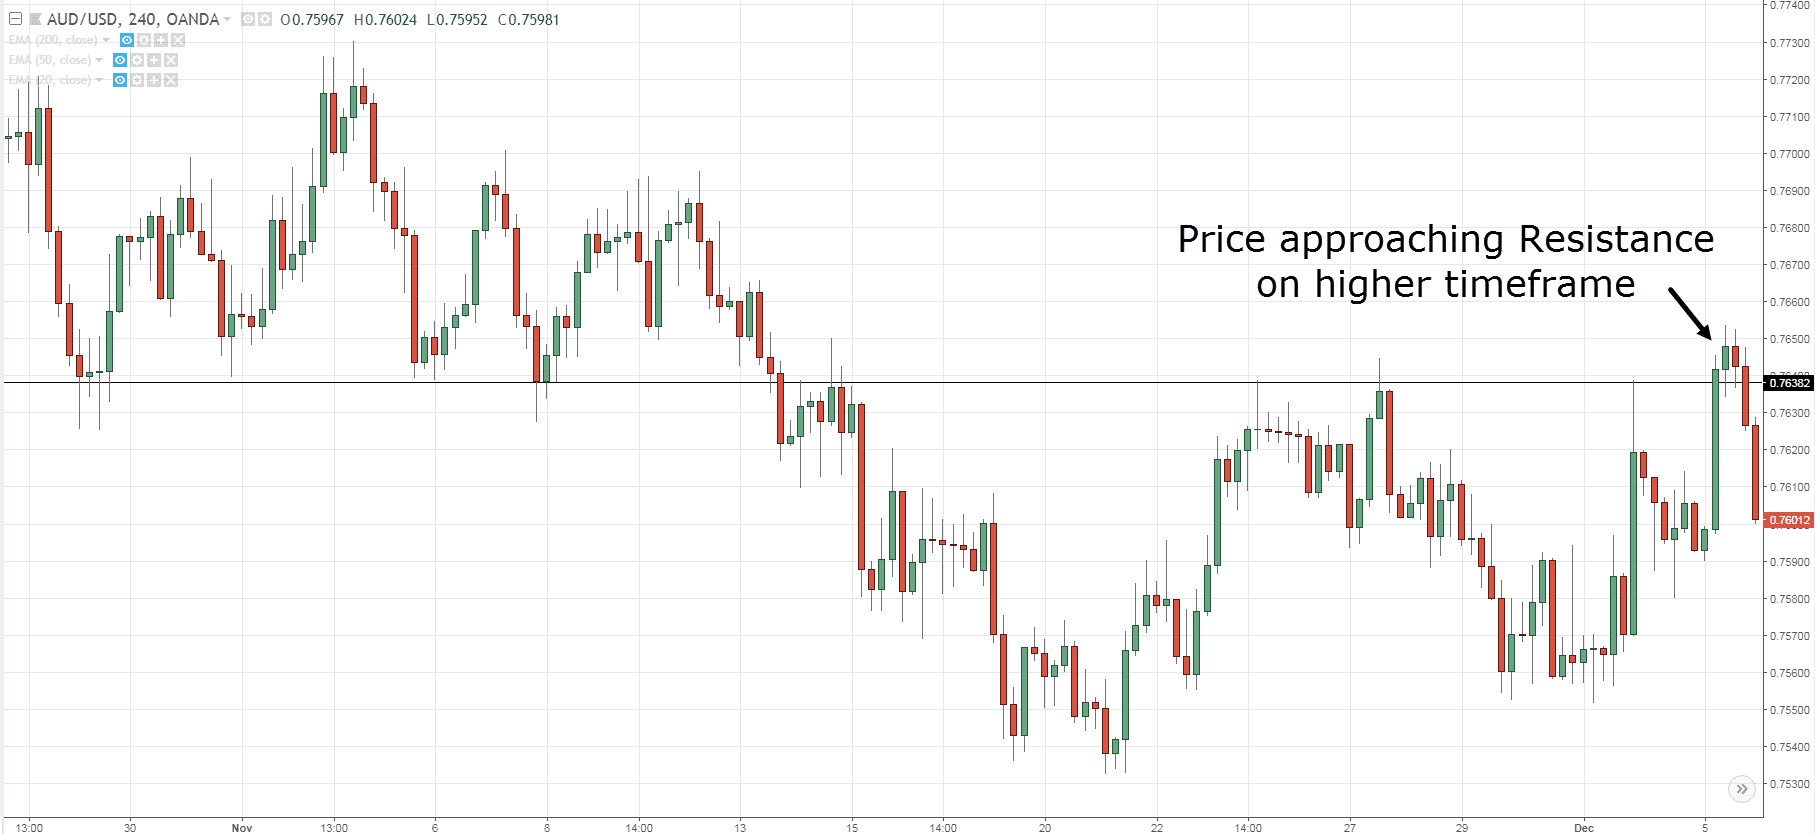
- Identify a market in a downtrend (on a higher timeframe)
- Let the price approach an area of Resistance (on the higher timeframe)
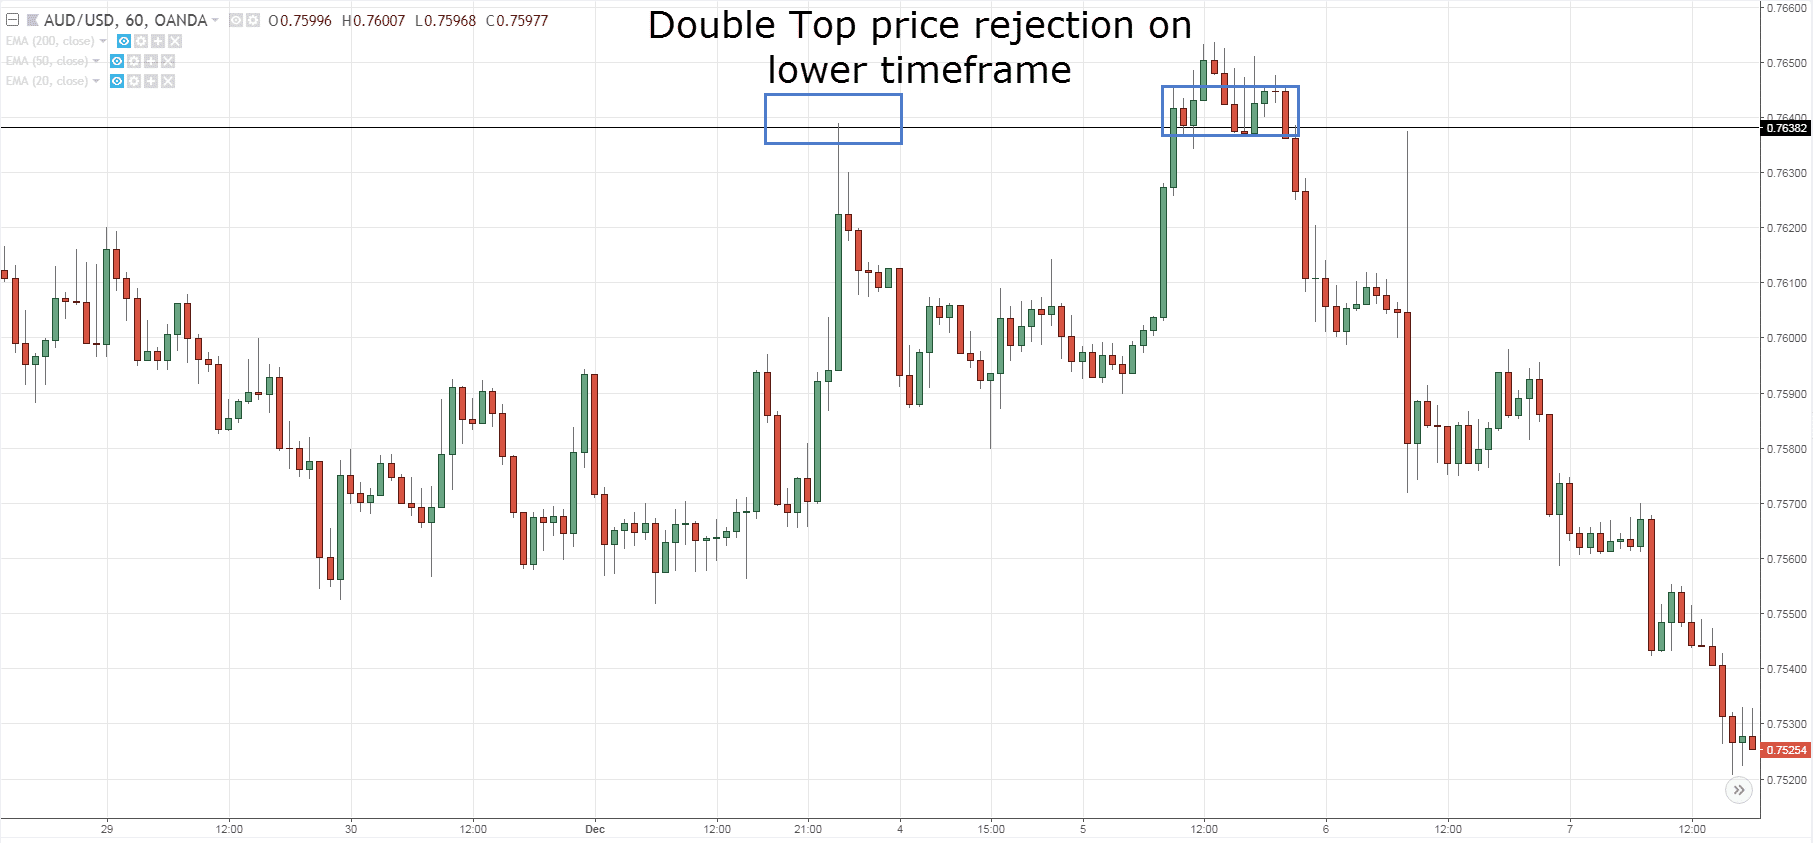
- Look for a Double Top pattern (on the lower timeframe)
Now you’d be surprised how this simple technique allows you to time your entries at the absolute highs (and it appears you’re trading against the trend when you’re not).
Here’s an example: Price approaching Resistance on AUD/USD (4-hour timeframe):
A Double Top formed on AUD/USD (1-hour timeframe):
This is amazing stuff, right?
And combined with the false breakout and buildup techniques you’ve learned earlier, you can enter a trend at its infancy stage — way before the herd catches on.
Frequently asked questions
#1: How do you know when a breakdown is going to be false so that you can avoid becoming one of the “trapped” traders?
Firstly, if you see a strong power move into the neckline (which is support or the swing low) followed by a bullish price rejection, then there’s a good chance that the market might reverse from there.
Secondly, if the higher timeframe (let’s say the Daily) is in an uptrend, then chances are, for that timeframe you’re on (4-Hour), the double top pattern will fail and the price will continue higher since the higher timeframe is in an uptrend.
#2: Can the double top chart pattern be played as a trend continuation pattern?
Yes definitely. Especially if it’s in the same direction as the higher timeframe trend.
#3: Is it helpful to use the RSI or MACD divergence to complement the double top chart pattern?
I’ve not found those useful to complement the double top chart pattern.
Conclusion
So here’s what you’ve learned today:
- Double Top chart pattern signals a possible trend reversal as the market is unable to move higher
- Don’t short a Double Top chart pattern against a strong uptrend because the market is likely to continue higher
- Pay attention to the time and space between the 2 peaks to filter for higher probability trading setups
- The false breakout and buildup are entry techniques to trade the Double Top chart pattern
- You can combine multiple timeframes and Double Top to pinpoint market reversals with precision
Now here’s my question for you…
How do you trade the Double Top chart pattern?
Leave a comment below and share your thoughts with me.


Thanks for the tip bro, very helpful to newbies like me 😉
You’re welcome!
You are always on point
Thank you.
You the best I make sure to follow all ur vids. I’m new and I’m getting better because of you
Can we chat one on one please
Hi, Jude!
If you have any questions or concerns, feel free to email at support@tradingwithrayner.com
Cheers!
I have never traded a double top. After going over the reading, and video now I feel more confident to trade them. This is something I can add to my price action toolbox of trading.
Thank You
Rayner
The pleasure is mine, William.
But the question for a long trader like me is how do you know when a breakout is false and avoid it? This is because textbook tells you to go long on breakout but that is not always the case as it can be a false breakout instead.
Best Regards 🙂
Would identifying a double bottom be the same as identifying a double top?
Thanks.
A Double Bottom is just the inverse of a Double Top.
You never know whether a breakout is false or not that’s why you have a stop loss in place.
Hi Rayner thank you for this Topic,I didn’t know nothing about the double top but now I’m aware of it.this is very good and I’m going to use this Double Top strategy.
Thanks
Cheers
AWESOME….thanks for giving such guidance …….
My pleasure.
Very nice, thanks for sharing true practical guidelines.
You’re welcome!
hi,
great my grue GOD bless you
cheers
Hello Rayner…
I really appreciate the subtleties that you bring in your analysis…like here…using double top pattern while scrip is in a downtrend…hence ensuring that we still trade with the trend…
One request…Though technical analysis applies across markets.. However since most of your examples are for forex…but…in stock market…volume plays very important role (which is not so relevant in forex market). Hence can you provide us some view on trading stocks as well to bring out how to manage the delta changes that are applicable only to stock markets.
I’ll look into it…
Thank you illustrious, as always a great explanation, I have always been afraid to trade this pattern, but with this explanation I remain super clear, Thanks again
Awesome to hear that!
Please Can The Double Top Or Double Bottom Be Played As A Continuation Pattern ?
Maybe When A Double Top Appear In A Downtrend Or A Double Bottom Appear In An Uptrend.
Am Asking Because I Have Seen That Severally On MY Charts.
I Await Your Reply
Well, you can if it’s traded in the direction of the trend.
Great explanation in giving the option to trade DT/DB with higher probability and lower risk
Thank you, Hank!
Hey hey my friend I just learned it from you so I spotted double top on a down trend/EURJPY before the market closes on Friday and place sell orders so I will see when it opens. And thanks for the lesson
You’re welcome, Dou!
Thank you sir
My pleasure!
I really have not traded double top before and everytime I see it I always managened to get trapped. Thank you so much Rayner I’m really enjoying learning all these secrets. Just a quick question on the pro T premium do you help out with advice on which market to trade if stating off as a part time trader or does all the strategies work on all the market?
You’re welcome, Tebogo.
I don’t have any advice of which markets to trade, but in the market analysis, I focus on Forex and Futures.
i use divergences to validate double top or bottom and also head and shoulder,, if it does not have divergence, then it does not valid for me
Thanks for sharing, Amiram!
Thank you, RT
Tips are very rich and of course very helpful too.
Appreciate your time. I just started following about a week ago and i have learnt so much value within this one week, big thanks to you bro.
Awesome to hear that!
Hi Rayner please help with a Fundamental news trading strategy,and thank you very much for the powerful stuff you have shared with us.
This is very informative. Thank you.
[…] Tip: This is known as a Double Top chart pattern (and the inverse is Double […]
Please am a beginner. How many numbers of trade do you recommend daily?
If you are a beginner, you might want to consider having 1-2 trades per day so you can manage your risk and for you to not overtrade.
Hope this helps!