#1: How to Trade Breakouts Like a Pro
Lesson 1
Hey hey, what's up my friends!
In today's video, we're going to be talking all about breakouts!
Breakout is my favorite type of entry when trading the markets.
And it's for two reasons!
Number one...
When you're trading breakout, it is very easy to know when you're wrong.
For example, if price breaks out of the range and then it goes back into the range...
You know it's a false breakout, and you can just easily cut the trade.
And the second reason is that you know when you're trading breakouts, you're trading momentum at a back of your trade.
Sometimes, the breakout can just go in your favor and with little to no retracement, and all you need to do is to just have a trailing stop loss.
And who knows?
You could catch a big trend.
So, these are the two reasons why I love trading breakouts.
And now I get quite a bit of feedback from traders where they say, “Rayner, whenever I trade breakouts, I tend to be getting a lot of false breakouts. Is there a way to avoid it?”
And if you think about this…
If you want to avoid false breakouts totally, it's like saying, “Is there a way to trade the markets with zero losses?”
No, right?
When trading, losses are just the cost of doing business, and it's the same for breakouts!
When you're trading breakouts, false breakout is something that you have to deal with...
But that's it, right?
In today's video, I want to share with you practical trading tips on when is the worst time to be trading breakouts, and when is the best time to be trading breakouts.
Let’s get started…
What is a breakout
First off, let's talk about basics, what is a breakout?
A breakout is, for me, classified in two ways:
- Breakout of swing high or swing low.
- A breakout of support or resistance.
Let me explain…
Breakout of a swing high or swing low
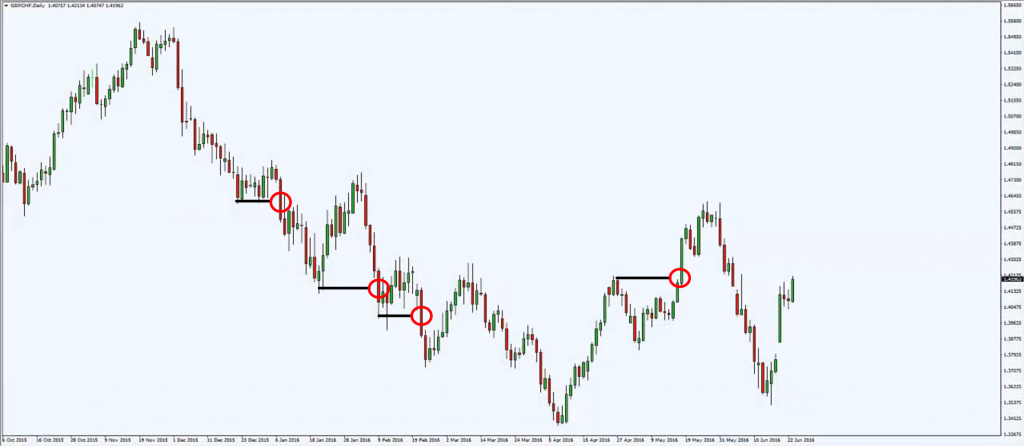
It looks something like this:
The swing low is like a mini version of support and resistance.
They are not as significant, but it's pretty obvious on the charts when you identify a swing high or lows in a market!
Trading breakouts, you can either trade the break of the swing high or swing lows.
Or you can trade the break of support or resistance...
Breakout of support and resistance
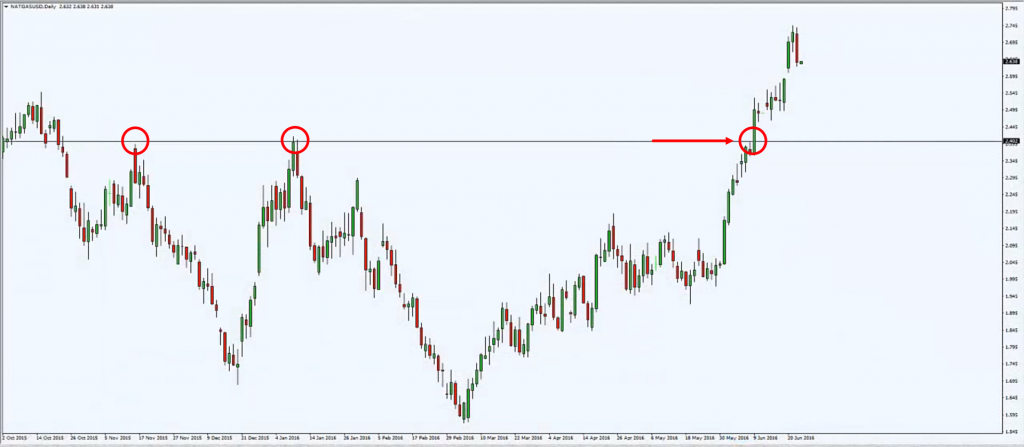
It looks something more like this:
Resistance in a market is an area where there will be potential sellers coming in!
In the example given, you can see an area of resistance.
Price tested twice in an area of resistance and then price break and closed above it.
This is a breakout of resistance, a slightly different from a breakout of a swing high.
Because a resistance is a much more respectable area.
And is obvious on your charts when you have identified key areas of support and resistance.
There are two ways to go about it: a breakout of a swing high, swing low, or the breakout of support and resistance.
Moving on…
What to avoid
Let's talk about when you should avoid trading breakouts:
- You don't want to be trading breakout against the trend
- You don't want to be trading breakout when the market is far from the structure.
Let me explain…
Trading against the trend
Trading against the trend is, I'll say, quite illogical, and that you don't want to do this.
You've heard the saying, 'a trend is your friend until it bends.'
So, let's see why trading with the trend puts you in a much more favorable position:
Because think about this...
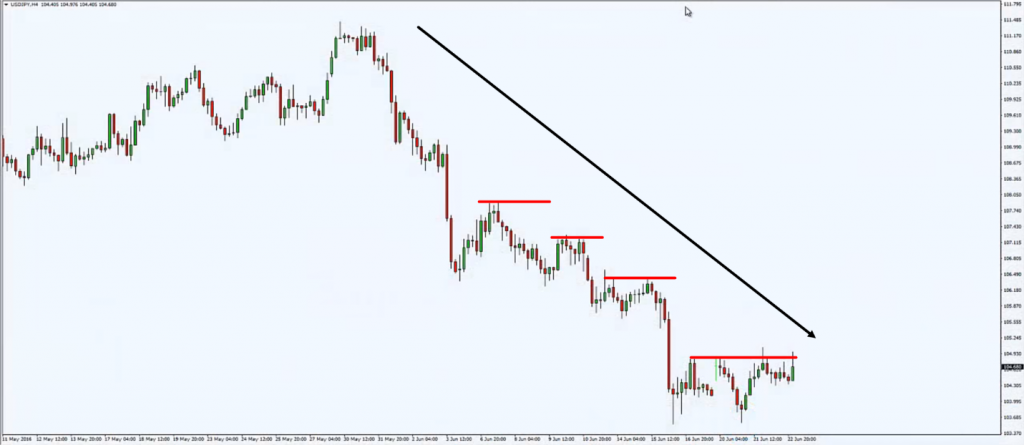
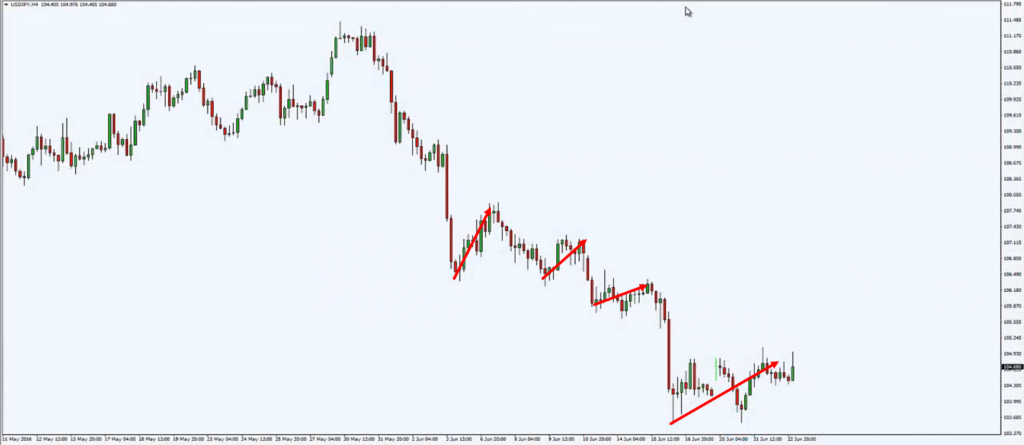
You notice that there is a downtrend right here, and you see a series of lower highs (Red arrow).
So, when you are trading the trend this means that you are preferably looking to get short.
And if you are looking to get short...
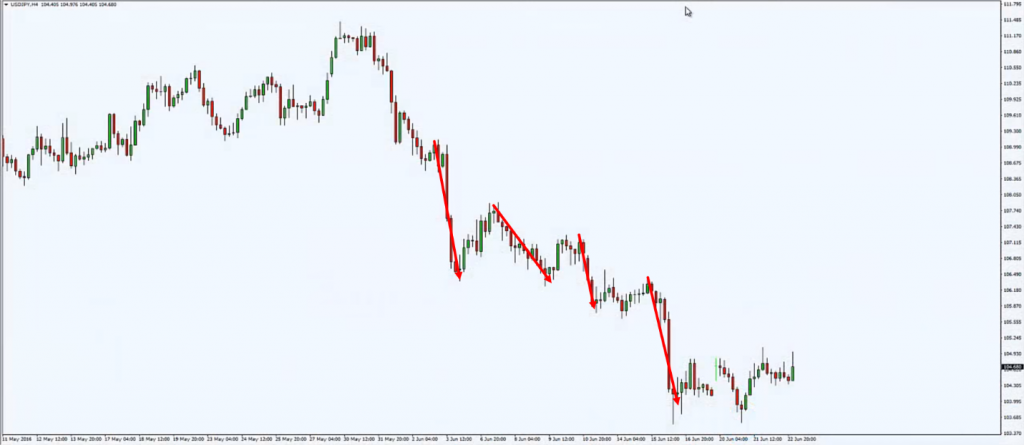
You can see that a move towards the downside is much more sustained!
Look at these downside movements here:
They are pretty much stronger and lasts longer!
Whereas compared to someone wants to trade against the trend, where they're looking to get long.
Look at the bull traders who are going long in this market.
Look at the up moves that resulted from trading against the trend:
So, these are the up moves, very sharp, very limited.
You can see that the strength by the Bulls is very weak compared to the Bears.
If you are looking to trade against the trend, then you can see that there is really not much so-called 'meat' in the move.
Your gains are pretty much limited because you're trading against the trend!
Likewise, if you want to trade breakouts, I would strongly discourage or strongly advise you not to trade against the trend.
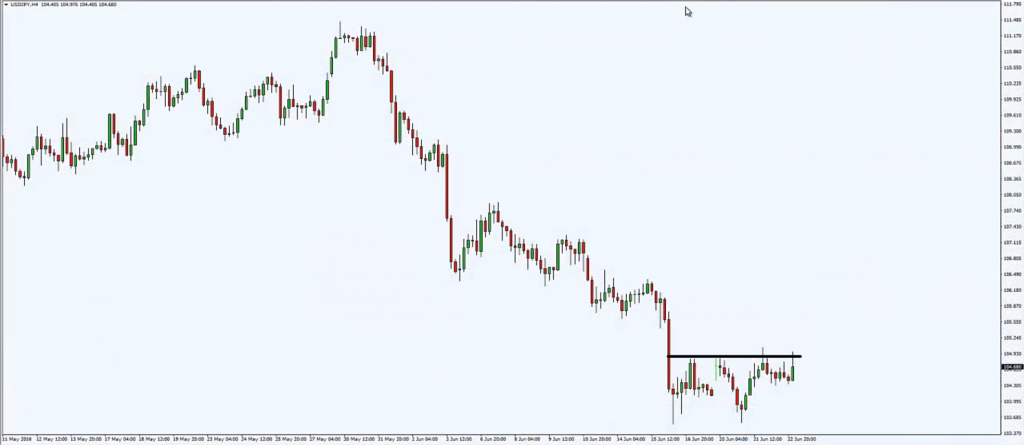
Because, for example, you see over here there is an area of resistance:
And let's say you're looking to trade the breakout higher...
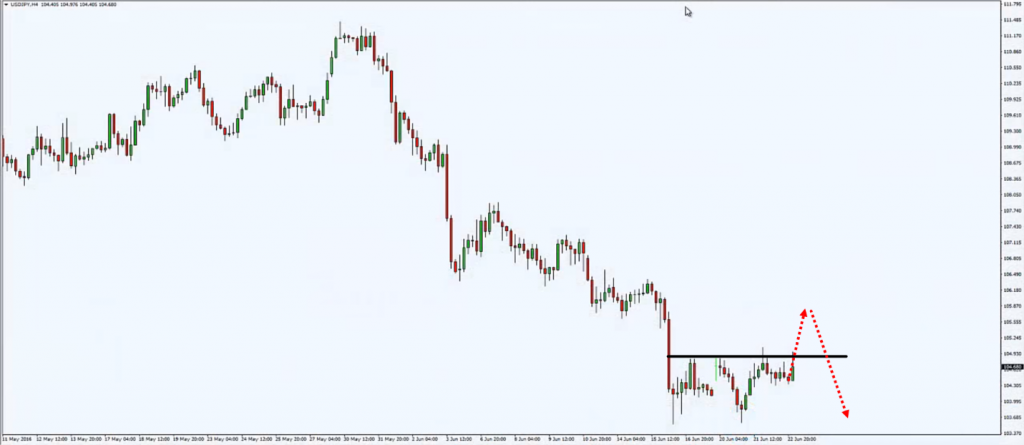
I would say chances are this breakout isn't really going to go very far!
Because, after all, you're trading against the trend.
What is likely to happen is that even if it does a breakout, It would trade higher before it collapses lower, giving you a false breakout over here:
So, beware of trading against the trend whether you're trading breakouts, pull back or whatever entry techniques you will use.
This usually isn't really the best ideal situation to be trading.
Okay?
Next…
Far from structure
What does it mean?
Look at this example:
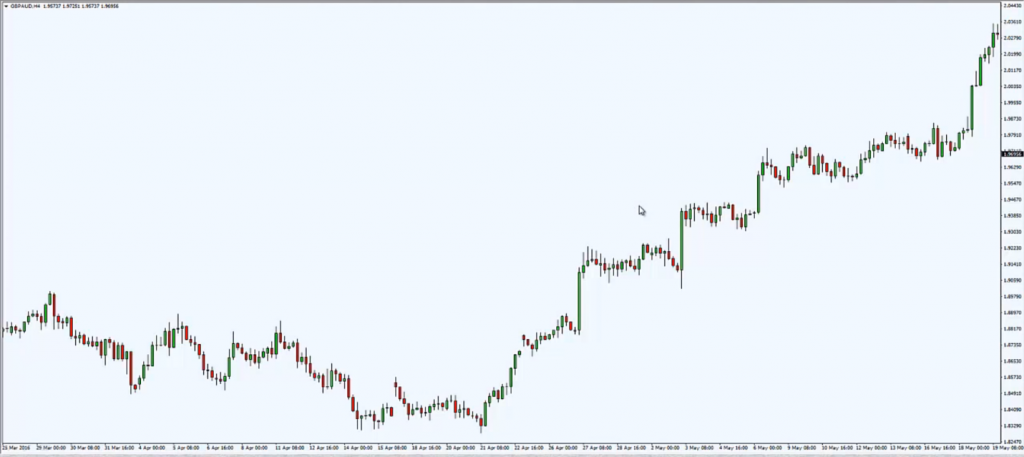
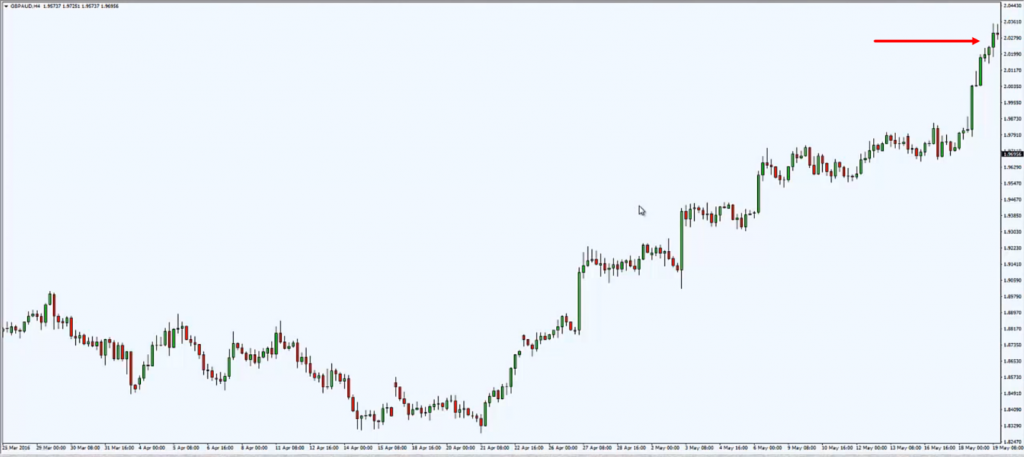
This chart is the GBP/AUD 4-hour time frame.
But bear in mind, whatever market you're looking at, whatever time frame, the principles are essentially the same.
Whether it's a 4-hour, a daily, the weekly, the hourly, they are the same.
Just apply and learn the principles and don't really care too much what markets or time frame this is.
But nonetheless, this market, we have a very nice uptrend.
At this point in time, you see the price has traded at this point, it is so high.
And traders look at this chart and they say, “Oh wow! Rayner, look how bullish this is! I better get long before price trades higher without me!"
So, you got long at the high over here:
But what’s the problem with going long at this high based on the example.
Think about this...
The thing is, where are you going to put your stop loss?
Or should I say, where is the logical place for you to put your stop loss?
Well, you're not going to put anywhere here:
Because there is no structure to lean against.
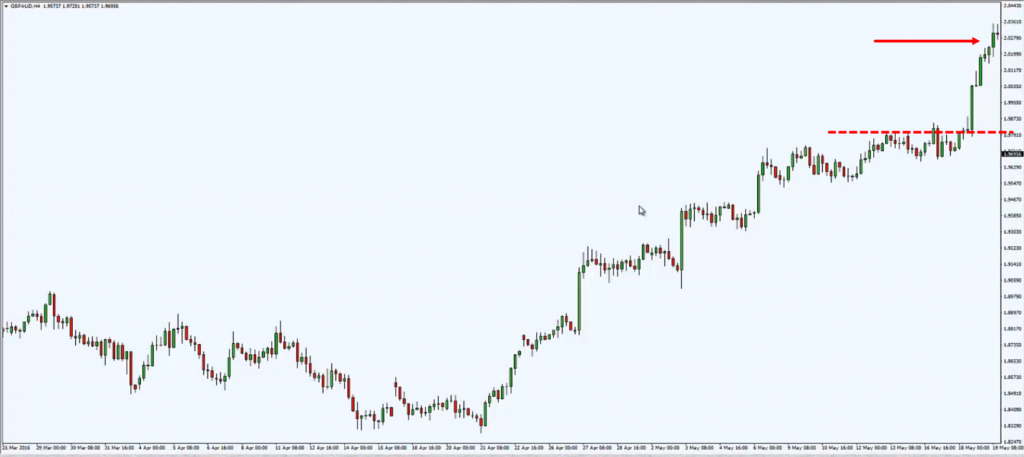
The nearest structure that comes is this high over here:
Previous resistance with a possibility of becoming support.
This level is the one that you need to lean against to place your stop loss.
And of course, you don't want to be putting exactly at this level as well because the price could just come into this level and bounce higher.
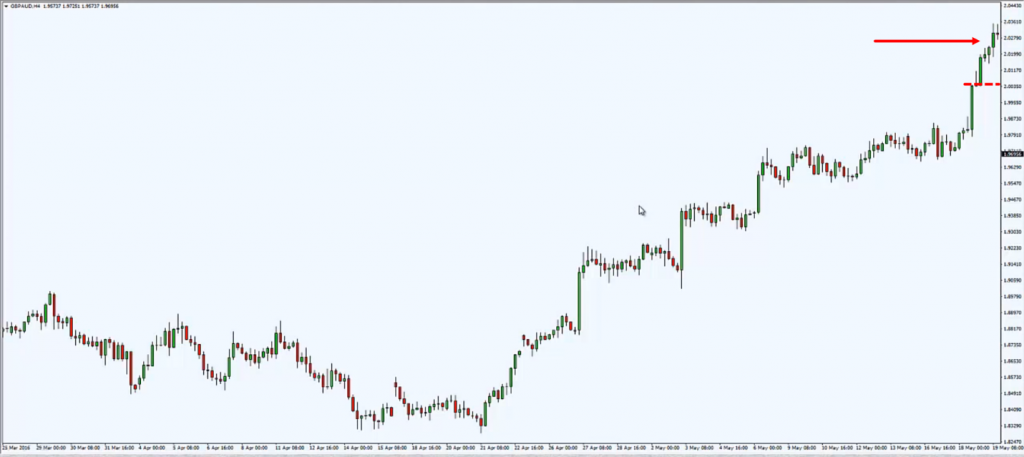
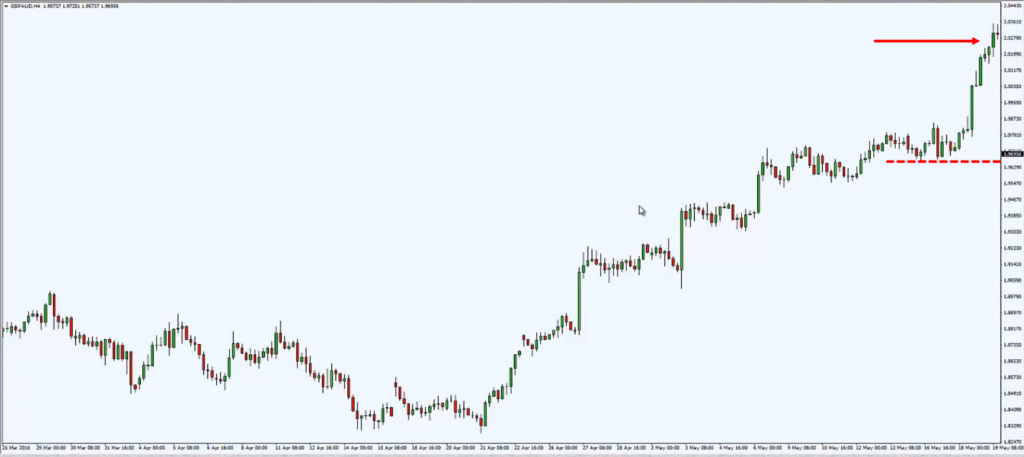
Chances are, you need to put your stop loss somewhere below here:
A rough estimate.
The size of your stop loss is very large!
You compare back to the magnitude of the move previously.
The size of this stop loss is very big compared to this recent move.
When you have a very large stop loss, what happens?
You're going to get a poor risk to reward, right?
Because the price has to move an equal distance in your favor before you attain a 1:1 risk to reward.
As you can see, having a large stop loss gives you a poor risk to reward.
Usually, most of the time or I would say 99% of the time...
I don't really want to deal with guarantees, because there are certain times in the market where traders can be successful doing this kind of trading approach.
But I would discourage you to trade breakouts when it's far away from the structure.
Because of the fact that you need to have a very large stop loss.
And it gives you a very poor risk to reward as a result of it.
Okay?
So...
How do you identify high probability trading breakouts like a pro
These are the three things to bear in mind:
- You want to trade with the trend.
- You want to trade near structure.
- You want to trade breakouts with buildup.
Let me explain…
Trading with the trend
So, trading with the trend is something which you should be familiar by now.
Because earlier I discouraged you from trading against the trend!
And it only makes sense to be trading with the trend!
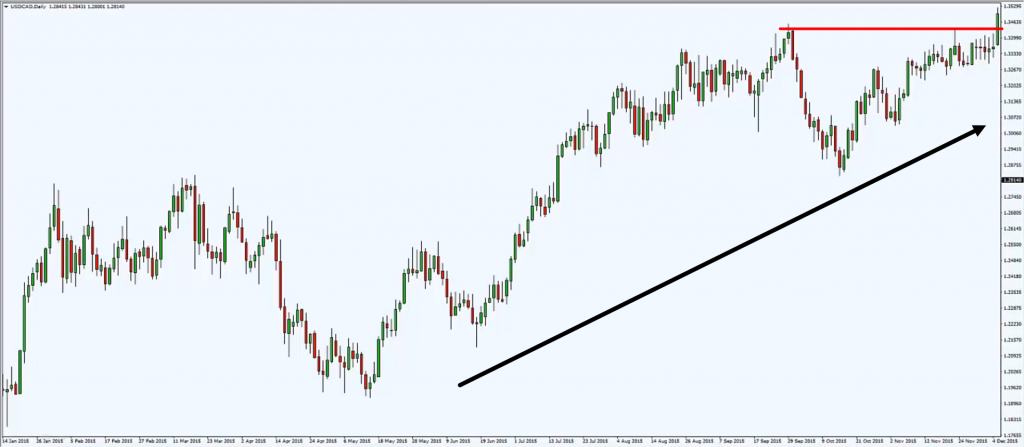
In this example:
You are in an uptrend.
You can see that price has consolidated and broke higher.
At the recent price, a flag pattern is emerging, then you could possibly trade higher from it.
When you have a trend in your favor, trade the breakout in favor of the trend.
You will increase the odds of your trade working out.
Trade near the structure
Earlier, you saw that trading, when the price is very far away from the structure, doesn't really make much of a sense.
Because your stop loss is so large and you get a very poor risk to reward.
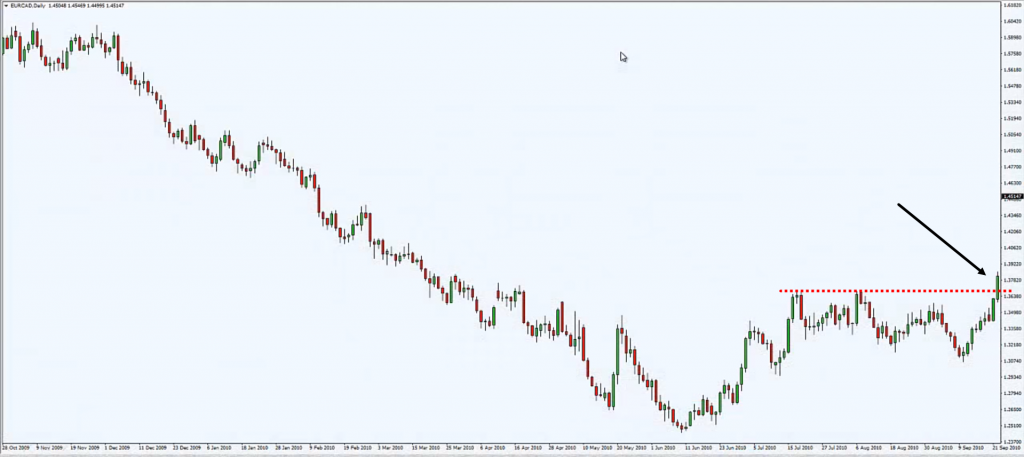
And in this example:
What if you're trading the breakout when it's near structure?
See, this is an area of resistance, and the price has broken above it.
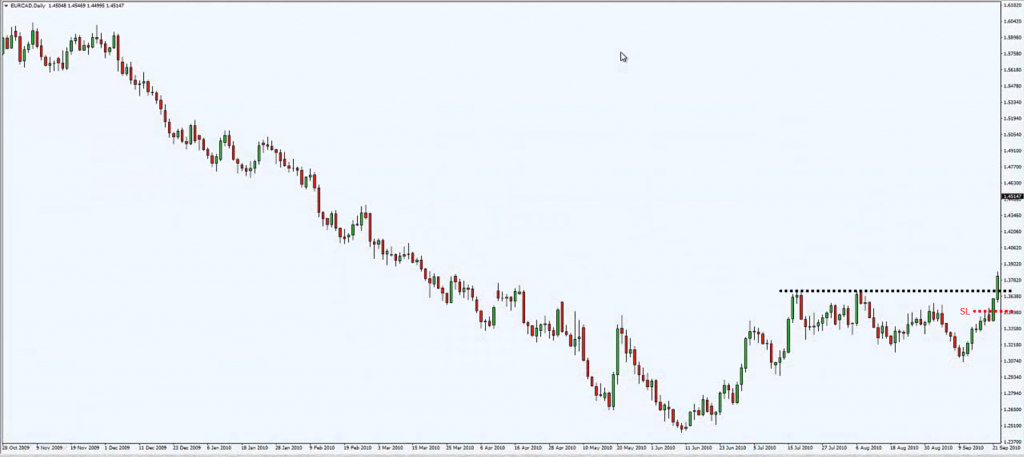
If you are looking to get long right now, where is the logical place to put your stop loss?
Below this previous resistance turns support, right?
You can just put your stop loss somewhere over here:
So, this is a much tighter stop loss to use compared to the earlier example you saw.
With a much tighter stop loss, it gives you a better risk to reward!
Because the price doesn't have to move a lot in your favor before your R multiple starts going in your favor.
When price moves in your favor, you get almost a 1:1 risk to reward, or even slightly more than that.
It gives you a much favorable risk to reward because of the fact that your stop loss is much tighter.
And why do you have a much tighter stop loss?
It's because you are much closer to the structure of the markets.
You can lean against this structure to place a logical stop loss.
Compared to the earlier example, the structure is way too far away and it doesn't really make sense to me to be trading in that scenario.
The last thing you want to pay attention to is…
Trade breakouts with the buildup
This is a question I get a lot from traders, "Rayner, what is buildup?"
Alright, I do apologize if I didn't explain clearly, but this will definitely clear your doubts...
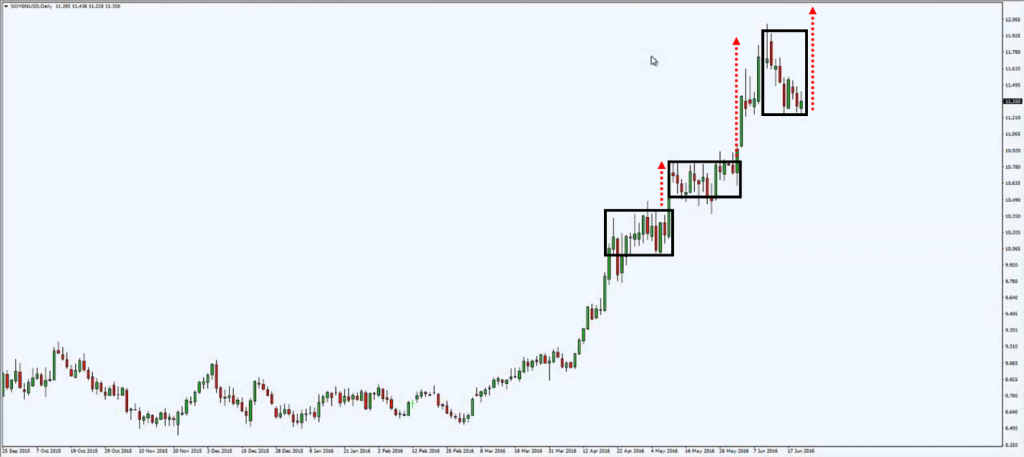
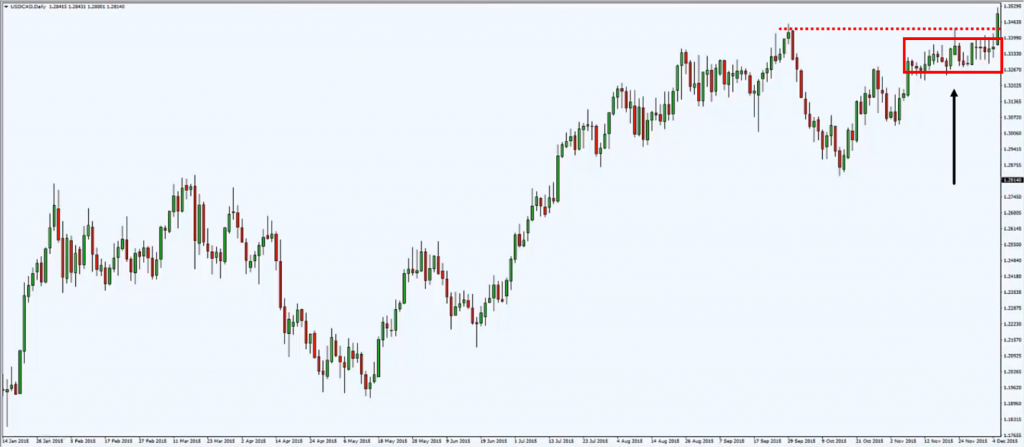
A buildup is basically a congestion, consolidation or a tight range.
You can think of a build up along these lines!
In this example, you see that we have a trend going in our favor, uptrend with an area of resistance:
Then, we have this buildup, a consolidation over here:
A lot of traders will look at this chart and say, "Oh, Rayner, prices consolidating at resistance? I'll look to get short!"
Then, they go short somewhere in the middle of the range and get their stop loss above the high.
That's what they'll do because, at resistance, it makes sense to go short.
But think about this, think deeper...
If the price is consolidating at resistance, what does it tell you?
You know that resistance is an area where there are potential sellers who will come in and push price lower.
But in this example, the price is consolidating at this area of resistance!
Where are the sellers?
Why aren't they pushing price lower?
Why is that?
Think about this, my friend.
The reason why the sellers are not pushing down the prices could be one of two things:
- The sellers are no longer there.
- There are equally strong buyers.
No matter which scenario it is, whether it's number one, there are no sellers, or number two, there are equally strong buyers...
It doesn't look good for traders who are looking to short either way.
And on top of it, the cluster of stops above the high would create an incentive for the smart money to actually breakout higher, so they can rake the stops above the high.
My point is this…
When you see a consolidation at resistance, basically buildup just in front of the area of resistance.
This is a sign of strength.
I repeat, this is a sign of strength.
In this scenario again, I'll be looking to get long when price trades above the highs.
And put my stop loss around 2 ATR.
This is something to look out for.
Look through your charts, look through in price approaching support and resistance area.
Ask yourself what happens if there is a consolidation at support and resistance area.
Does it improve the odds that a breakout will succeed?
Do this research on your own and you'll be amazed at the results that you’ll find.
So, this is the thing to look out for, trade breakouts with buildup and this will really improve the quality of breakout setups that you're taking.
And on top of the earlier two tips I shared with you
Trading with the trend and trading near structure.
Now…
Let's do a recap on what have you learned today.
Recap
- What is a breakout.
- When not to trade breakouts.
- You don't want to trade breakouts when you're trading against a trend, and when it's far away from the structure.
- You want to be trading breakouts when you're trading with the trend when you are trading near structure.
- Trade breakouts with buildup.

