What is a Bullish Engulfing Pattern and how does it work?
The Bullish Engulfing Pattern is a bullish reversal candlestick that forms after a decline in price.
Here’s how to recognize one:
- The first candle has a lower close
- The body of the 2nd candle “covers” the body of the first candle
And here’s what a Bullish Engulfing Pattern means…
- On the first candle, the sellers are in control as they pushed the price lower for the session
- But not long after, the buyers stepped into the market and push the price higher (and overwhelm the previous selling pressure)
One more thing…
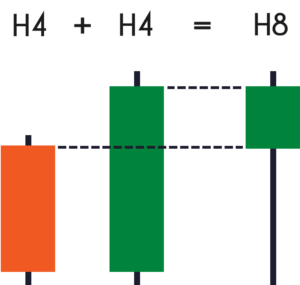
A Bullish Engulfing candlestick and Hammer are essentially the same. It all depends on the timeframe you’re looking at.
For example:
If the 2-hour timeframe forms a Bullish Engulfing Pattern, then the candlestick pattern on the 4-hour timeframe will be a Hammer.
Here’s what I mean…
In essence, a Bullish Engulfing Pattern (or Hammer) tells you the buyers are in control for now.
But whether they are likely to remain in control depends on the context of the market (more on that later).
Next…
Don’t make this common mistake when trading the Bullish Engulfing Pattern…
“Look. It’s a Bullish Engulfing Pattern. This is a sign of strength, let’s buy!”
Next thing you know, the market reverses and you get stopped out for a loss.
Why?
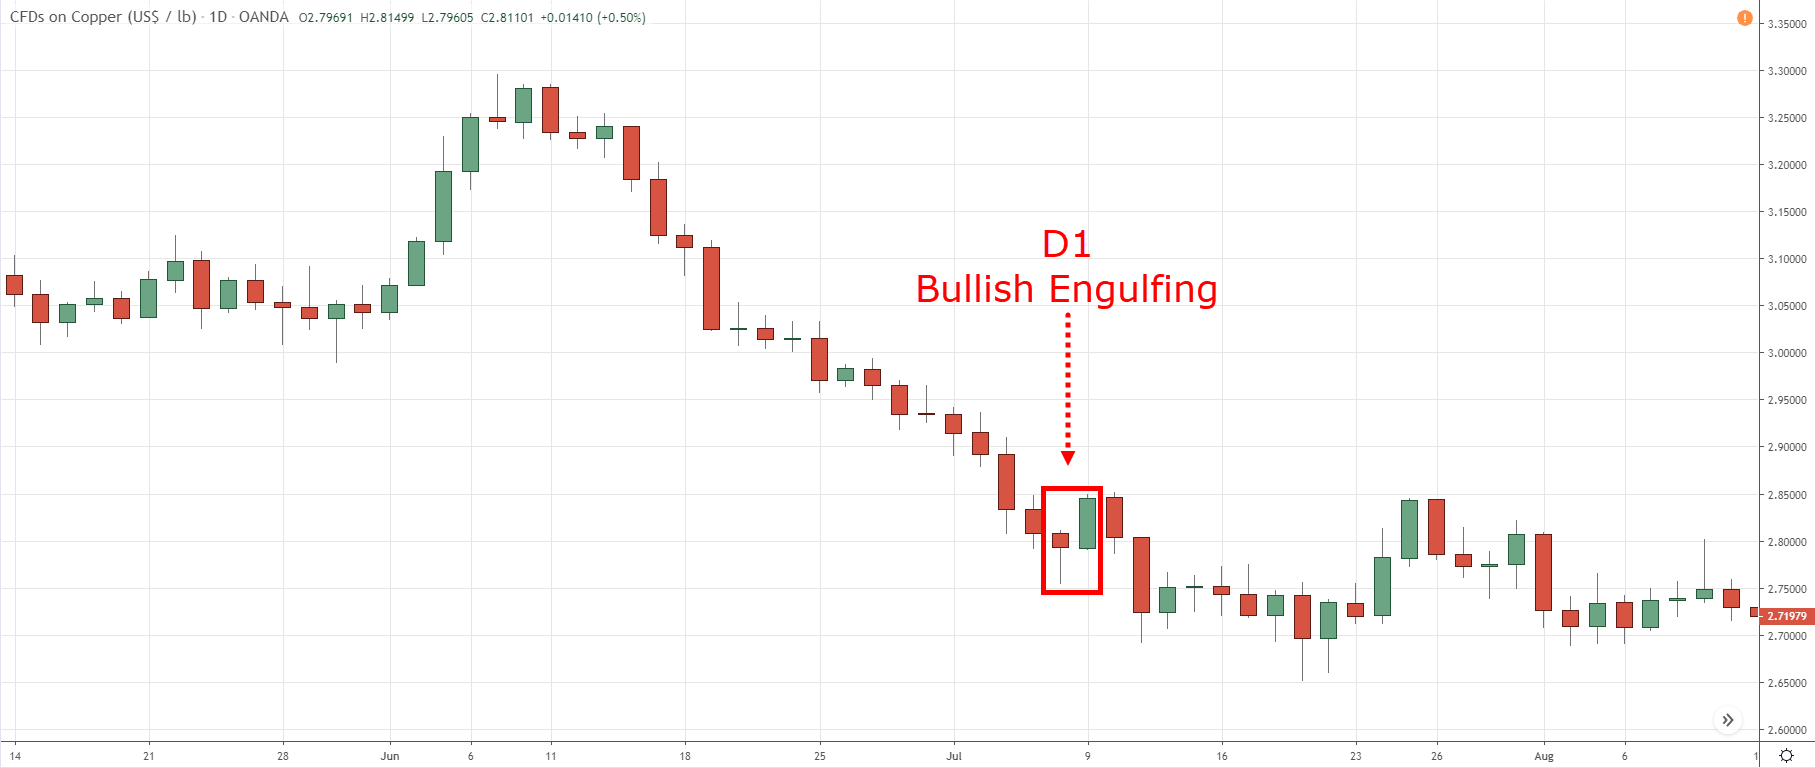
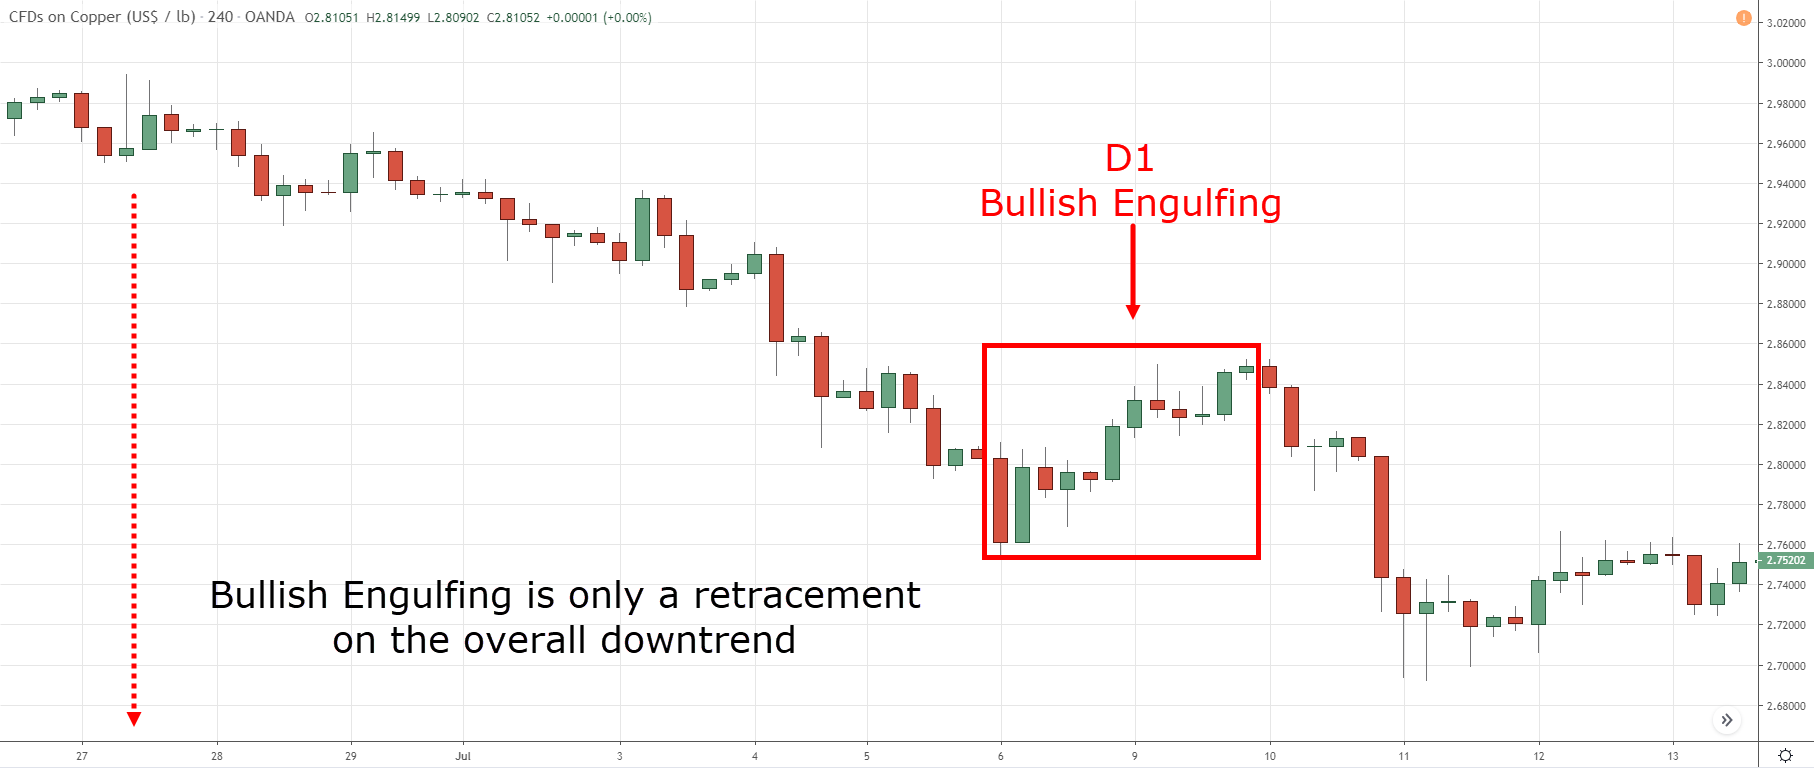
Because the truth is, a Bullish Engulfing Pattern is usually a retracement in a downtrend.
Let me give you an example…
Bullish Engulfing Pattern on the Daily timeframe:
On the lower timeframe, it’s a retracement against the trend…
See my point?
So yes, a Bullish Engulfing Pattern signals the buyers are momentarily in control.
But if the long-term trend is down, then it’s likely the sellers will regain control and push the price lower.
So now the question is, how should you trade the Bullish Engulfing Pattern?
Well, that’s what you’ll discover next. Read on…
Bullish Engulfing Pattern: The MAEE Formula
The MAEE Formula for this bullish engulfing strategy stands for:
- Market Structure
- Area of value
- Entry trigger
- Exits
1. Market Structure
The first thing you want to do is identify the current market structure.
Is it in an uptrend, downtrend, or range?
2. Area of value
Then, you want to identify the area of value so you know where potential buying/selling pressure could step in.
This could be Support & Resistance, Moving Average, Trendlines, Channels, etc.
3. Entry trigger
Next, you need a valid entry trigger to get you into the trade such as the bullish engulfing candle.
This is where candlestick patterns are useful because it tells you who’s in currently control (whether it’s the buyers or sellers).
For example, a Bullish Engulfing Pattern tells you the buyers are in control for now.
4. Exits
Finally, you must decide where to exit your trade if the price move in your favour, or against you.
In other words, where’s your stop loss and target profit?
Because no bullish engulfing strategy is complete without an exit plan!
Now…
I know this is a lot to digest, so let me give you a few examples of The MAEE Formula…
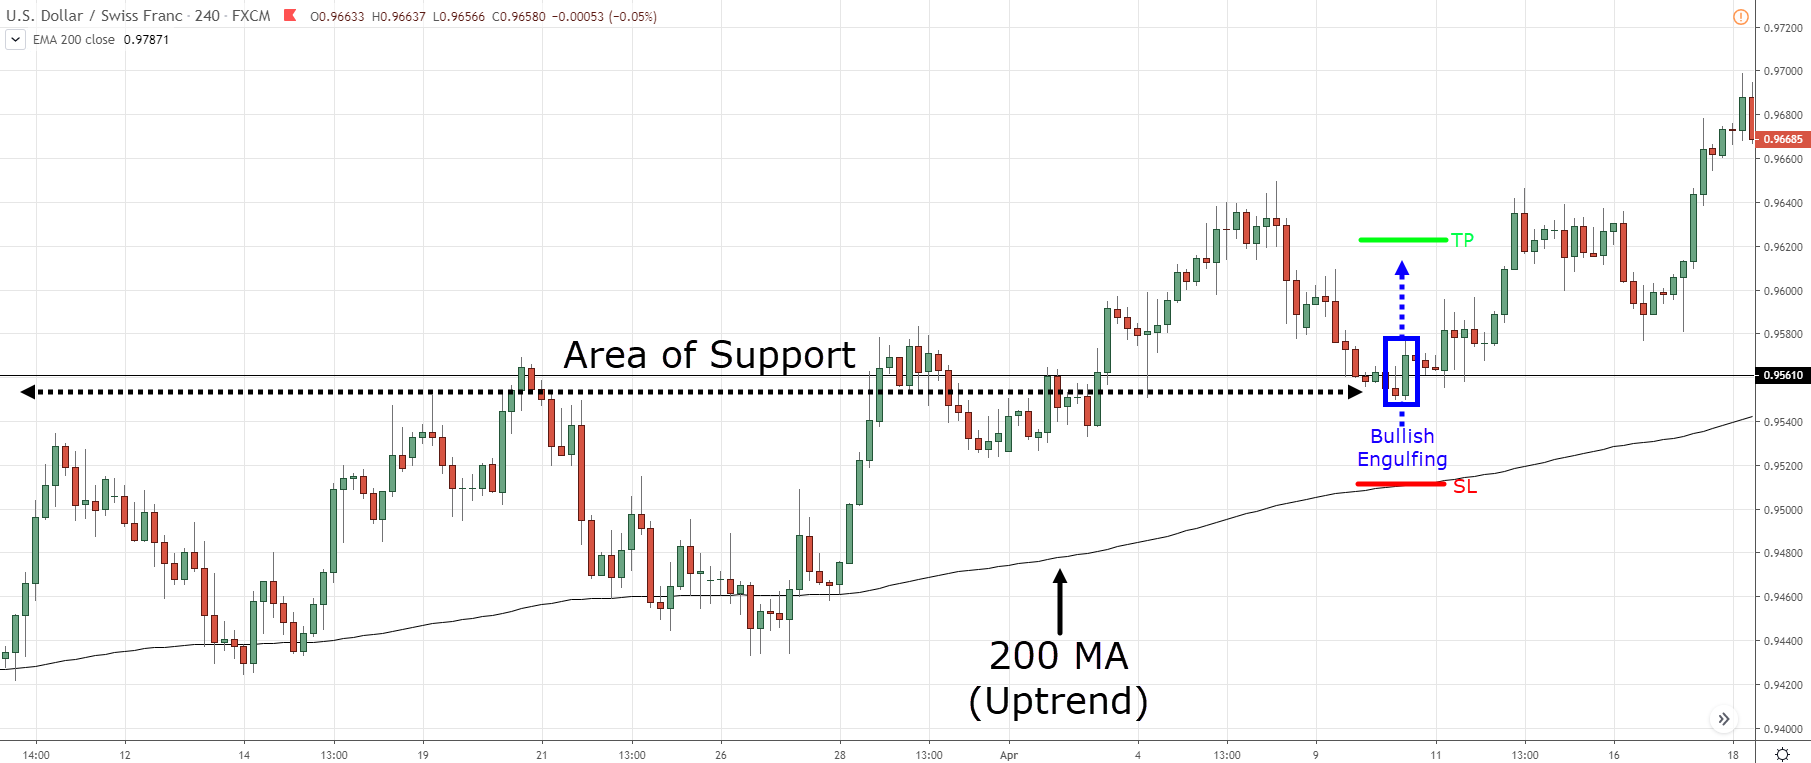
MAEE Formula winning trade on USDCHF 4-hour:
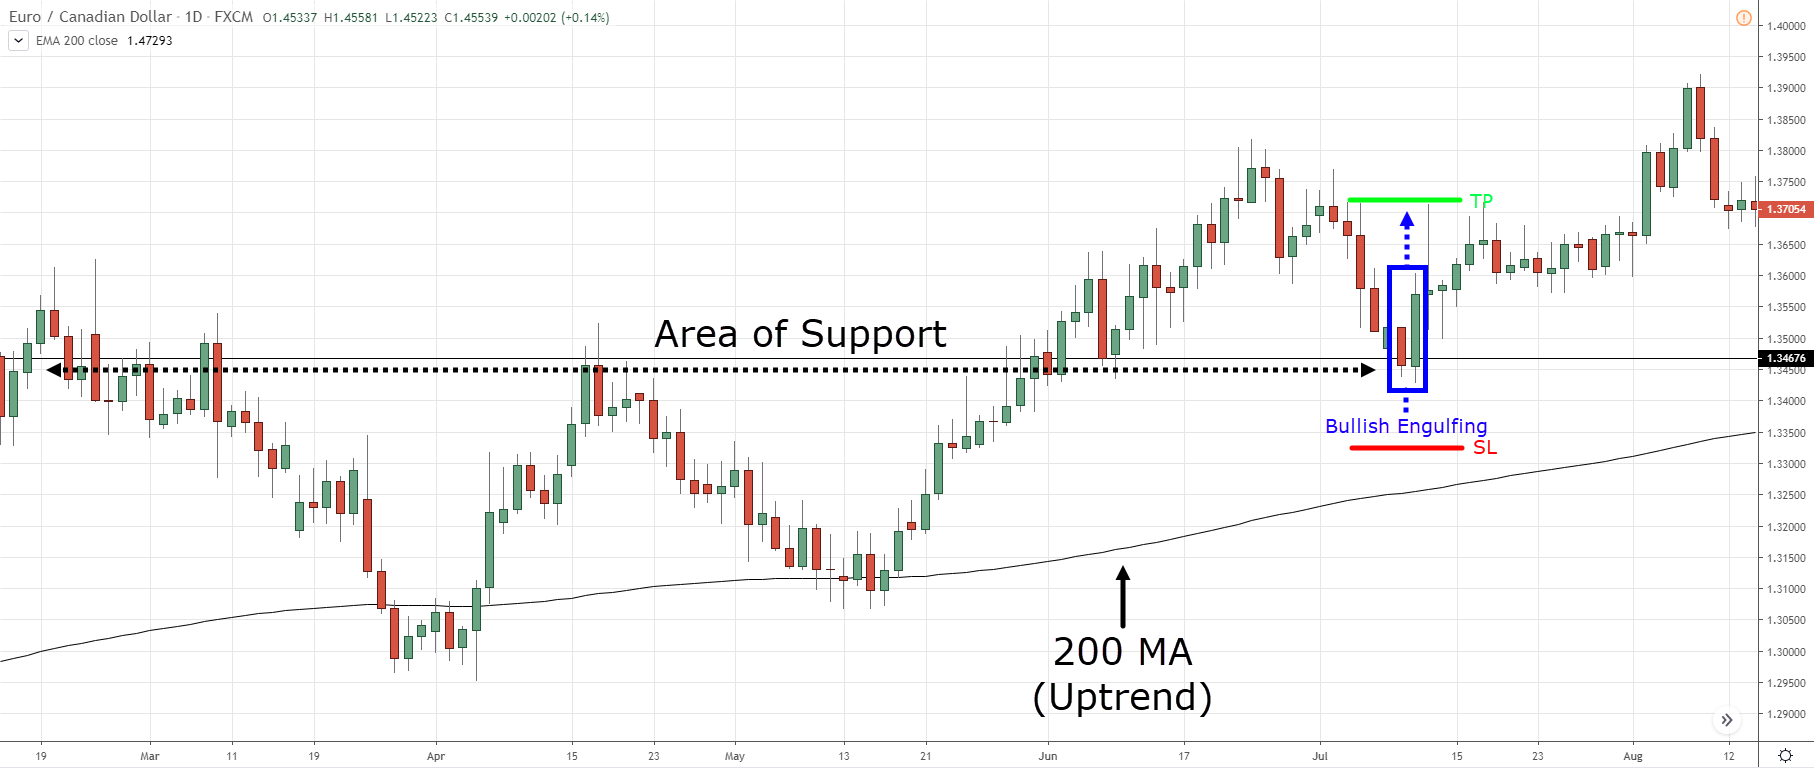
MAEE Formula winning trade on EURCAD daily:
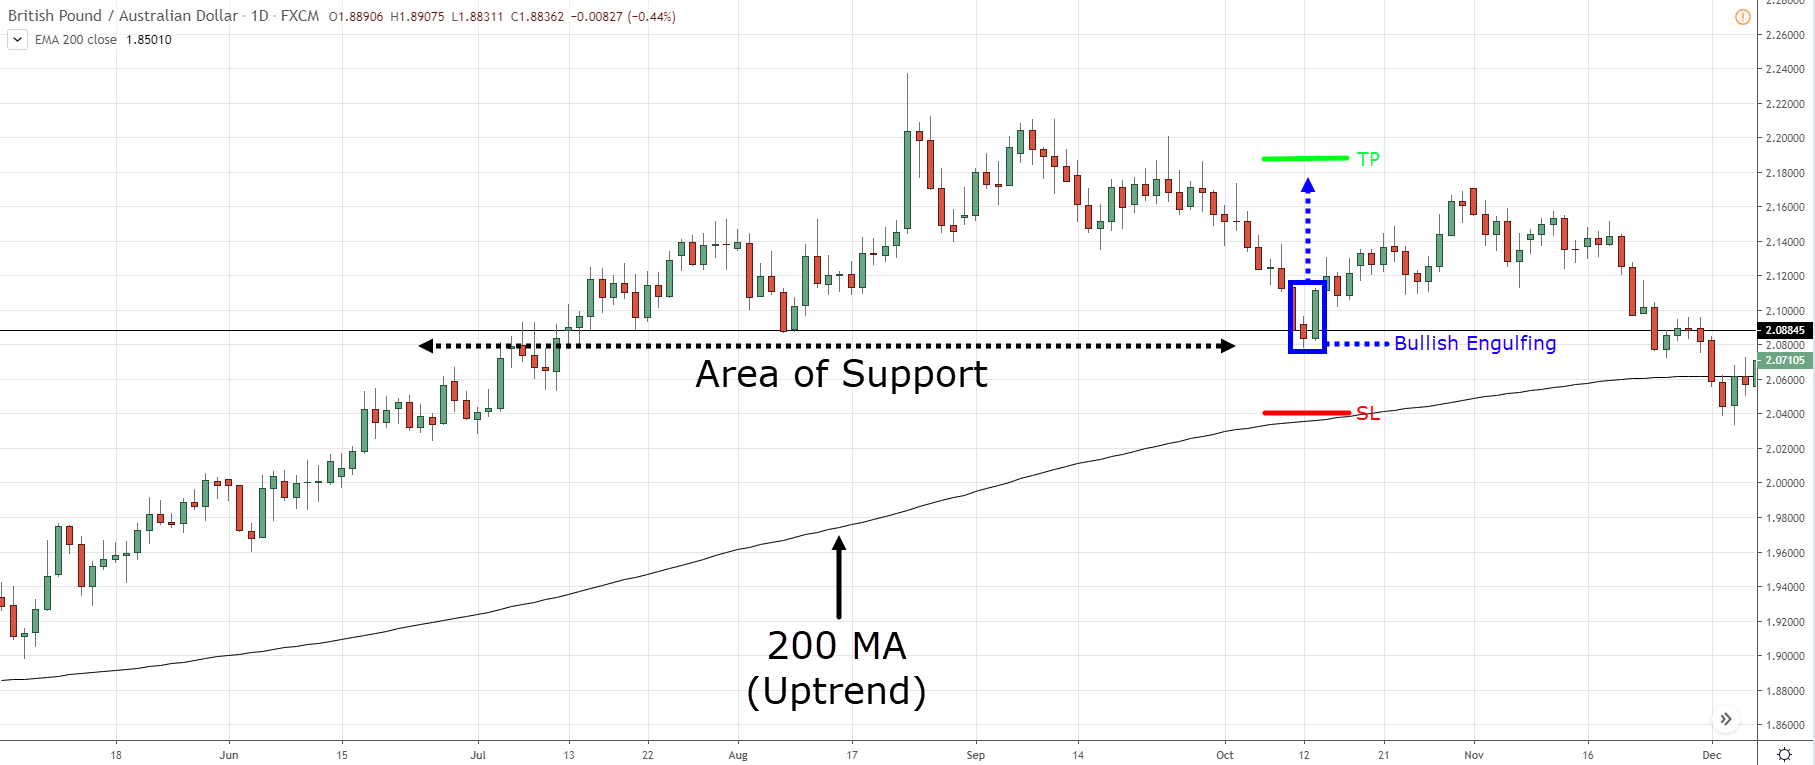
MAEE Formula losing trade on GBPAUD daily using the engulfing candle strategy:
Now, I’ve not discussed exits because it requires an entire blog post on it.
If you want to learn more, these resources will help…
How to Set Stop Loss to Protect Your Profits and Ride Big Trends
How to Use Trailing Stop Loss (5 Powerful Techniques That Work)
The NO BS Guide to Swing Trading
How to use the Bullish Engulfing Pattern to catch market bottoms with precision
Besides using the Bullish Engulfing Pattern as an entry trigger, it can also alert you to potential trend reversal trading opportunities for an engulfing trading strategy.
Here’s the idea behind it…
As you know, a Bullish Engulfing Pattern signals the buyers are momentarily in control.
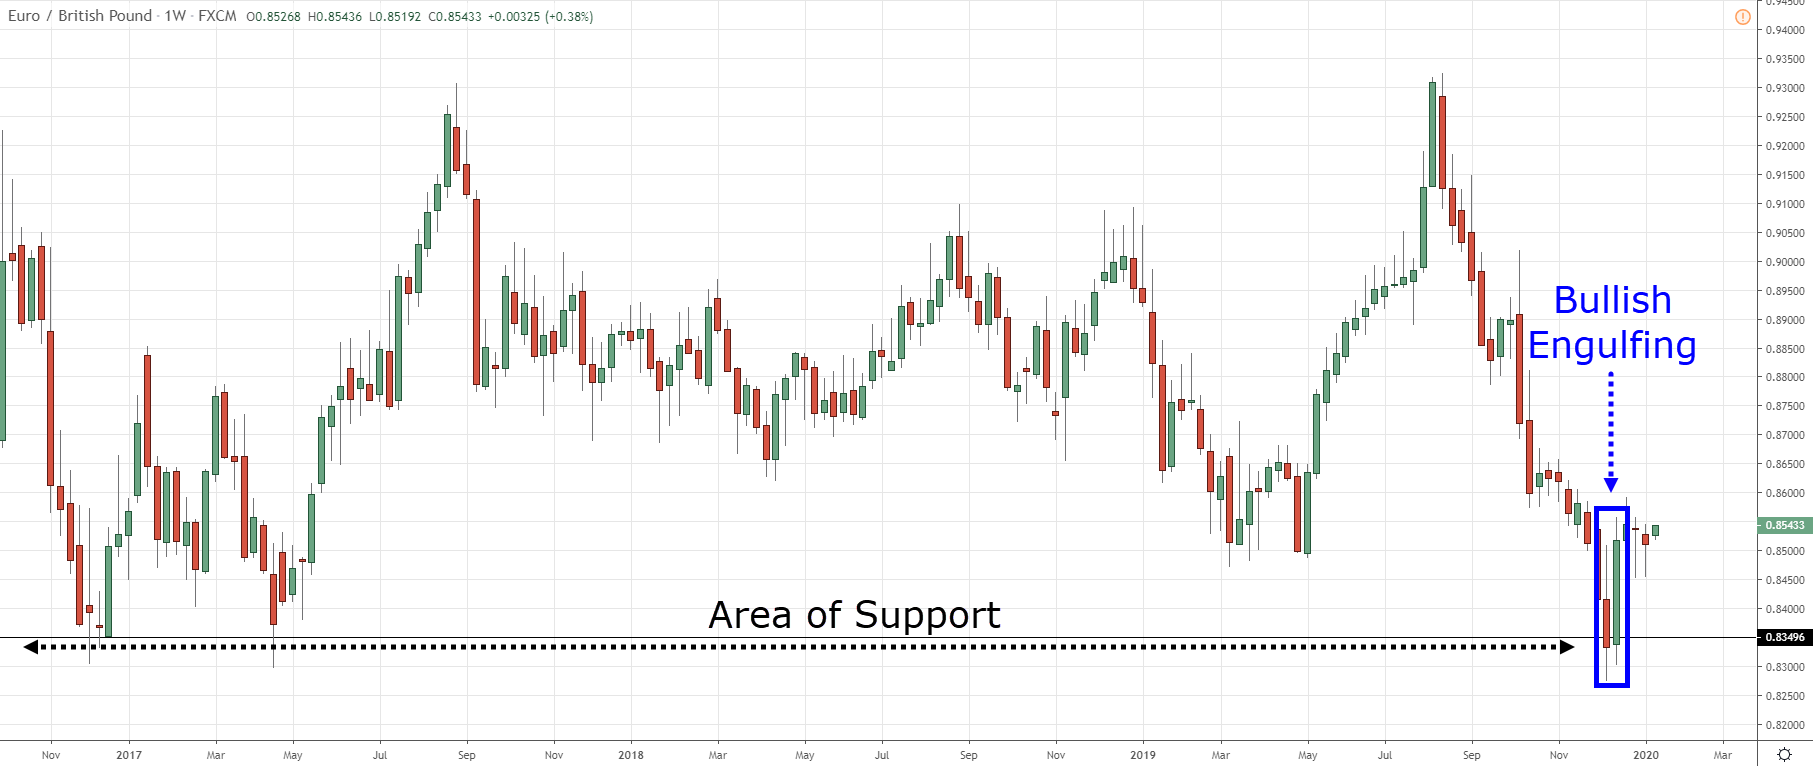
So, when this pattern occurs on the higher timeframe (like Weekly) and leans against an area of value (like Support), that’s a signal the market is likely to reverse higher.
But here’s the thing:
You might not want to trade the Weekly timeframe because it requires a large stop loss.
The solution?
Go down to a lower timeframe and time your entry there with a bullish engulfing candle.
So, here’s how it works…
- Identify a Bullish Engulfing Pattern that leans against an area of value on the Weekly timeframe
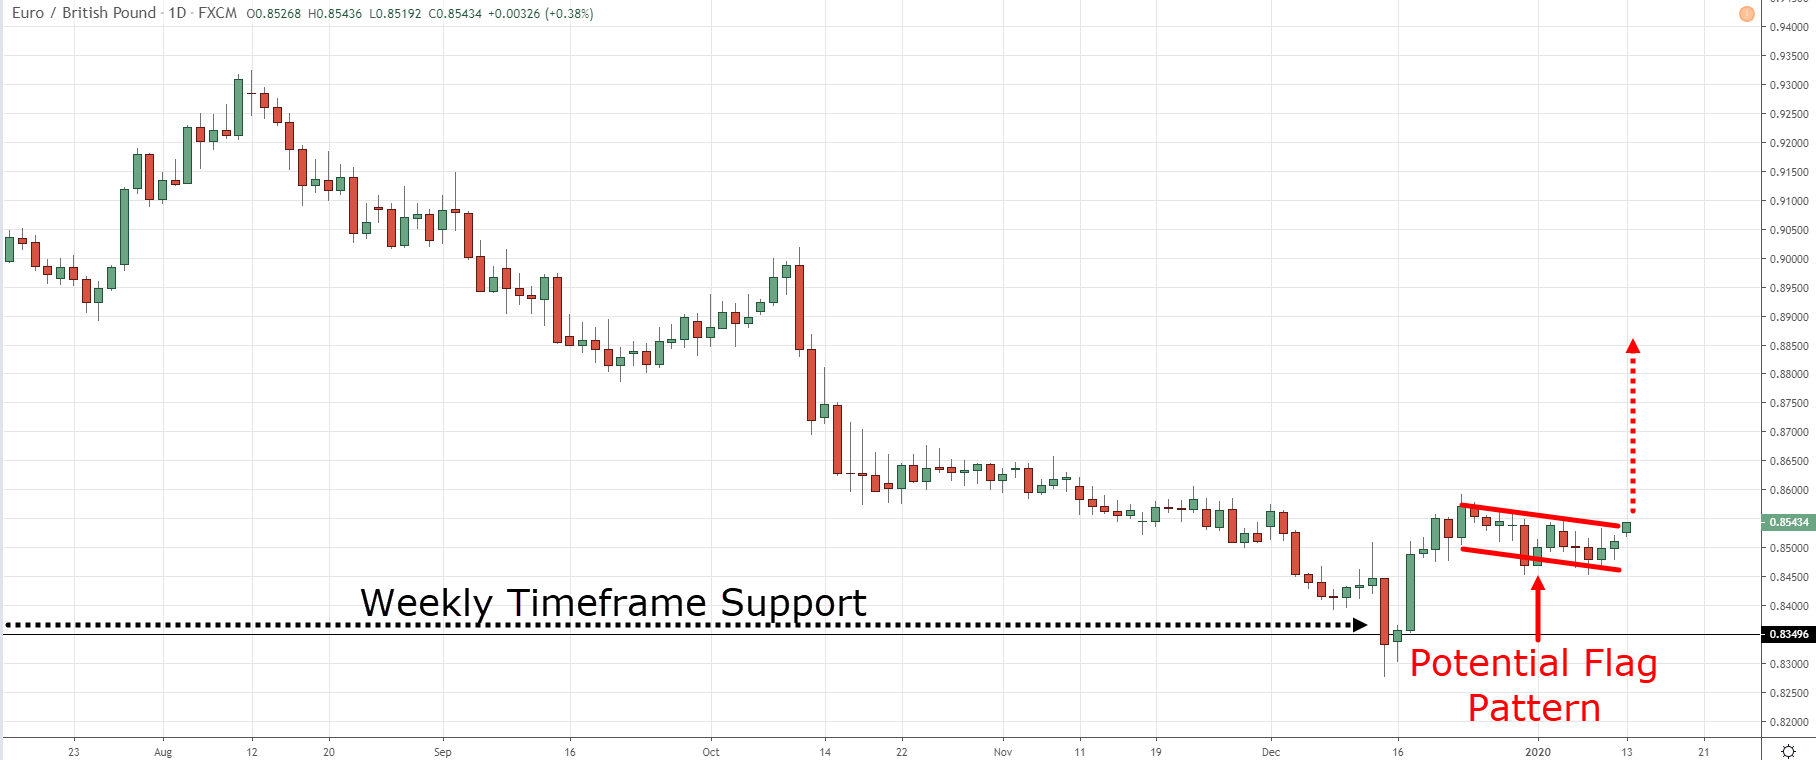
- Go down to the Daily or 8-hour timeframe and look for bullish chart patterns (like Bull Flag, Ascending Triangle, etc.)
- Trade the breakout of the bullish chart pattern
Here’s an example…
Bullish Engulfing on EURGBP weekly:
Potential bull flag pattern on EURGBP daily:
Pro Tip:
You use this concept for other Candlestick Patterns as well like Shooting Star, Hammer, etc.
2 things you must look for when trading the Bullish Engulfing Pattern…
They are:
- Strong momentum move coming into an area
- Strong price rejection
Here’s why…
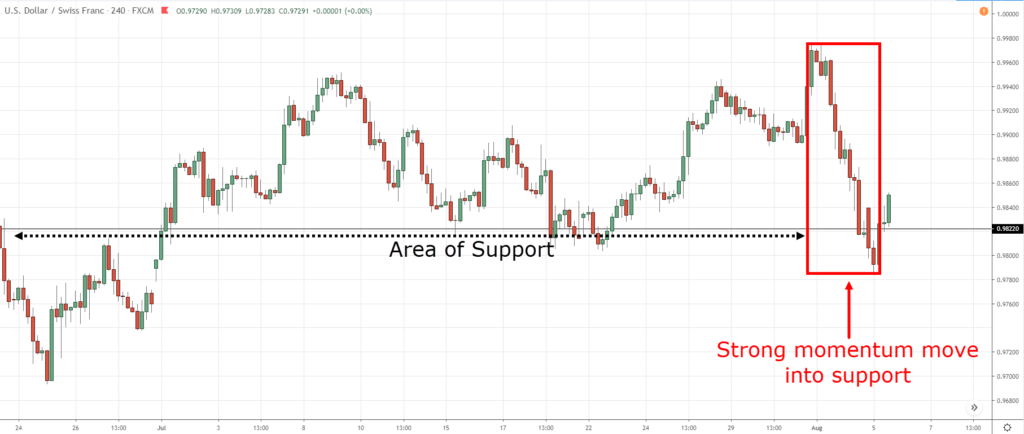
1. Strong momentum move coming into an area
Let me ask you…
If you buy at Support, do you prefer the nearest swing high (or Resistance) to be near, or far away?
You want it to be far away so your trade has a greater profit potential (before selling pressure steps in).
And how do you find such trading opportunities? After a strong momentum moves into Support.
Here’s an example:
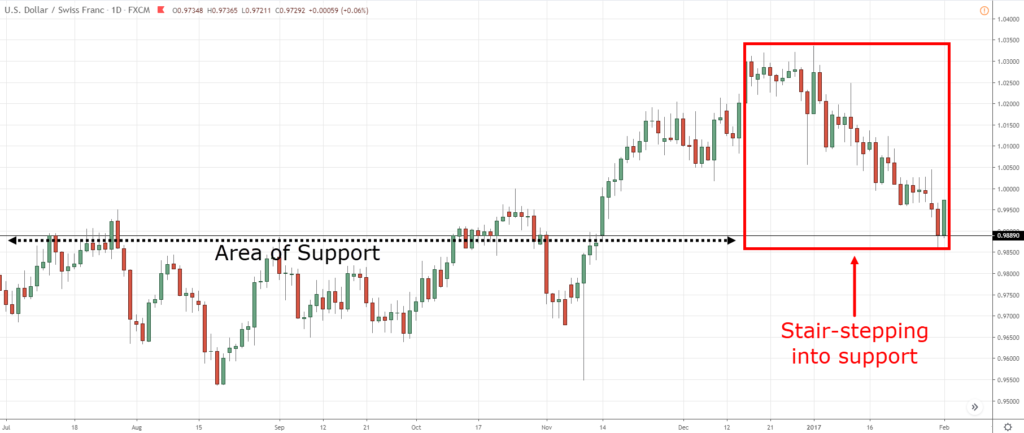
However, if you get a “stair-stepping” move into Support, the price will encounter selling pressure shortly after the rally (at the nearest swing high).
Here’s what I mean…
So if you trade reversals, always look for a strong momentum move into an area.
The bigger and bolder the candles, the better.
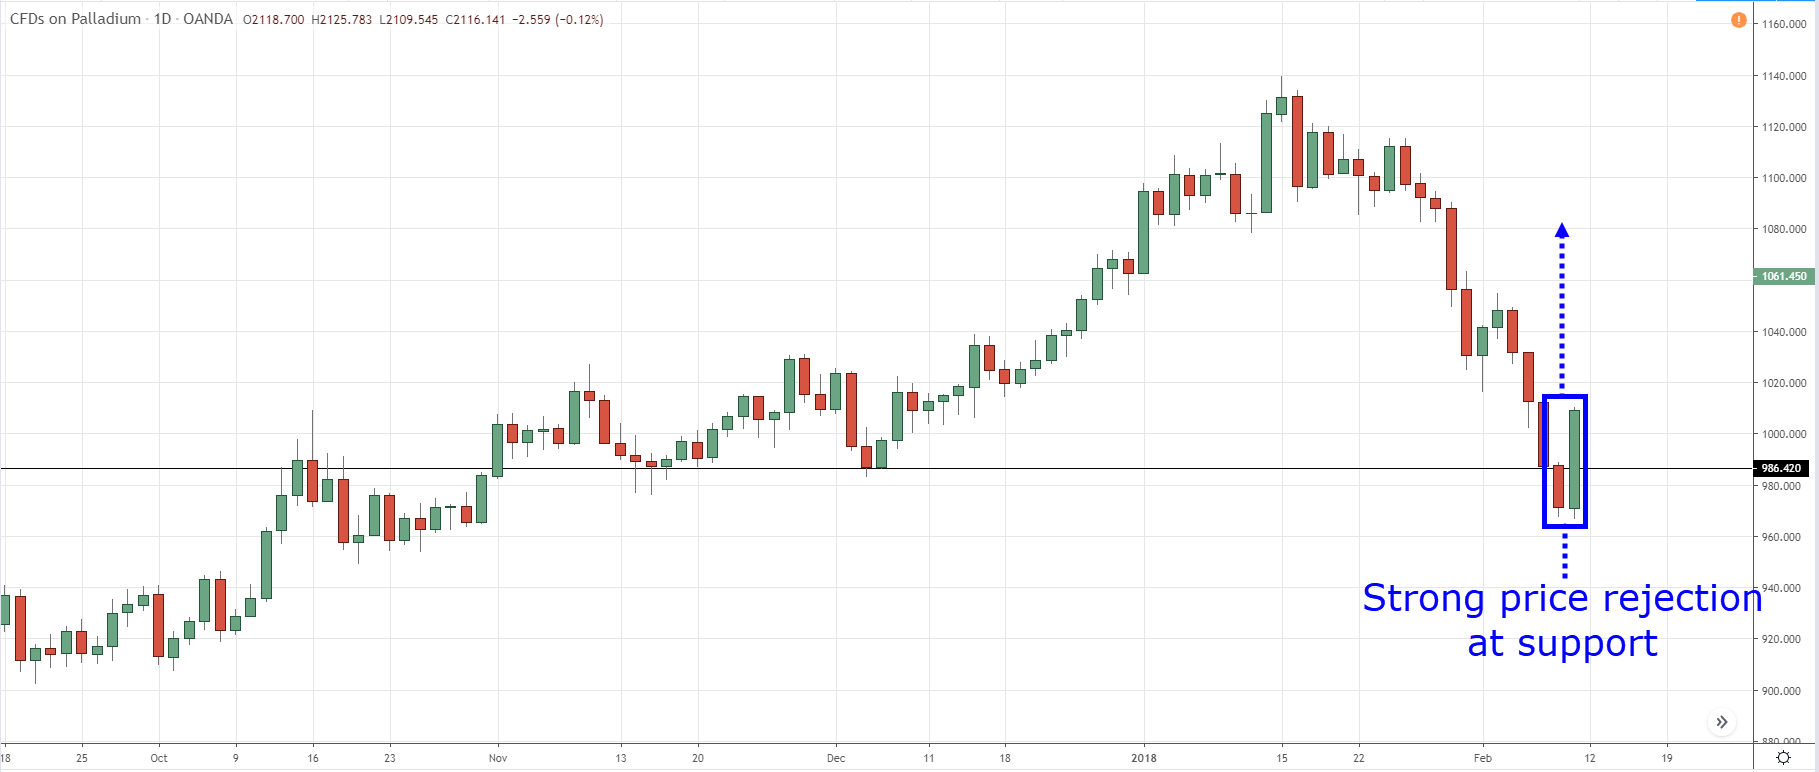
2. Strong price rejection
Here’s the thing…
Not all Bullish Engulfing Patterns are created equal.
As you’ve seen earlier, a Bullish Engulfing Pattern is usually a retracement against the downtrend (on a lower timeframe).
This is especially true if the size of the candle is small or of similar size to the earlier candles.
But if the range of the Bullish Engulfing Pattern is larger than the earlier candles, then it signals strong buying pressure.
Also, if you look at the lower timeframe, you’ll likely see a break of structure as the price makes a higher high and lows (another sign of strength from the buyers).
Here’s an example of a strong price rejection…
Pro Tip:
If the Bullish Engulfing Pattern is at least 1.5 times ATR, then it’s likely to be a strong price rejection. This is one way to quantify a “strong” price rejection.
Conclusion
So here’s what you’ve learned today:
- A Bullish Engulfing Pattern signals the buyers are temporarily in control
- The MAEE Formula which stands for Market structure, Area of value, Entry trigger, and Exits
- The Bullish Engulfing Pattern can serve as an entry trigger
- To identify high probability reversals, you want a strong momentum coming into Support and a strong price rejection
Now here’s what I’d like to know…
How do you use the Bullish Engulfing Pattern in your trading?
Leave a comment below and share your thoughts with me.


nice one
Cheers
I’m a beginner in trading but you lessons is helping me in my process day by day..Thank you
You’re welcome!
I’m a beginner in trading but you lessons is helping me in my process day by day..Thank you
Am a beginner but learning from your trading forex tutorial everyday am gratefull and God bless you, Amen
Cheers
My trading account was exhausted within a few days. This happened twice.
My 3rd deposit was much lesser but although I’m not in profit, I’m still trading on the funds from third deposit by reading your blogs and also listening to your YouTube videos. Great stuff…..you are a inspiration
Thank you, Viv. Glad to help!
Helpful ♥️♥️
Cheers
Hey Rayner
Can you give the chart example with: “2 things you must look for when trading the Bullish Engulfing Pattern” section for better understanding of concept/Logic.
Hey rayner I guess something is missing in the last 2 points
You’re right, let me fix it! Thank you!
Your tips is simple to follow and not difficult to understand.
Keep it up, Bro.
Thanks.
Hi Antontyo,
It’s my pleasure…
Awesome!! Learning day by day since i came to know your videos and from your books and blogs. Thanks keep up the good work. God bless you!!!
Hi Nabeel,
I’m glad the videos and blogs are helping.
Cheers!
Wonderful! This is helpful.
I normally use the Bullish engulfing in an uptrend, (similar to MAEE formula), combined with an oversold stochastic for extra confirmation.
Hi Driod,
I’m happy to hear how you trade the bullish engulfing.
Cheers…
Learning more N more each day. Tkz rayner
Thank you, Kevin.
Love it
I will love to have this Price action trading secrets
Can ship one to me in Ghana??
Hi Conqueror,
You can request your copy through the link below
https://priceactiontradingsecrets.com/
Cheers.
How do I get your books .great content.
Hi Yaneliswa,
You can get your books through the link below.
https://www.tradingwithrayner.com/menu-books/
Ryner has helped me alot with my trading even thou am still struggling he has helped me understand what I didn’t know
Awesome, Tayron!
How can I get the price action trading strategy book?
Hi Tayron,
You can get the book at
https://priceactiontradingsecrets.com/
Cheers.
Awesome Really usefull
Thank you, Sanjay!
Thanks very much I really appreciate your good work. Sir please what is full meaning of ATR
You’re welcome, Simon!
Mr.Rayner, your Forex lessons cum videos are just incredulous. It’s really improving my understanding of the dynamics of forex trading. I appreciate you.
Glad we could help, Emere!
It’s our pleasure.
Cheers!
Very good i hadn’t seen this type of literacy in stock market.⚘⚘⚘⚘⚘ thanks a lot sir
We hope you like it as much as we do, Ramesh!
We wish you the best!