Do you want to know how to identify trend reversal ahead of time, guaranteed?
Well, it doesn’t exist.
No trading system or methodology can.
There isn’t a best trend reversal indicator out there either.
However…
The closest thing you’ll get is to learn how to read the price action and identify potential areas where the market could reverse.
And this is what you’ll learn in today’s post:
- How to identify trend reversal by analyzing price action of the markets
- How to tell where the markets will possibly reverse from (with heightened accuracy)
- How to identify high probability trend reversal
Ready?
Then let’s begin…
How to identify trend reversal — identify weakness in the trending move
First, let me define what a trending move is…
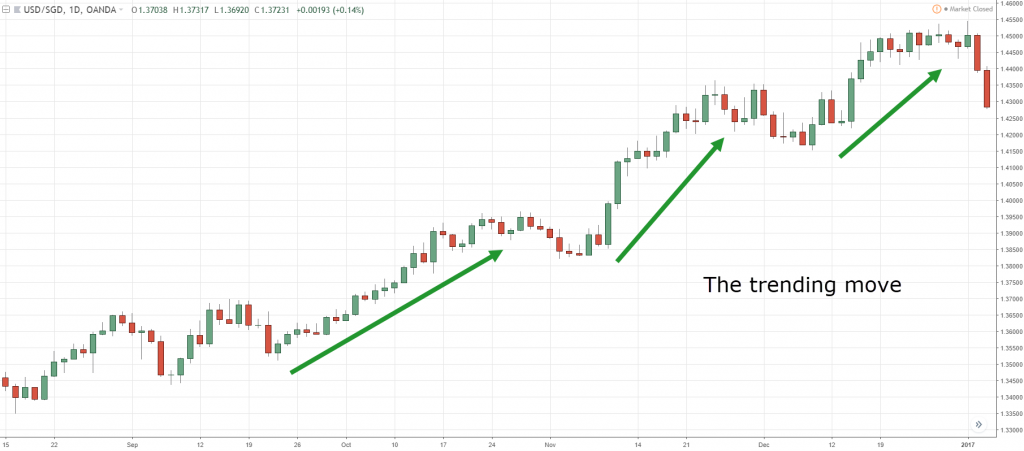
A trending move is the “stronger” leg of a trend and it trades in the same direction of it (that’s why I call it trending move).
The trending move (in a healthy uptrend) usually has more bullish than bearish candles; the bullish candles are relatively larger than the bearish ones, and the bullish candles closing near the highs
An example:
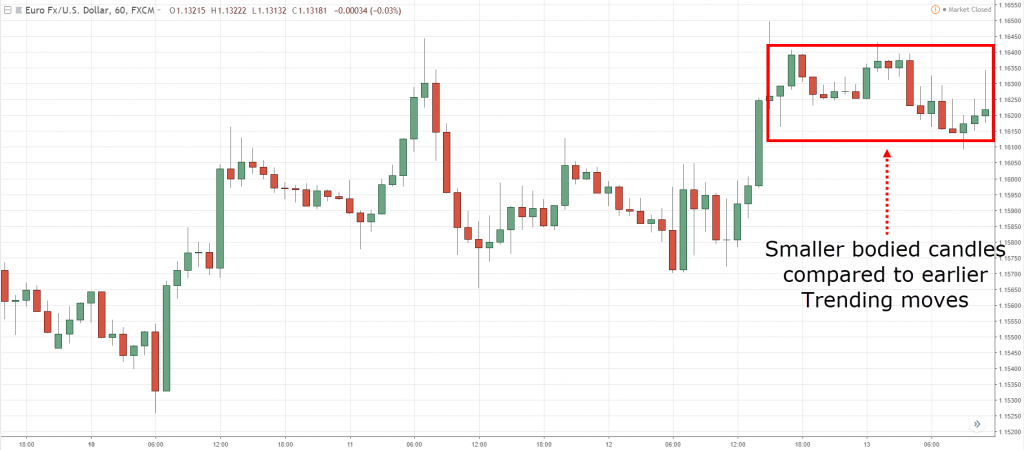
When the bullish candles are getting smaller, it’s telling you the buying pressure is getting weak, or there is equal selling pressure coming in.
An example:
Now, this doesn’t guarantee the market will collapse lower. But it’s a tell-tale sign the buyers are getting weak and may need a “pause” before staging another move higher.
Next, you’ll learn about the retracement move…
Identify strength in the retracement move
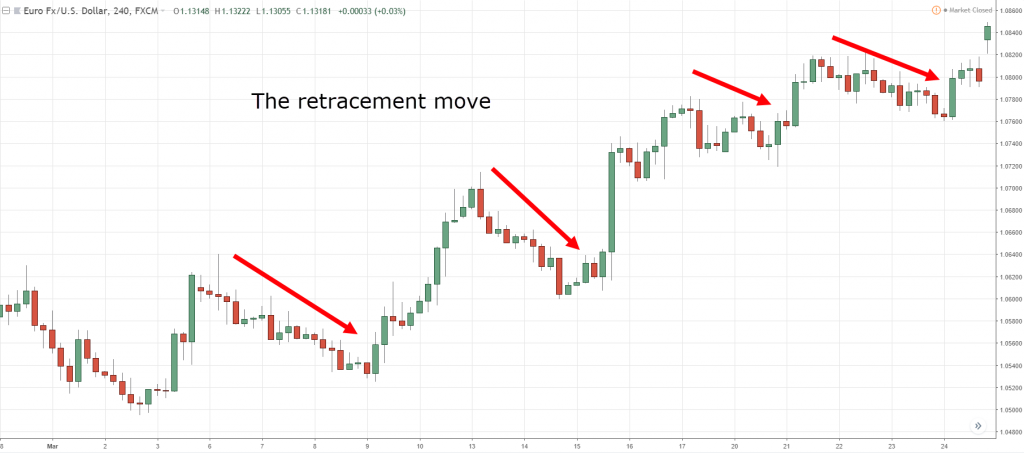
A retracement move is the opposite of the trending move. It’s the “weaker” leg of a trend and it trades against the direction of it (that’s why I call it retracement move).
The retracement move (in a healthy uptrend) usually has more bearish than bullish candles; the bearish candles are relatively small, and it usually closes near the middle or lows of the range.
An example:
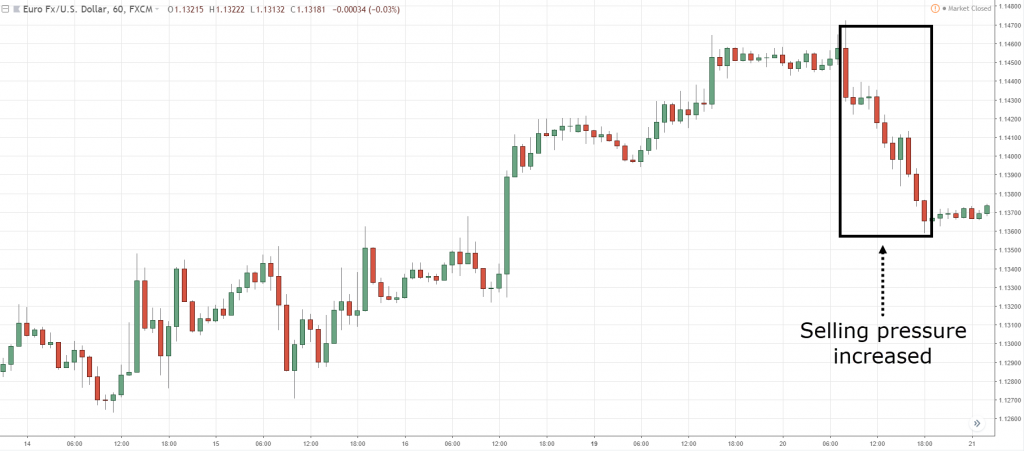
When the bearish candles are getting larger, it’s telling you the selling pressure is getting stronger as the buyers are unwilling to buy at higher prices.
An example:
Again, this doesn’t guarantee the market will reverse from here. But it’s another sign the buyers are getting weak.
How to identify trend reversal — a break of Support/ Resistance area
As a trend matures, it will move into a distribution stage where both buyers and sellers are in equilibrium (thus looking like a range market).
At this point, it’s clear the area of Support is an important level as it’s the last line of defense for the buyers. If it breaks, it’s pretty much game over for the bulls.
Here’s what I mean:
Based on my experience, the more times Support is tested within a short period of time, the greater likelihood it’ll break.
If you want to learn more about trading the break of Support, then go watch this training video below:
A break of the long-term trendline
Also…
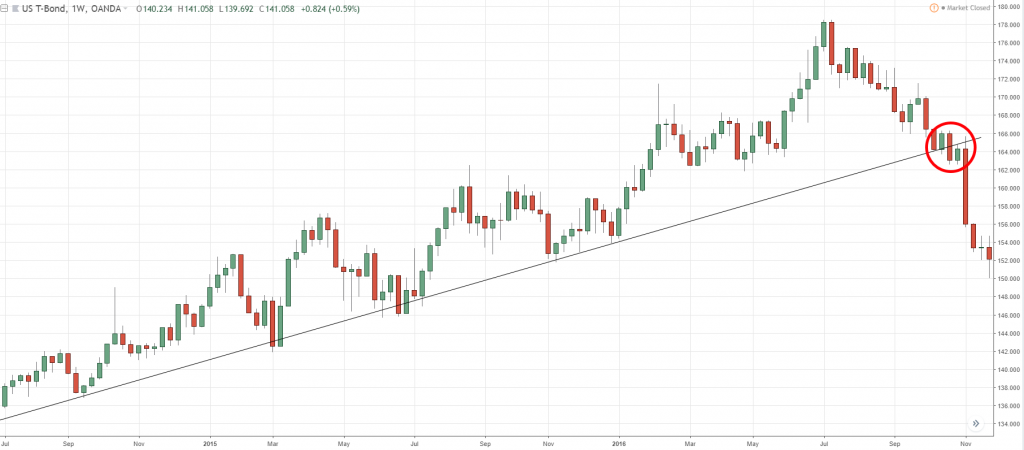
There are times when the market respects an important trendline and if it breaks, it’s a sign that the buyers are getting weak.
An example:
So what you’ve learned earlier are “analysis” techniques to help you analyze when a trend will reverse.
But that’s not enough because the structure of the markets is always changing. Sometimes it respects Support or Resistance, the next time it could be trendline, and etc.
So in the next section, you’ll learn “predictive” techniques to help you identify high probability scenarios where the market is likely to reverse.
Read on…
Possible areas where the market could reverse — higher timeframe structure
It’s no surprise the higher timeframe carries more weight than the lower timeframes. This means a Support on the weekly timeframe is more significant than a Support on a 1-hour timeframe.
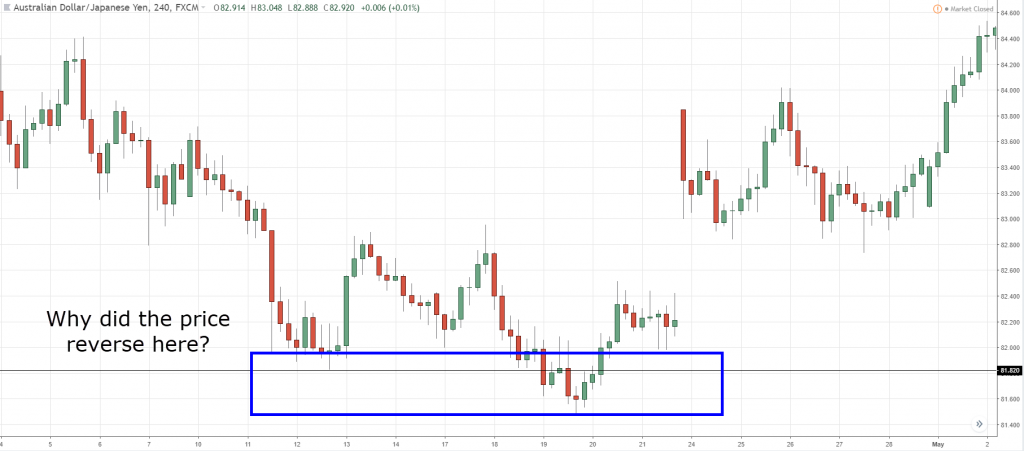
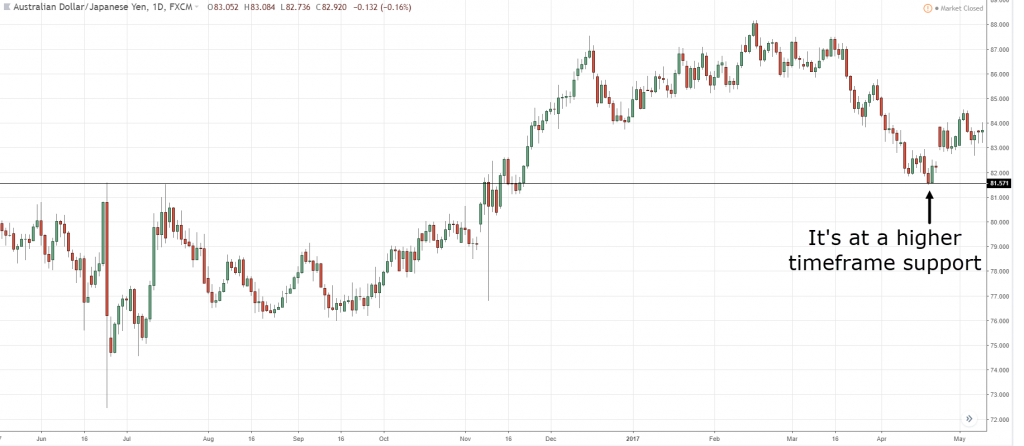
So, if you see the market suddenly reverse, chances are, it came into a higher timeframe structure (like Support or Resistance) and reverse from it.
Here’s an example:
And this can be useful for two reasons:
- You can find high probability reversal areas based on the higher timeframe structure
- You can avoid poor setups that trade directly into higher timeframe structure
Powerful stuff right?
Let’s move on…
Overextended markets
First, let’s define mean reversion and overextended markets.
Mean reversion – This means trading back towards its average value (that could be defined using Moving Average, Bollinger Bands, or even a trend reversal indicator, etc.)
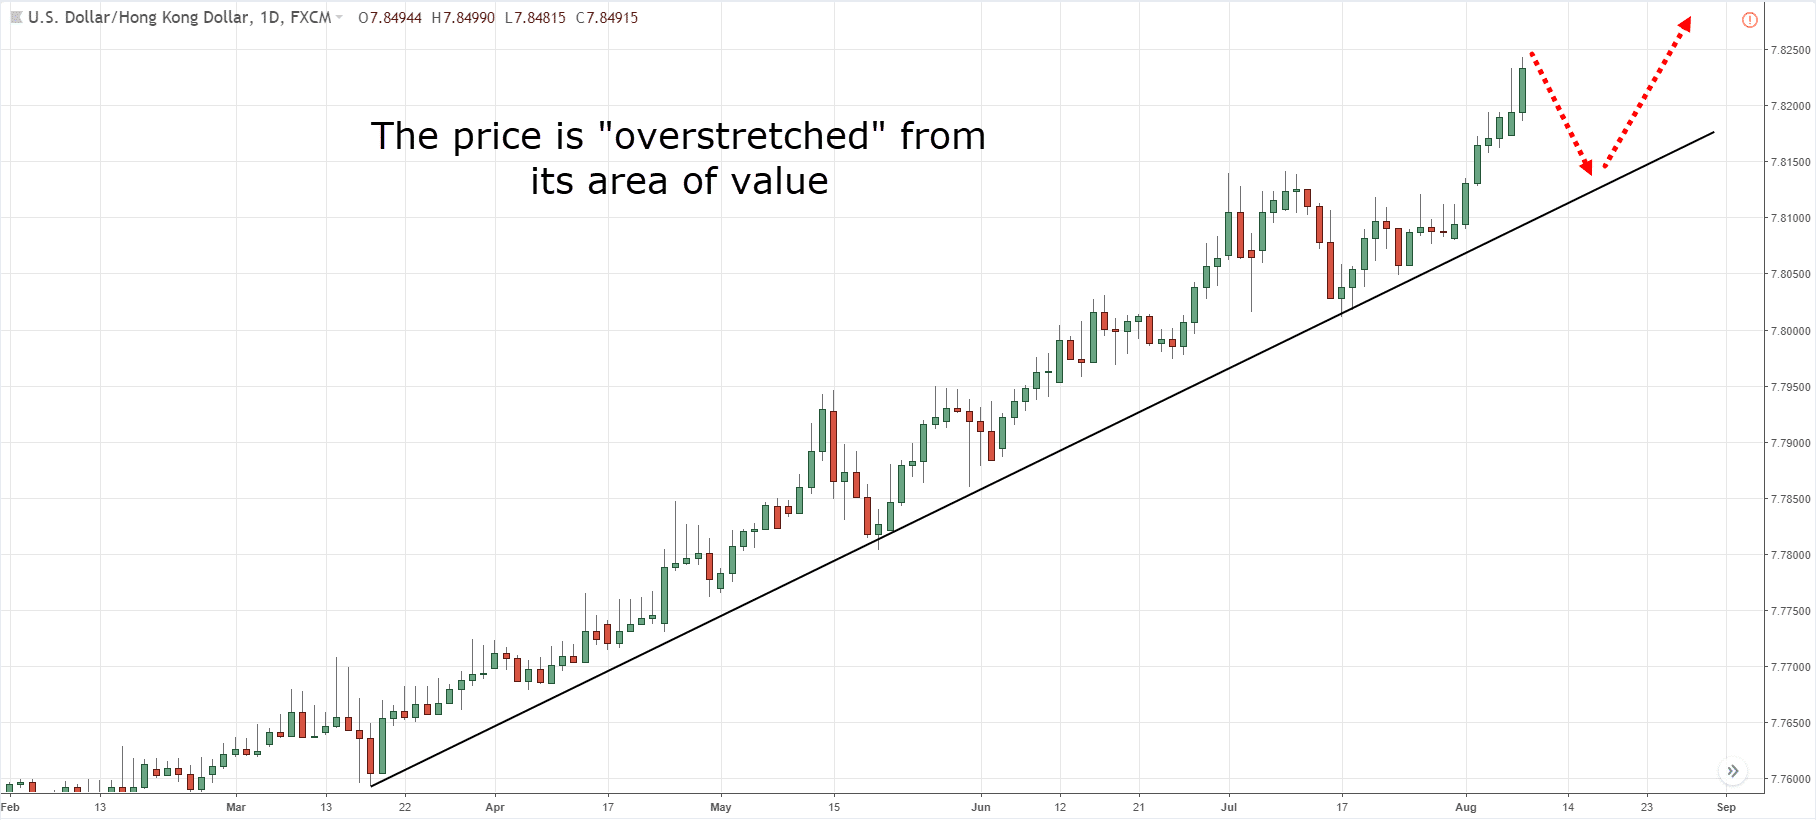
Overextended markets – This means the market is “overstretch” away from its average value.
Here’s the thing:
The market seldom trades in one straight line. If it’s “overstretch”, it usually retraces before trading higher again (that’s why you get higher highs and lows in an uptrend).
Now you’re probably wondering:
What does an “overstretch” market look like?
(Hint: you don’t quite need any reversal indicators to help you spot this.)
Here’s an example:
So when you spot an overextended market, it’s prudent to wait for the market to retrace before taking a position. Or, if you’re a mean-reversion trader, you can take a counter-trend trade towards the mean.
Let’s move on…
Parabolic move
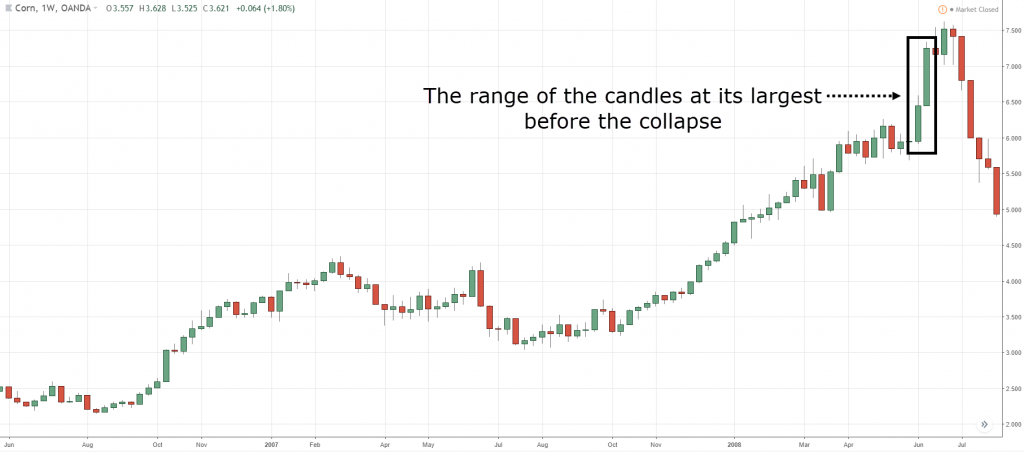
A parabolic move usually occurs when it is in a long-term uptrend and the market suddenly goes ballistic and moves vertically higher (like a rocket taking off).
You’ll also notice that the range of the candles in the parabolic move is much larger compared to the earlier ones.
When this occurs, it’s usually a sign the uptrend is coming to an end as the “dumb” money is rushing to enter the markets, while the “smart” money is exiting their trades. Thus, what you get is a huge spike in volatility.
So, if you notice a market that’s been trending for a while and it suddenly goes parabolic, it’s a good sign that the top is near.
Here are a few examples:
I know identifying parabolic move can be subjective. So here’s one of the many reversal indicators you can keep an eye on…
Use the average true range indicator and identify the volatility over the last few years. If it’s at multi-year highs, then it’s a warning sign.
You can even use the Keltner Channel as a trend reversal indicator to “predict” market turning points.
How to identify high probability trend reversal
So…
You’ve learned the different techniques to identify trend reversal and to anticipate market turning points.
But here’s the thing:
You don’t want to use any of this technique in isolation because it usually results in a low probability trend reversal.
However, when you combine a few techniques together, you can spot some high probability trend reversals. Here’s how…
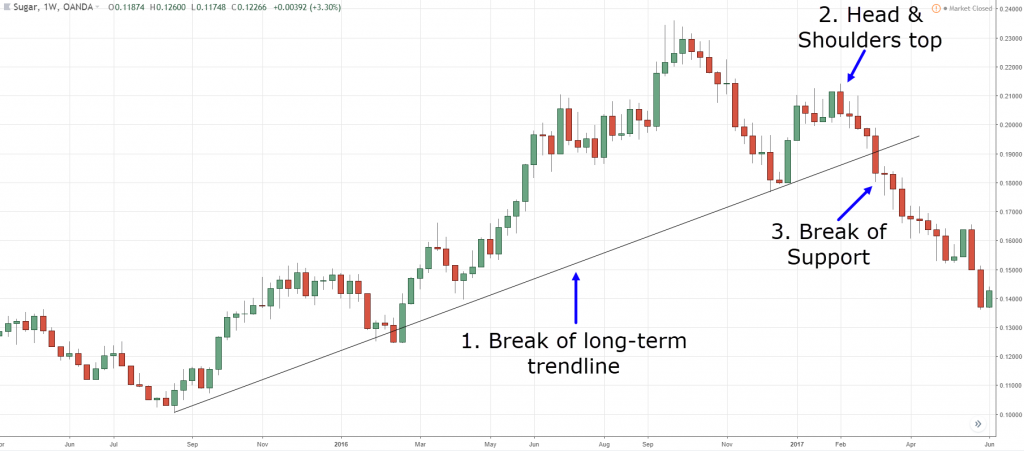
Sugar Weekly
The last line of defense for Sugar was the long-term trendline and area of Support. It was eventually broken with price forming a head & shoulders.
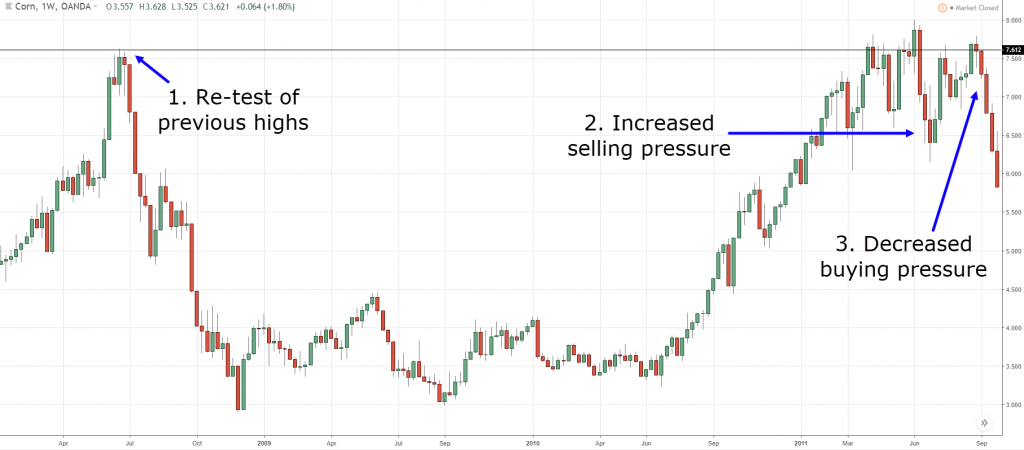
Corn Weekly
Corn re-tested a previous high with strong momentum.
However, there were red flags as the selling pressure increased (large bearish candles), and the buying pressure decreased (small bullish candles).
Plus, you’ll notice one of the common trend reversal patterns…
You could see a small head & shoulders pattern signaling that the buyers were not able to break above the highs.
Now there are no hard and fixed rules to which combination is the best. It’s all about reading the price action of the markets to find high probability market turning points.
And no matter how confident you are, you still need a plan to enter, exit and manage your trades… using proper risk management.
Frequently asked questions
#1: How do I confirm that a parabolic move would reverse or continue even higher?
There’s no way to tell for sure. But what I pay attention to is the depth of the pullback.
If the pullback is shallow with small range candles, then chances are, the market will stage another rally higher.
However, if the pullback is very steep with large retracement candles, there’s a good chance that the parabolic move is over and the market could move into a range or reverse altogether.
#2: Are there any common chart patterns to trade trend reversals?
Yes, there are. If you want to discover more trend reversal patterns to trade trend reversals, then check these out:
- Inverse Head and Shoulders Pattern Trading Strategy Guide
- Head and Shoulders Pattern Trading Strategy Guide
- The Double Bottom Pattern Trading Strategy Guide
- The Complete Guide to Triple Top Chart Pattern
Summary
There is no method that can show you how to identify trend reversal with 100% accuracy.
Likewise, there’s also no such thing as the best trend reversal indicator out there.
Instead, what you can do is to read the price action and identify the possible area where the market could reverse.
Some of the things you can look at are:
- Identifying weakness in the trending move
- Identifying strength in the retracement move
- A break of key Support or Resistance
- A break of long-term trendline
- The price is coming into higher timeframe structure
- The price is overextended
- The price goes parabolic
The more confluence factors there are, the greater the likelihood of a trend reversal.
Now, over to you…
How do you identify trend reversal?
Leave a comment below and let me know your thoughts.




Hi,
Your content is extremely useful to me because they give me a fine adjustment I missed. I basically worked as a countertrade trader. Reversion of the trend I find using the important structures on D1 (support and resistant), then on H4 I’m looking for fibonacci zones 127, 2 ext or 161,8 ext (possible 141,4 ext). If they match the structure, I look for a moment when RSI oversold / overbought. I’m looking for harmonic patterns in those zones too. I’m looking for double bottom or tops. I’m looking for divergence. These are all the confirmations that help me to decide. As a trigger, I use a higher high / high close (or oposite) method or engalfing candle. Each Confirmation gives a specified number of points. I enter the trade with a minimum of 3 points. This is called CTS (Combine technic score system). This of course does not work best when we are in the trend at that moment.
Hi Daniela
Thank you for sharing your thoughts, that’s an interesting way to look at things.
cheers
So you look at all these things before you place a trade ooh , this is analysis paralysis,
Hey Rayner,
Thanks for another great educational article on trend following trading. This is really helpful content for both beginner and advanced traders alike. You’ve shared some great tips for trading (or at least being aware of) trend reversals, which is certainly key for trading success. Thanks again!
Jay
Hey Jay
I’m glad to hear that buddy!
Rayner you are doing a nobel work!
Cheers Swapnil
Brilliant article and really useful for me on my demo account. Keep up the good work…
You’re welcome, Mark.
Rayner:
Thank you for sharing this great article.
I am curious what is the difference between the free articles compared to what is being shared in
your course?
Cheers,
John
Hi John
The Pati is more structured and covers price action trading from A-Z.
It has more examples and instructions although I do agree there is some overlap.
your tips are just great
Thanks bud!
iam already trading forex ten years but no sucesess ,think forex just a scam .strategy working today but not tomorrow .regards
Perhaps this post might help…
https://www.tradingwithrayner.com/profitable-trader/
Great post dude…….every word is true n meaningful…… Hats off
Thanks bud!
Hey Rayner
Great post as always very helpful
Keep up the good work many thanks for all you do.
Thank you, Barry!
This is sooo helpful to me,ever since I start following you,I see a great improvement, thank you
Awesome to hear that!
Hi Rayner,
Once again, another article explaining how to identify a trend, and how to predict a trend reversal, in a way that all beginner traders like myself can understand. Great work – cheers!
Jimmy
I’m glad to hear that, Jimmy.
Cheers
OK . But being profitable is about more than these chart analysis. Can you post your trading results, Mr Rayner?
And why would I want to do that?
Because most trading bloggers do not actually trade. Thus not credible. By posting your results we make sure you are a trader.
So I’m supposed to go through all the trouble just to prove myself to you?
Which trouble? Just admit you don’t trade and don’t have a track record. Just like other gurus around there, Nial fuller, Al brooks and company
Stop being a hater! You can post your results instead.
Hornbill
Thanks for this article.
Aud/jpy do you think is reversing?
Looks like to me that from a downtrend and is consolidating and getting ready to either break to the up or to the down.
Well Rayner, I don’t care if you trade or not OR if you make/lose money with your strategies.
What I care about is reading your articles and your understanding of market. Both of which are outstanding for me. Simple yet efficient. 1000 likes for your effort you put to teach something for free….
I’m glad to hear that, Bitu!
Thank you Rayner. Good points to bear in mind for higher probability reversals.
cheers
Thanks Ray,
This is what i needed because i messed up my trade last week because i failed to spot these signs of Trend Reversal. Now I have learnt. Thank Heavens it is a Demo Account.
Learnt from experience, thanks a lot for these useful points.
A question,
Do you have a training program i can join?
You’re welcome!
Enrolment is closed at the moment. But you can join my email list and I’ll update you when it’s available.
cheers
Ray,
How do i join your email list?
Just head down to my website and download and of the guides.
Hey Rayner! What if the market is in a range then suddenly it goes parabolic at the breakout; should you try to hop on and chase it or wait for it to retract? I always miss big moves because I’m so scared of hoping on a parabolic move only to buy at the highs and see the market move against me and the stock is usually sleeping in a range so it won’t show in the top trending stocks to trade and before you know it the price is too high already to chase. Sometimes also, I don’t hop on to stocks that makes a parabolic move from a range because I’m scared it might suddenly reverse against me then suddenly it just keeps going and going and I get left out of the big move. Can you give suggestions on how to identify stocks like these even before the big move happens?
Thanks,
You can look to trade the first pullback, usually in the form of a flag pattern.
Yes, but the only problem is that these kinds of stocks don’t do flag patterns they just suddenly go up and die down fast. Do you suggest not to ever trade these kinds of stocks?
Best Regards, 🙂
I’m not sure what kind of stocks you’re referring to.
I’d rather you do backtesting or forward testing work, gather some data and judge from it. Anything based on emotions or experience are seldom accurate.
Rayner, you are literally the most helpful Trading guy on the internet that I have found. If anyone asks about trading I will refer them to you.
Many thanks, Dave R Pierce.
Thank you, Dave.
I appreciate it.
Market is high probability game . And with minimum risk optimum reward in price action reading techniques is the crux. I am supply demand trader. Your views notes articles helps me lot and I was not big fan of indicators except 20-50 EMA. Your articles made me look at few indicators such as MACD RSI and BB particularly all time high stocks, momentum trading, I use as odd enhancer. Whenever I look for trend reversal almost in similar ways as you explained in this article. I rely more on execution price coinciding with higher time frame and check what price is doing in lower time frame where the first indication happens the likelihood of trend reversal in coming days. Thanks for your regular articles
Thank you for sharing, Pankaj.
Hi Rayner, do you have an article on how to do the multi-timeframe analysis? Do you use it when you trade?
This might help… https://www.youtube.com/watch?v=YR_32PJVWQA
RAYNER,
Thanks for the inputs that u have mailed me.
Samson
You’re welcome!
Thanks Rayner
cheers
It is very easy after the fact but it is very difficult before the fact. Looking at the chart after reversal looks easy. In stocks, I use block trades to help me find reversal zones. I don’t rely on price action only
Thank you for sharing, John.
Thank you, Rayner. Your training is always very good. I’ve learned a lot from your post and sharing.
I’m glad to be of help, cheers.
very very good explanation
keep up the good work
I will, cheers.
Excellent analysis, thank you.
You’re welcome!
Thank you so much sir
You’re welcome!
Hi my problem is to entry point,how to tell if the trend is continuing or ending,an can u be my mentor?
Hi Rayner, I am Goerge Papazov founder of Tradepro Academy. I have learned a lot from your blog, daily I am trying to check your blog for my blog. I trying to build my career with “tradeproacademcy.com”. If you have a little bit of time to check site or blog and leave a comment about it. You’re always welcome to any advice or suggestions for my business.
Thanks for sharing this one.
Best thing I’ve learned is to deliver value, help out as much as possible — consistently.
Give your best and people would appreciate it and spread the word for you.
Dear Rayner, Thanks a lot for your interesting article. I have learnt a lot from it. Could you please make your text bolder when you give out other articles?
Do you mean when I link out to other articles?
If the market is in an uptrend a strong bearish candle should alert you … The retracement move will be larger the trending move will be smaller… Then look for a break of structure
Thanks for sharing, Al!
Great stuff Rayner. It’s clean looking, concise and there is actually some substance in your post… The majority of.the stuff out there misses some or all of those categories.
Thank you, Eric!
Hi Rayner. Thanks for the article. It provides great info. Can you make a video or article on how to analyse price with volume and identify key reversal areas? That would be really very helpful.
Check this out… https://www.youtube.com/watch?v=aWN5oeVWA2A&t=3s
Identify strength in Retracement
Lookout for over stretched candles
Parabolic moves head and shoulders
Thanks for sharing!
Thanks Rayner. I always find your analysis insightful. I’m all for Naked Trading (No indicators). I trade based on the law of demand and supply. It works in every market.
Thanks for great information. Sometime I lost all profits without identify clearly the Trend Reversal.
HI
This is a very great full article for all small and big traders, Its shows your open heart full of sweetness.
Thank you lots
Hey Mohan,
You are most welcome!
Thanks, an awesome insight to trend reversal
Hi Ajout,
You are most welcome!
Thanks man I really appreciate your work it’s awesome we are loving it
Hi Clinton,
You are welcome!
Cheers.
Have been following your articles and it’s been so helpful. Thanks for the good work you’ve been putting out and helping us grow. yes I wish you could see my WhatsApp status I currently have your name on there thanking you. Thanks RAYNER
Hi Dav,
You are most welcome!
Cheers.
Hi Rayner. Just starting of this venture and I want to say thank you for the knowledge that you are sharing. May you be blessed.
Awesome, Faizel!
Love u sir i learn more thanks
You’re most welcome, Tahir!
Good and Genuine information! Thank you!
Very very useful information
Brother Rayner you are greatest person in trading system thanks sir
Thanks, Gulshan!
I am glad to know you find Rayner’s blog very useful!
Cheers!
I trade trend reversal, when candles in the trending move are getting relatively smaller, approaching area of support at a trendline in an uptrend.
You are a good teacher and mentor in this world of trading. I love reading your post
Thank you for sharing, Mohammed!
Does this also applies to crypto trading?
Hey there, Caleb!
Jarin here from TradingwithRayner Support Team.
Yes! As long as it has price action, it will work in crypto, too!
Hope that helps!
Trying to understand trend reversal. Can you take GE’s example now. Do you think that the current move is parabolic move and does that predict a trend reversal?
Thanks
What a sacrifice!!? Mr. Rayner, you are one out of a million. Thanks for all these teachings. I am following you bomper to bomper!
Thank you for always supporting TradingwithRayner!
Cheers!
Awesome indeed, RAYNER you are a MENTEE indeed
Thanks, Michael!
A break of the long term trend line is working for me and now my sole strategy. When price is consistently testing trend line for some time and suddenly breaks and form tight consolidation and give me reference point to place stop loss outside of the trendline, I take a short position and ride the new trend down to the point where the trendline started. If the trend line doesn’t break and price rather forms a range, I avoid the trade because it may break higher or lower.
Thank you for sharing your thoughts, Mohammed!
How I identify a reversal signal is by identifying the area of value and once the market gets to the area of value on my main time frame I always wait for the entry trigger and after that go to the lower timeframe of 4 to 6 factor to check for a change of structure then I have my confidence
Wow! Thank you for sharing, Iyanuoluwa!
Great job
Thanks, Felix!
Very clear and understable
Thanks, Rigoberth!
This lesson about how to trade trend reversal is like a Gold, you won’t find it anywhere thank you so much Rayner teo for showing me this strategy you will always be my mentor thanks
Thank you so much for your kind words! I’m really glad you found the lesson valuable.
Wishing you all the best!