The Donchian Channel indicator is powerful.
It’s like a Moving Average — on steroids.
Once you’ve learned the secrets, you’ll hit me on the head and say…
“Why didn’t you tell me earlier!?”
Because good things come to those who wait.
So here’s what you’ll learn today:
- What is a Donchian Channel and how does it work
- A common mistake to avoid when trading the Donchian Channel
- How to use the Donchian Channel and capture every trend — guaranteed
- How to scale in your winners and reap massive profits
- How to filter for high probability trading setups
- Donchian Channel strategy: How to use it and ride enormous trends
- Average True Range and Donchian Channel combo: How to catch EXPLOSIVE breakout trades consistently and profitably
Or if you prefer, you can watch this training video below…
What is a Donchian Channel and how does it work
Richard Donchian developed the Donchian Channel indicator (the pioneer of Trend Following).
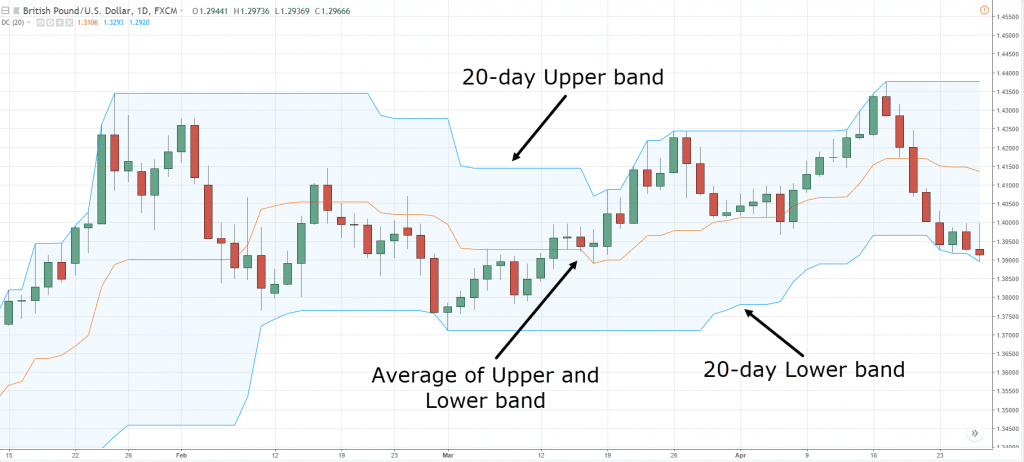
The Donchian Channel has 3 parts to it:
- Upper band – the 20-day high
- Middle band – the average of the Upper and Lower band
- Lower band – the 20-day low
Here’s how it looks like:
The Donchian Channel uses a default setting of 20-period, but you can adjust it to your preference (like 30-day, 50-day, etc.).
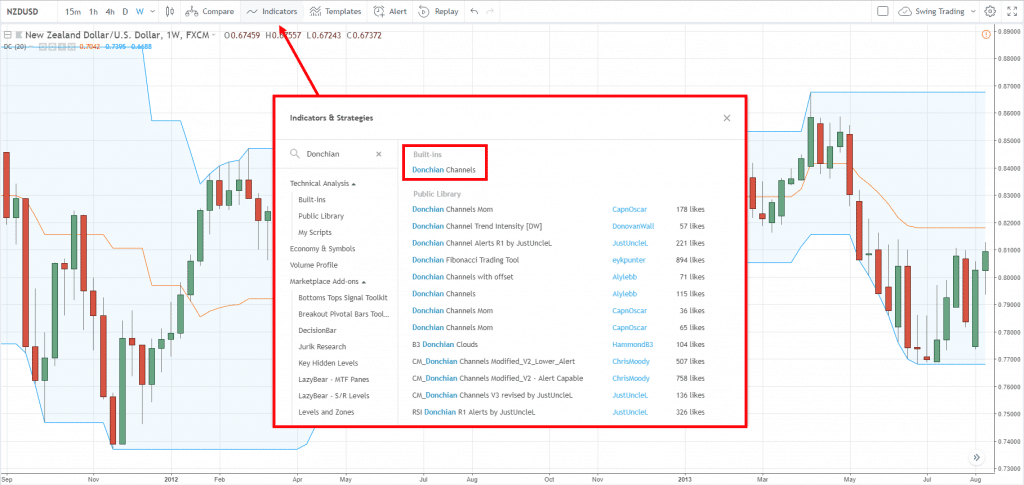
Quick Tip:
If you use TradingView, you can find it under the “Indicators” tab.
Don’t make this mistake when trading the Donchian Channel…
Here’s the thing:
Many traders make the mistake of “blindly” trading the bands.
They think if the price is at the upper band, it means the market is overbought and it’ll reverse lower.
So, they go short.
Big mistake!
Why?
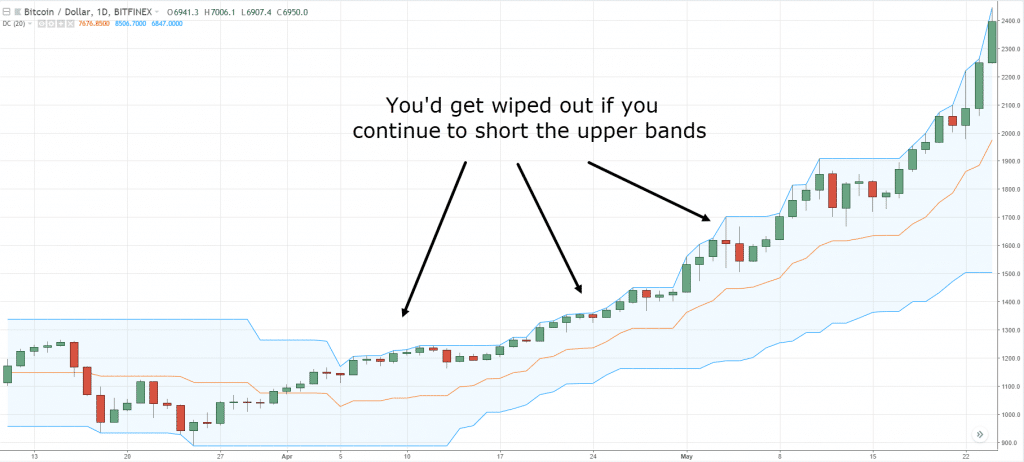
Because in an uptrend, the price will hug the upper bands for a long time.
Here’s an example:
Ouch.
So the lesson is this…
Don’t use the Donchian Channel indicator to identify overbought/oversold market conditions.
Instead, it’s better to use it to time your entries & exits which I’ll share more in the next section…
Donchian Channel Breakout: How to “catch” every trend in the market — guaranteed
Here’s the thing:
Most traders want to ride BIG trends.
And the strategy they use is:
- Wait for a pullback
- Wait for a better price
- Wait for the market to come to them
Is there a problem with this?
YES.
Because the market might not form a pullback — and you’ll miss the entire move.
So what’s the solution?
You must trade breakouts.
Think about it:
For a market to trend, it must break out higher.
So if you trade breakouts, you’ll catch every trend.
Does it make sense?
Great!
Here’s how you can do it…
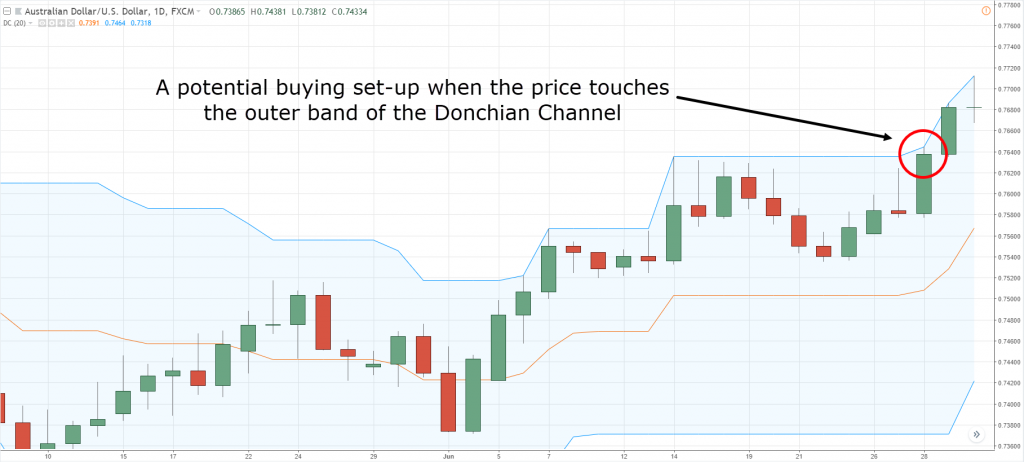
If the price “touches” the upper band of the Donchian Channel, you go long.
An example:
Now if you can do this consistently, you’ll catch every trend in the market — guaranteed.
Pro Tip:
You can adjust the Donchian Channel and trade the 50-day, 100-day or even 200-day breakout.
How to use the Donchian Channel to scale in your winners and reap massive profits
So, you’ve entered a trade and market moves in your favor.
Now what?
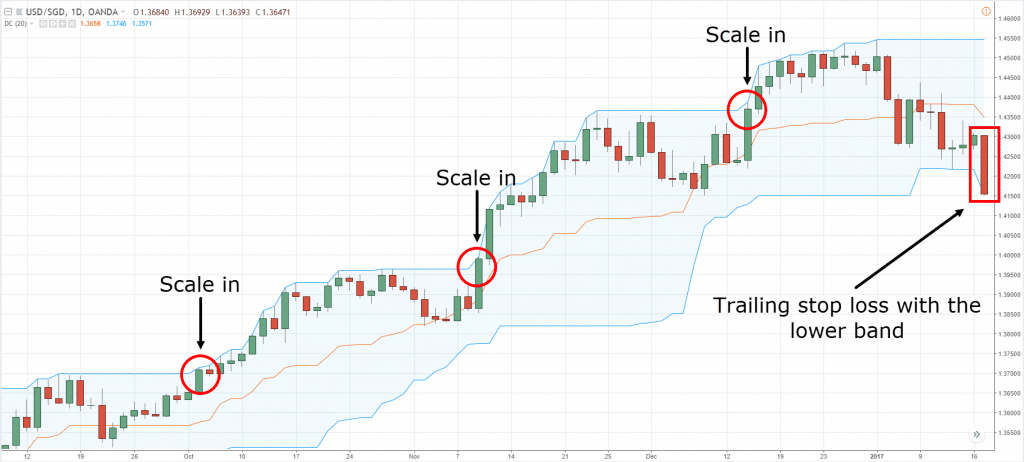
Well, you can scale in your trades.
This means you’ll add on to your winners so you can make even more profits.
Here’s how to use donchian channel with this advanced trade management technique…
1. Have open profits of at least 2R
Because if the market goes against you, you have a “buffer” to withstand the pullback.
If you have no open profits and you scale in your trade, you might lose more than intended.
2. Scale in your winners with reduced risk
Next, you can use the Donchian Channel breakout as an entry trigger.
Now, you don’t want to risk 1R on your later trades because you could lose all your open profits (when the market does a pullback).
Instead, scale in with 0.5R (or less), this lets you better withstand the pullback and still earn a larger profit if the market moves in your favor.
3. Determine your exit
Lastly, you must know where to exit your positions.
Will you exit all at once or treat each position as a new trade?
In my experience, it’s easier to exit all positions when your trailing stop is hit and then “restart” all over again.
Here’s an example:
Donchian Channel: How to use it and filter for high probability trades
Recall:
The middle band of the Donchian Channel is the average price of the Upper and Lower band.
This means you can use it as a trend filter to know whether you should be buying or selling.
Here’s how to do it with this Donchian Channel trading strategy:
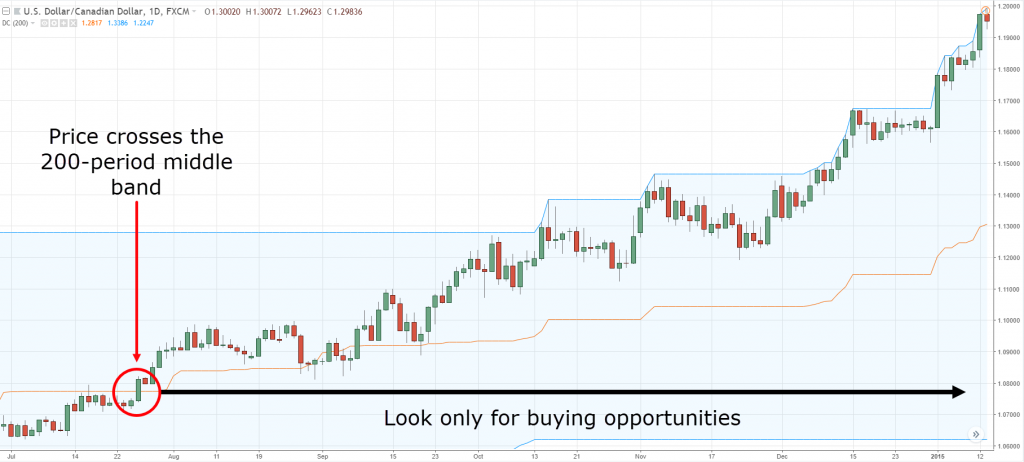
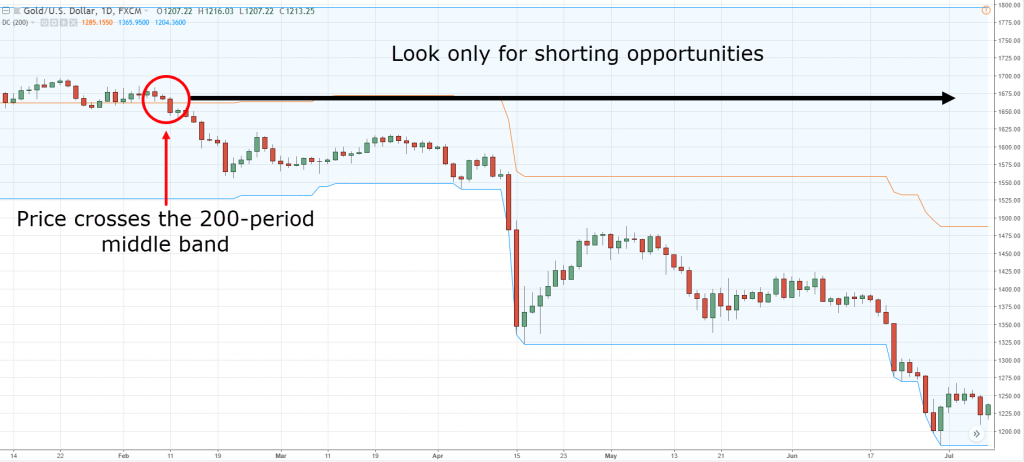
- Adjust the Donchian Channel to 200-period (to define the long-term trend)
- If the price is above the middle band, you look for buying opportunities
- If the price is below the middle band, you look for selling opportunities
Here’s an example…
Pro Tip:
If you trade stocks, apply the trend filter to the stock index.
For example: if you want to buy US stocks, check if the S&P 500 is above the 200-day Moving before you go long.
Donchian Channel strategy: How to use it and ride enormous trends
Here’s a fact:
To ride a massive trend in the markets, the kind that makes other traders go green with envy, then you must…
This means…
No target profits.
No second-guessing yourself.
No bailing out even when it feels “uncomfortable”.
You honor your trailing stop loss and get out when the signal tells you to.
Can you do it?
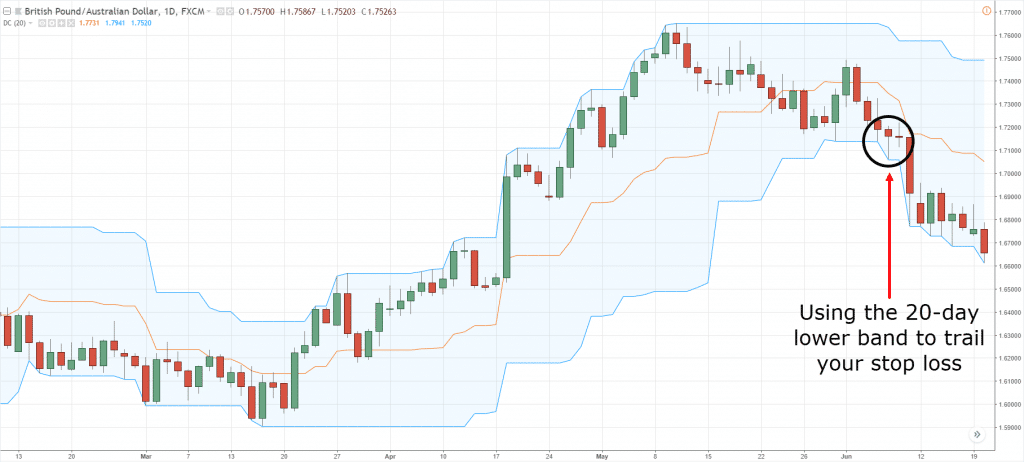
So, here’s how you can use the Donchian Channel to ride big trends:
- If you want to ride an uptrend, use the lower band (20-day low) to trail your stop loss
- If you want to ride a downtrend, use the upper band (20-day high) to trail your stop loss
Here’s an example:
Pro Tip:
To ride shorter or longer-term trends, simply adjust the settings on the Donchian Channel.
A higher value will ride a long-term trend and a lower value will ride the short-term trend.
Average True Range and Donchian Channel Combo: How to catch EXPLOSIVE breakout trades consistently and profitably
So how do you know when the market is about to have an EXPLOSIVE breakout — before it occurs?
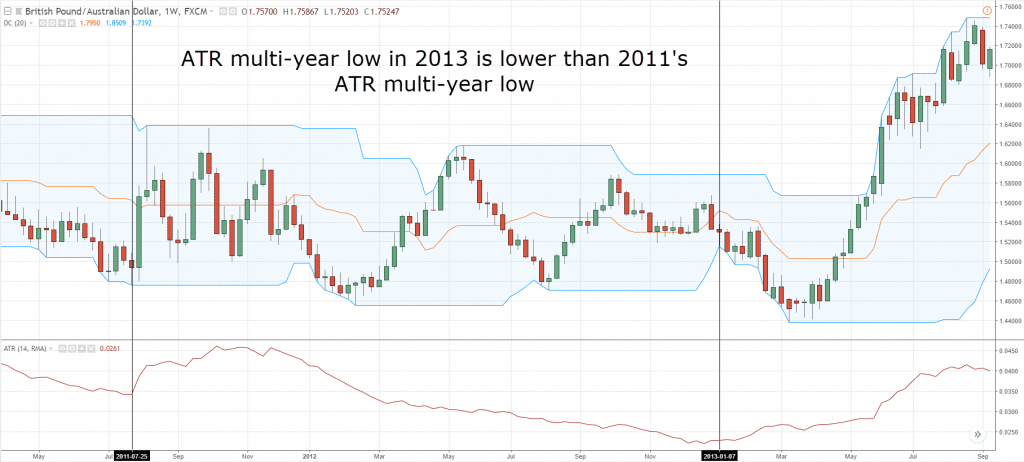
Step 1:
You use the Average True Range indicator (ATR) and identify multi-year low levels on the ATR indicator.
Ideally, you want it to be as low (or even lower) than the previous multi-year low.
Here’s an example:
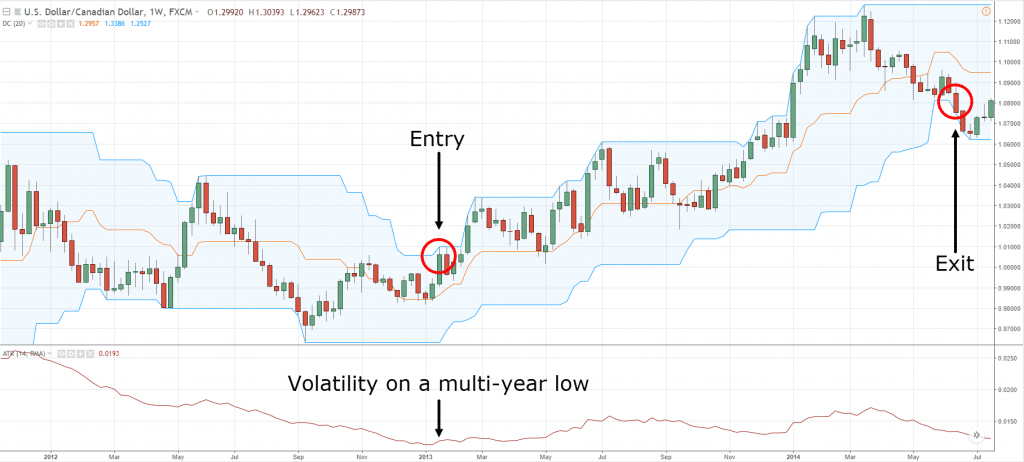
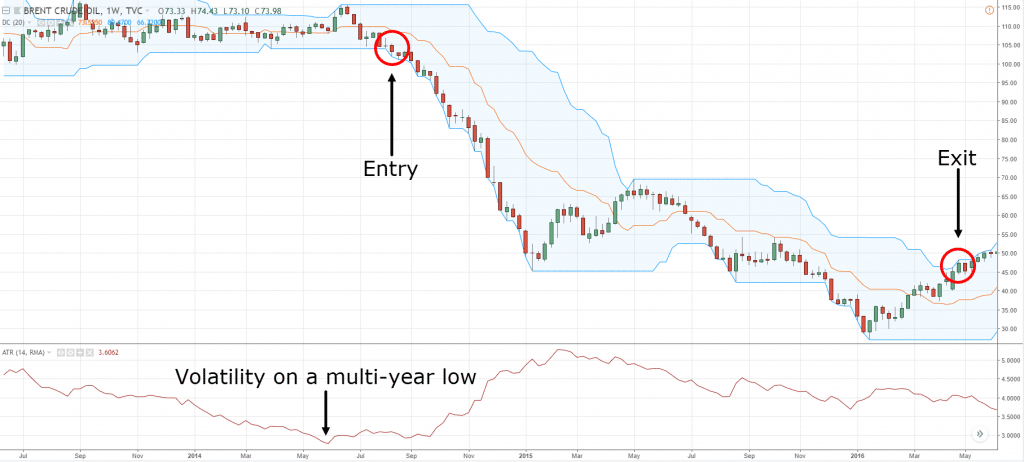
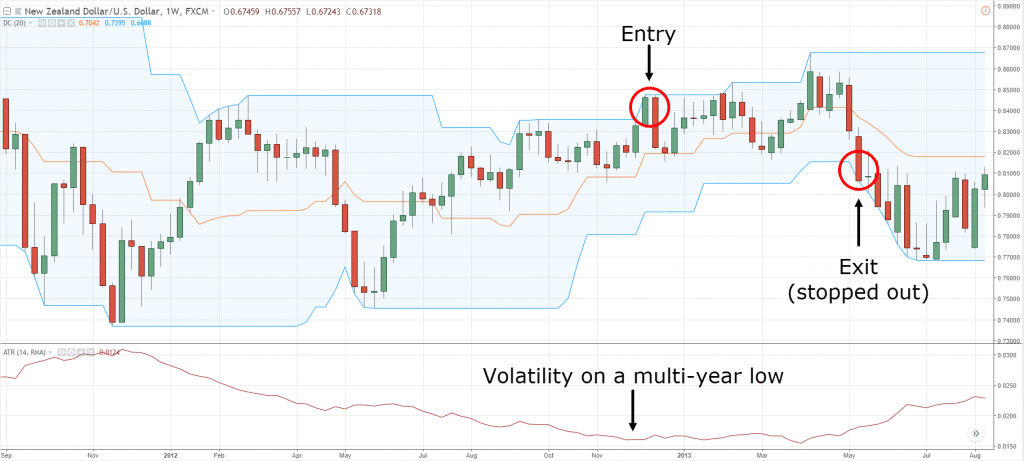
Step 2:
You trade the breakout of the Donchian Channel.
If the price breaks above the upper band (20-week high), you go long.
If the price breaks below the lower band (20-week low), you go short.
Here are a few examples…
Now…
The idea behind it is the market moves from a period of low volatility to high volatility.
So the ATR indicator helps you identify periods of low volatility and the Donchian Channel lets you trade the breakout to capture the move.
This Donchian Channel trading strategy is pretty powerful, right?
Frequently asked questions
#1: In the Donchian Channel Breakout, I don’t see the price breaking out of the channel, it only touches the top or bottom channels and then the Donchian Channel adjusts to the price change. Can you explain where the breakout is?
Let’s say the blue upper line of the Donchian Channel is plotting the 200-day high of the market. So if the price touches it, this means the price has broken out of the 200-day high.
Conversely, if the price has touched the blue lower line, this means the price has broken down from the 200-day low.
#2: What’s the difference between the Bollinger Bands and the Donchian Channel?
Bollinger Bands take into account the volatility of the markets and it adjusts accordingly. If you want to discover more about Bollinger Bands, you can read my blog post here.
Whereas, the Donchian Channel is fixed based on a period’s highs or lows. If you’re using a 200-period Donchian Channel, then it plots the highs and lows of the last 200 periods.
#3: Could you explain what ‘R’ stands for?
‘R’ simply tracks your returns relative to the risk that you’re taking. For instance, if you risked $10 and you earn $50, you’ve gained 5R.
Conclusion
So here’s what you’ve learned:
- The Donchian Channel is a Trend Following indicator
- You can long breakouts when the price breaks above the upper band
- If the price is above the middle band, have a long bias so you can trade with the trend
- You can ride a trend by trailing your stop loss on the outer bands
- The ATR and Donchian Channel combo helps you catch explosive breakout trades before everyone else
Now here’s a question for you…
How do you use the Donchian Channel indicator?
Leave a comment below and share your thoughts with me.


Thank you Mr. Rayner
All your tips are precious.
Yet obviosly, the DC/ATR combo tip is an unique guiding light.
You’re welcome!
Hi Rayner
Great to get you also on telegram. Hope to continue to learn from you.
Regards
Eddie Tay
Cheers Eddie!
Great Job As Usual Rayner ,Thanks MATE.
Could You Give More İnformation And Examples For İbtraday Trades and Short Term Options ,Please
Thanks For Your Support And Assistance
All Best…
Does it also works like bollinger bands
Thanks Rayner…
Can you suggest how do we avoid false breakout? Typically I have seen 50% or more false breakout. So win rate is low. If you lucky and manage to ride trend and add up positions then you will be in profit despite of low win rate. However, not every pair is in a long trend in a year, so at the end of year not sure whether you in profit or loss.
Please comment…
Thanks for good work…
This will help… https://www.youtube.com/watch?v=3hcrDDqRnq4
Thank you! Great stuff!
Welcome!
Thank you so much for this lesson sir! More power and God bless!
Cheers Val
Hi Rayner,
Thank you for this information. I can’t wait to use it. It looks so powerful.
Have a go and let me know how it works out for you.
Hi,
When you say a breakout of the channel, I don’t see the price breaking out of the channel, it touches either the top or bottom line and the channel adjusts to it (unlike for instance Bollinger Bands where you can see a clear breakout of price from the bands) Kindly do explain a bit more on that as I can see no breakout
You have to draw an imaginary horizontal line from previous outer band, then you”ll see what breakout is.
It’ll never break and close above the Donchian channel because those are the highs/lows that are being marked.
When I mean breakout, it’s the break of the previous high.
In layman terms, if the highs on your Donchian Channel has moved, it means the price has broken out.
Thanks. Fully understand now
Hi Rayner
So what is the major difference to the Bollinger Bands, looks very similar with similar strategies?
Bollinger Bands calculate using standard deviation whereas DC uses the previous high/low.
hi Rayner I was listening to a webinar by an American speaker who said do not use any indicators in trading he calls it the big lie as indicators are 50 years old and so out dated and lag so far behind you will always lose every trade he said only trade the money makers I would like to known your view; and is this American right
That’s his own beliefs and not everyone will agree, that’s why we have a market.
Hi Rayner,
Thank you once again for your precious tip.
1. Is this indicator useful for stock trading or only for FX trading?
2. I checked thinkor swim platform and there is no Donchian channel indicator.
The concepts can be applied to any market.
thank you sir!
welcome!
hi rayner,
Does this only works for long period like day chart? i just tried using this on a 15 min chart, it is not clear.
The concepts can be applied the same.
This dorchian channel adds a new definition to Bollinger bands don’t you think? And besides do you have any videos that explain risk and reward as I’m not very familiar with it.
Thanks though, I hope to one day help people the way you are helping others.
Check this out… https://www.tradingwithrayner.com/risk-reward-ratio/
Rayner – great stuff as usual
but please, please DON’T use “right” EVERY OTHER WORD
it’s not cool.. (past the age of 5)
cheers
I’m Emmanuel and I trade with iq options but sadly the indicator is not available. Can you advise a platform.
I don’t trade with IQ options. Try Tradingview.
Hi Rayner,
Thanks for the tips. I use the 200 period middle Donchian line as a filter as you suggest and enter on a 20 period Donchian, exit on a 10 period Donchian. I add up on every pullback (flat lines), securing on breakevens.
Thank you for sharing, Pablo.
Hi Pablo,
Do you use it with the same time frames for 200, 20 & 10 period ?
Hello Rayner,
I went to thank you for your wonderful teaching so far..I have enjoyed every bit of your teaching since I got to know you.
Please, concerning the DC setting .. Would the upper band and lower band set differently 20days ..and including the middle line 200days… Please, try to throw more light. Thank you
I don’t understand your question. Could you explain?
Hi rayner
Can you please make a video on this for more clarity.
Thanx in advance
The video is right at the top of the post.
Hi Rayner
Can you share more about scale in your winners?
Does it means that for my first trade is at 1%, but everytime I scale in I buy in another 0.5%? Is that right?
Thanks!
I suggest lesser than that, possibly 0.3% or less.
Thanks Rayner!
Welcome!
hello rayner, if i use DC 200 period to determine the long term trend on a 1 hour time chart, and DC 20 period to look for buy/sell opportunities on the 1 hour time chart too, correct?
Or should I use DC 200 period on the 1 day time chart to determine the long term trend, and use DC 20 period on the lower time frame of the 4 hours time chart to look for buying/selling opportunities?
Thanking you in advance!
It depends on your own trading style.
If you trade off the higher timeframes like Daily, then you should refer to the timeframe.
You must define what’s your trading timeframe first before anything else.
hello rayner thanks for your reply. so if i trade only on a single time frame, would it be okay if i use DC 200 period & DC 20 period on the same 1 hour time frame? Thanks again!
I can’t say for sure. You’ve got to develop a plan, test it, and verify it yourself.
I am at a loss how to set the trailing stop in the MT4 to stop me out when the price comes from one DC band to the other. How do I set this?
Thanks for your excellent presentation of the DC
You might want to check with MT4 for it.
Hi Ryan.. Thanks for all your hard work & efforts to help the entire community across the globe. Today, my question is that i trade in BTC & all other Alt coins (Crypto).Will it be ok to trade on a timeframe of 1hr, 30mins & 15 mins with DC indicator?
There’s no best indicator for any market or timeframe.
If the indicator meets your purpose, then use it. Or else, leave it.
Hi Ryan.. Thanks for all your hard work & efforts to help the entire community across the globe.
I have not seen other than you till now who help other free.
Salute to your thoughts.
I appreciate your kind words, Keshav!
Will it work for indian share market as well??
The concepts can work the same.
Hello Rayner,
Thanks for all you do.
When using the Donchian middle band and price to determine the trend, in other to know whether to go long or short, what do we use to identify a potential reversal of the market?
For example, price may be above the middle band, meaning we should be looking for long setups on the entry time frame.
However, if a reversal were to happen at some point, before going long, where would be the likely places or time frames to spot it; so that we may either wait for confirmation or probably do a scalp trade?
Cheers.
This video will help… https://www.youtube.com/watch?v=aWN5oeVWA2A
Hi Raynar,
Two questions:
– When you say 1R and 2R, what does the R refer to?
– If you set your stop loss at the lower band of the Donchian Channel, does that mean that a pullout or bull flag on an uptrend should never go lower than the 20 day low price?.
Thanks!
Danny
Hey Danny
1. If your stop loss is 100 pips and you made 200 pips, that’s 2R (200/100)
2. If you used the default settings, then the low of the Donchian Channel is the 20-day low.
Wow! This stuff is really amazing,thank you so much Rayner,
My pleasure!
From what I was taught, once price touches either the of the bands tells me where the trend is heading. I found it not working for me but, your explanation of how to adjust and filter, makes it appreciated. Thanks Rayner for being there for people like us. More grease to your elbow.
You’re welcome, Brine!
Hi Mate, does this work in choppy markets like BTC and on shorter time frames like 30 mins / 5 mins etc? I had a few good breakout trades with it but its hard to judge because the previous high or low band is sometimes 100s of dollars away so it can be difficult to see a break. See the last 2 weeks in bitcoin for what I am referring to.
Remain blessed sir.
You are a wonder teacher!
Thanks.
Wonderful teaching!
Many thanks.
Cheers
realy, this is it,…, Rayner you are the best, it works for me, for sometimes, not allways,…., and I love you for everything you give, and my wife loves you too every time I win a trade,……., Franci
Awesome to hear that!
Really great stuff, a million thanks
My pleasure!
I will start practicing it today so that tomorrow i trade using donchain indicator. I haven’t made any profit in forex i need your help Mr Rayner?
do you have a file dochian channel.mq4?? I don’t find files that are like yours.
You are magnanimous.
Cheers
I salute you Mr.Rayner, you have laid an entire strategy, with an in depth explanation. I have just switched to The Donchian Channel after using Bollinger Bands since I started, and I have been backtesting with my other indicators with some pretty good results. I am profitable nowadays, but I think implementing is really going to help me take off. I owe you a drink!
Awesome to hear that, Matthew!
Thank you very much sir.this is very educative and imparting.
My pleasure!
Oh,Rayner It’s wonderful to come in contact with your tutorials”Amazing”.Thanks alot. please can you send me more highlights on how to use Donchain Channel?. I love you, keep it up.
Hello Rayner,
could you kindly explain what ‘R’ stands for?
Thank you!
If you risk $10 and earn $50, that’s a gain of 5R.
To track how much you earn relative to the risk you’re taking. Similar to risk reward ratio.
Thank you Rayner!
So far these are the best brain food for me as an aspiring trader.
I have gained tremendous insights even just from this first encounter , and from now on, you will be my idol!
Cheers bud
What is more accurate for breakouts the emas or donchian or is there not much difference?
Hi Rayner,
Thanks for useful knowledge.
I turned into profitable trader after going through your knowledge series.
I could not join your PAT course, due to lack sufficient funds.
I would like to know what is diference between Donchian and bollinger band?
Regards
Suhas
You can read more about Bollinger Bands here… https://www.tradingwithrayner.com/bollinger-bands-trading-strategy/
Hi Rayner, Thanks for the heads up.
Hello Rayner, thank you for the teachings and exposure. About the Donchian Channel, we don’t have donchian indicator on MT4, so how one access it?
You can get it here… https://www.tradingwithrayner.com/mt4-indicators/
Would be much appreciated if you could extend the Donchain Channel indicator to me. I am using MT4 in windows. I remember you previously forwarded 3 indicators, Donchain Channel included, but could not find the files. Please and thanking you in advance.
You can get it here… https://www.tradingwithrayner.com/mt4-indicators/
You just slapped me on the face with a million dollar note! Thanks
Cheers
Hi Rayner,
Thanx so much for sharing us this very useful guide. May our good Lord will bless u more with wisdom & understanding.
Is this applicable also to forex & commodity?
Hey Noel
The concepts and principles can be applied to it.
hi what is the best timeframe here?
Hey Rayner. Oh Man. Why didn’t you tell me earlier!? 🙂
Thank you millions Rayner. The ONLY true online coach cleanly, professionally and of cause providing well organized information. I know what you do is not easy. Thank You once again Rayner. One day I will see you and say Hi. 😀
Hey Ushan,
You are most welcome!
Great job! One question. You know it is important to diversify when using trend following strategies. Would you recommend always using the same Donchian settings (20,50 …). Or would you find the best one per asset class?
Would appreciate an answer so much. I am struggling with this.
Thanks! 🙂
Hi Rayner,
Great teaching, all the best for yor good work.
Regards,
Santhosh
Hi Santosh,
You are most welcome!
Please is the donchian channel indicator on the mt4 application
Hey there, Wilson!
Yes. mt4 has a Donchian channel indicator, too!
how do i use ATR ?
Hi, Brainy!
You might find the article below helpful:
https://www.tradingwithrayner.com/atr-indicator/
Hope this helps!