
Have you ever placed a trade, only to find the market went nowhere?
Or jumped into what looked like a strong trend… just to see it reverse?
Understanding whether a market is ranging or trending can make or break your trading strategy.
These two conditions behave completely differently, and if you’re taking the wrong approach in the wrong environment, even a good setup can quickly fall apart.
Some traders excel in fast-moving trends.
Others thrive in sideways price action.
But what separates successful traders from the rest is correctly working out the market type and adapting accordingly!
In this article, I’ll break down exactly how to spot the difference between range-bound and trending markets, show you how to trade each one effectively and guide you through real chart examples that bring these concepts to life.
Here’s what you’ll cover:
- What defines a range-bound market, and how to trade inside key levels
- What makes a trending market, and how to trade with momentum
- Common mistakes traders make in both conditions and how to avoid them
- Key indicators and tools to help identify market type with confidence
- How to shift gears when the market transitions from range to trend (or vice versa)
- A combined approach: using both strategies in real-world trading
By the end, you’ll have a clearer understanding of how to work with any market condition and the tools to take your trades with more confidence and consistency.
Let’s dive in!
Range vs Trending Market: What Is A Range-Bound Market?
Definition
So you might be asking, what exactly is a range-bound market, and how can I identify it?
Let’s take a look at the definition first:
A range-bound market occurs when an asset’s price moves within a defined horizontal range, bouncing between established high and low points without forming a clear upward or downward trend.
So, unlike trending markets, where prices consistently rise or fall, range-bound conditions create a repetitive cycle of buying and selling within the set boundaries.
Now, you probably know these boundaries as support and resistance levels, right?
Support is the price level where demand stops further price decline, and resistance is where selling pressure caps any upward movement.
Characteristics
One of the key aspects of a range-bound market is that there is no dominant trend.
Prices may move within a quite narrow range for longer periods, creating a sideways price pattern on charts.
This type of market behavior typically means investors are uncertain (as a group), with neither buyers nor sellers having enough control to push the price in a certain direction for long.
During these phases, volatility is often lower compared to trending markets, and price movements tend to be more predictable within the defined range.
Why do they occur?
Let’s dig a bit deeper.
I like to think of range markets occurring in three scenarios.
At the end of an uptrend, at the end of a downtrend, or when the price is taking a brief pause during a trend.
These ranges can occur in all timeframes.
But why do they happen at all?
Well, investors may be waiting for new economic data, earnings reports, or political developments before they commit to a new trend.
Other times, uncertainty in the broader market can lead to price stagnation, as traders stay cautious and reluctant to take significant positions.
There might even be external factors like central bank policies, industry-specific news, or changes in market sentiment that can also contribute to longer periods of sideways movement.
Remember to think of the range as a time of indecision – a bit like a tug-of-war between bulls and bears where the balance is evenly matched.
Let’s take a look at a ranging market example on a chart, so you can see what it may look like…
USD/CAD 1-hour Chart Range Example:
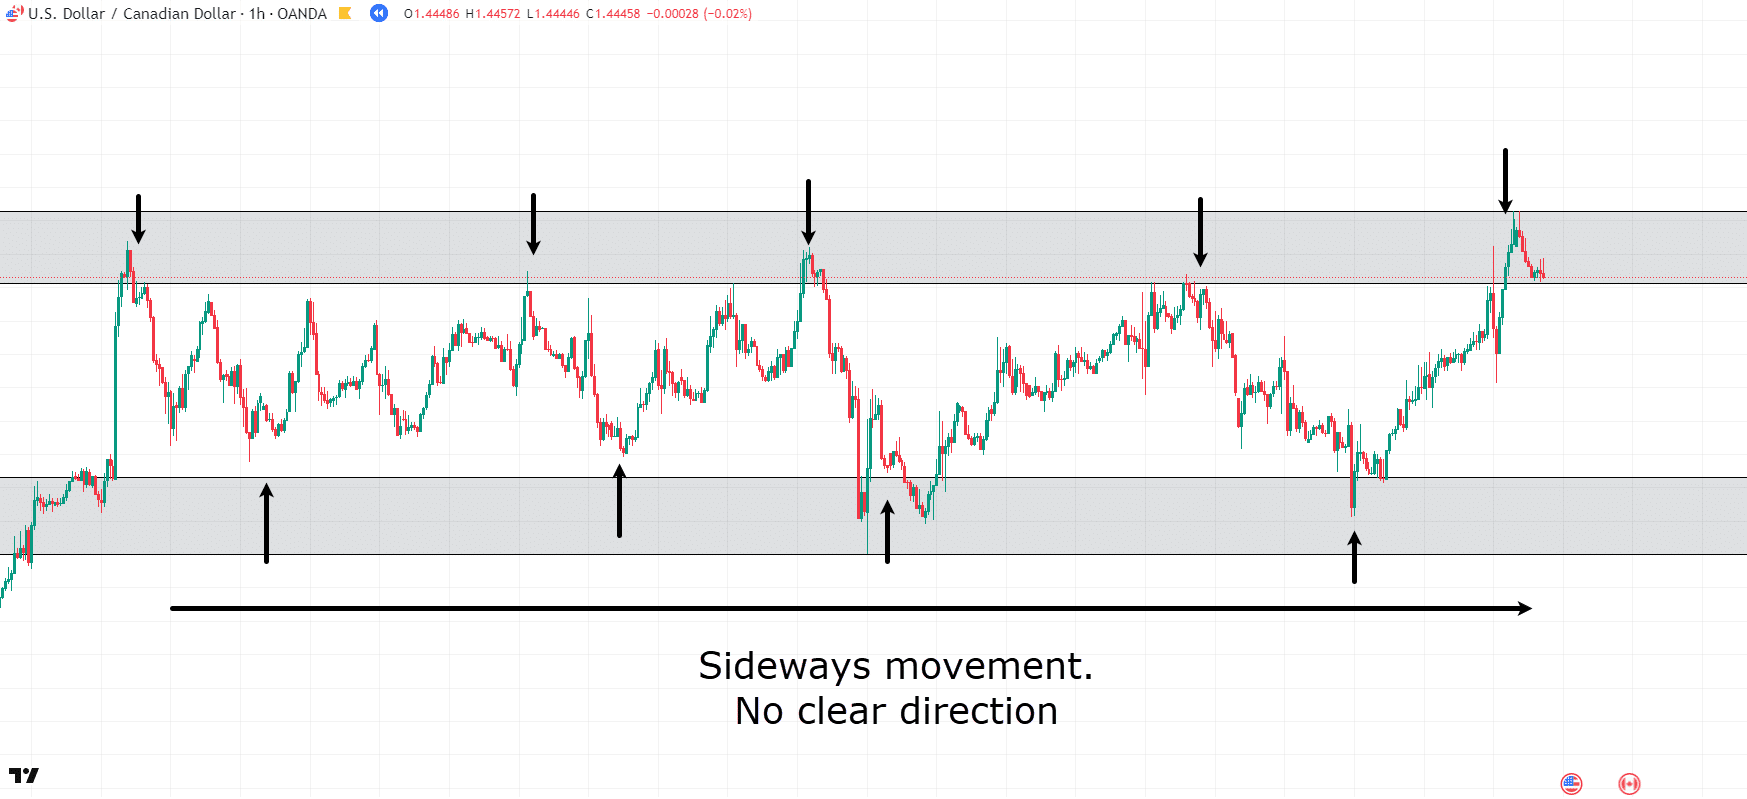
See how there is no clear direction during this period on the chart?
Every time it reaches the extreme, there’s a brief pause and then… reversal.
I will go into more detail on how to actually trade these markets later on – hold tight.
For now, let’s touch on some common mistakes I see traders make.
Range vs Trending Market: Common Mistakes in Range-Bound Markets
Trading within a range may seem simple on the surface, but there are plenty of ways it can go wrong if you’re not careful.
Range Boundaries
One of the most common mistakes I see traders make is misjudging the boundaries of a range.
Markets might seem to be ranging, only for the price to quickly plough through what looked like a support or resistance level.
Acting too soon before levels have been truly confirmed can result in poorly timed trades and repeated stop-outs.
To avoid this, I like to always look at the extreme edges of the range.
That’s not to say you have to place an entry on the extreme, but at least be aware that the price might use that extreme boundary as the edge of its range.
Context Matters
Another common pitfall is ignoring the context.
Just because the price has been moving sideways for a while doesn’t mean it will continue to do so!
I see traders often get caught off guard by breakouts that occur after extended consolidation, especially if they haven’t accounted for signs of rising volume or shifts in volatility.
What was once a reliable range can suddenly become the launchpad for a new trend, and traders still treating it like a range can find themselves on the wrong side of the move.
Pay attention to volume shifts – what I like to call a build-up near support – or resistance where price tends to linger near the extremes of the range.
These are good indicators that price may soon break out.
Overtrading
Finally, there’s the issue of overtrading.
Ranges can encourage a sense of rhythm of buying low, selling high, but this can lure traders into forcing trades that aren’t high probability setups.
Not every touch of support or resistance is worth trading, especially if momentum or volume doesn’t support the move.
Although ranges do provide these setups, make sure that you are trading the range sensibly, with stop losses that make sense, rather than rushing into a trade that forces you to neglect your stop loss placement.
Great. Now that you know the common mistakes, let’s look at some indicators that can assist you in your trading!
Range vs Trending Market: Indicators That Help With a Range-Bound Market
Successfully navigating range-bound markets often comes down to clarity and everyone’s favorite… patience!
Obviously, this is easier said than done, so the right indicators can help with both.
Relative Strength Index (RSI)
A good starting point is horizontal support and resistance levels.
Manually plotting these zones where prices have repeatedly reversed gives you the framework for where buyers and sellers will likely step in again.
From there, the Relative Strength Index (RSI) can be especially useful.
In a trending market, RSI tends to stay in overbought or oversold territory for extended periods.
But in a ranging market, it behaves differently, moving more predictably between the extremes.
When RSI approaches 70 or 30 within a range, it can signal potential reversal points, especially if those levels align with horizontal support or resistance.
Volume
As mentioned before, volume can also be very important.
Ranges often form during periods of low volume or consolidation after a strong move.
So, watching how volume behaves near the edges of the range can help you understand whether a breakout is likely.
For instance, an increase in volume at a resistance level could hint that buyers are preparing to push price higher, rather than just respecting the range again.
Bollinger Bands
Some traders also use Bollinger Bands in a sideways market, as they contract during low-volatility phases, which can highlight consolidation.
Price bouncing between the upper and lower bands in a tight range can create clean trade setups when combined with other signals like RSI or price action.
Something to always remember is that no single indicator will tell you everything…
But combining a few key tools like RSI, volume, and support/resistance zones can give a clearer picture of what’s happening inside the range and help you avoid these common traps.
So, now you have a better understanding of ranging markets, let’s dive into trending markets!
Range vs Trending Market: What is a Trending Market?
Definition
To me, a trending market is one where price moves consistently in one direction.
This can be either up or down over a sustained period.
Remember how prices bounced between fixed levels in the ranging market?
In trending markets, the market shows a clear bias, building momentum as buyers or sellers take control.
Try to think of an uptrend as a sequence of higher highs and higher lows, while a downtrend forms through lower highs and lower lows.
The key difference is that the market isn’t moving sideways; it’s progressing in a direction with some level of persistence.
How do you recognize a trending market?
Well, this might be up for debate, but I always say…
…if it isn’t obvious, then it probably isn’t what you are looking for!
To help you visualize it better, though, let’s take a deeper look at the trending market characteristics.
Characteristics
Trending markets tend to have a sense of rhythm, even if they’re not always smooth.
In an uptrend, you’ll often see impulsive bullish moves followed by short pullbacks before the price pushes higher again.
These retracements are natural and an important part of the trend.
They allow the market to “breathe” before continuing.
Downtrends follow a similar structure, but in reverse: sharp downward moves followed by smaller rallies.
Trending markets can last for days, weeks, or even months, depending on the timeframe and context.
You will often find them after periods of consolidation, but they can be influenced by a range of factors, from economic news and interest rate changes to earnings reports and market sentiment.
But is there any particular reason a trend might form instead of a ranging market?
Let’s take a look!
Why Trends Form
Trends form when there’s a continual imbalance between supply and demand.
In an uptrend, demand outweighs supply, which means more people are buying than selling, driving prices higher.
The opposite is true in a downtrend: sellers are in control, and buyers aren’t willing to step in at higher prices.
This imbalance can be triggered by all kinds of things, such as changes in the economic outlook, shifts in interest rates, geopolitical events, or even strong earnings reports.
However, trends can also be sustained by market psychology.
Once traders recognize that a market is trending, more participants tend to follow the momentum, reinforcing the move and pushing prices further in the same direction.
This self-reinforcing nature of trends is why they can persist for so long even without new fundamental developments.
Let’s look at an example of a clear trend…
AUD/JPY 1-Hour Chart Downtrend:
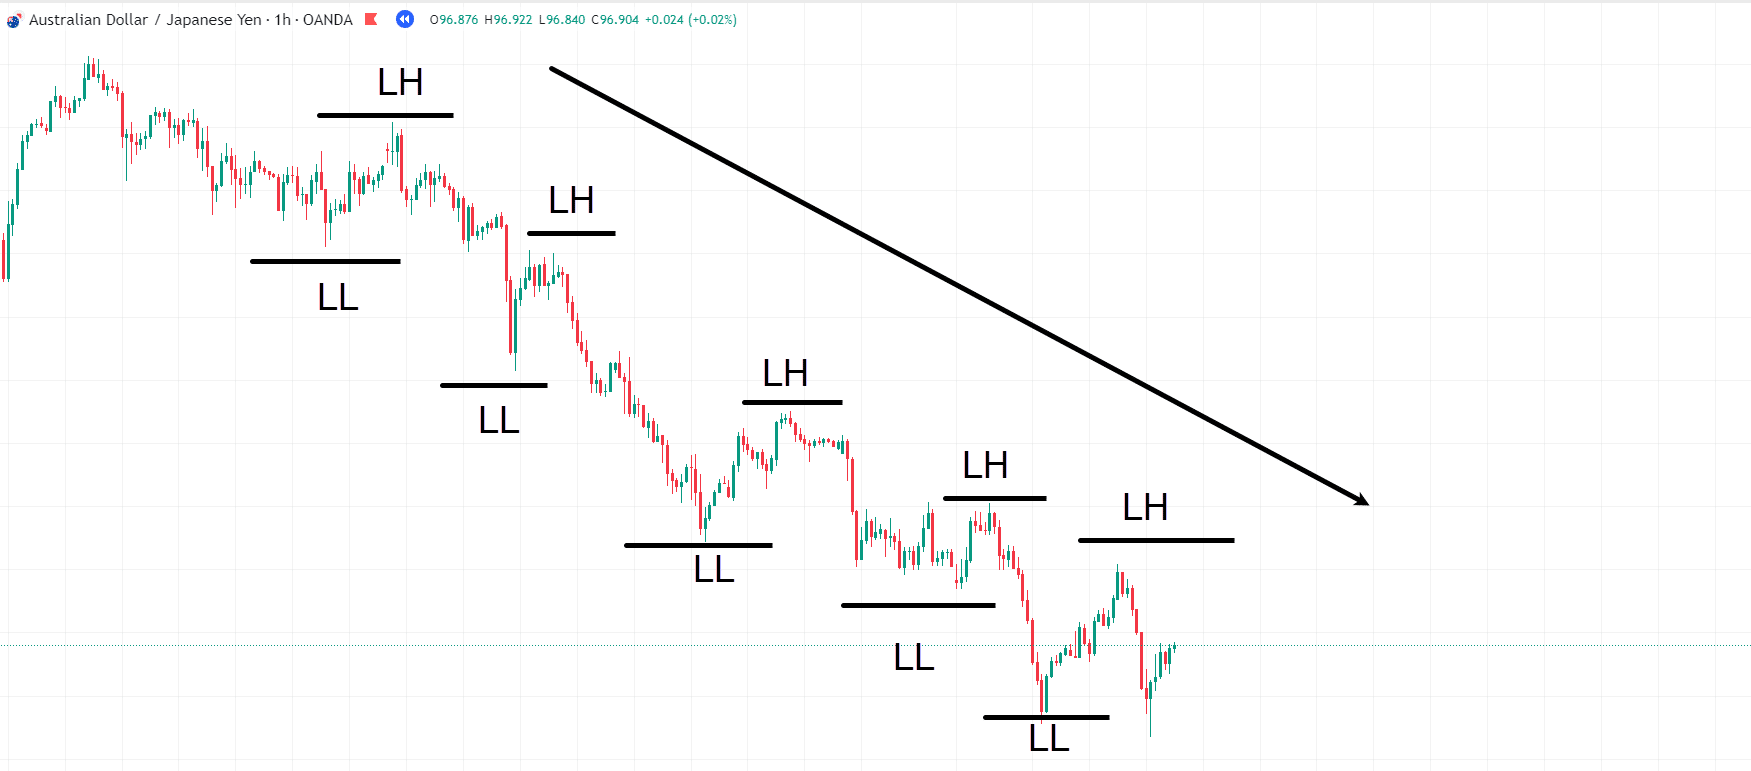
As you can see, the price forms lower highs and lower lows, forming a clear downtrend.
Seems simple enough, right?
But let’s take a look at some common mistakes I see traders make with these…
Range vs Trending Market: Common Mistakes in Trend Trading
Chasing Price
One of the biggest mistakes I see traders make in trending markets is what I call chasing price.
Seeing a strong move, it’s easy to get FOMO and jump in too late, that is, right before a pullback or even a reversal.
Entering impulsively, without a plan or confirmation, can easily leave you buying the top or selling the bottom.
This is a difficult thing to master, but once you understand the flow of trends, you’ll be much better at timing your entries and maintaining a sensible risk structure.
Short Term Trend
Another issue is failing to distinguish between a trend and a short-term fluctuation.
Just because the price is moving up or down for a day doesn’t mean a trend has formed.
Some traders misread temporary volatility or news-driven spikes as trend signals and get caught out when the price snaps back.
The obvious way to avoid this is by being very aware of news events or any earnings reports that may be having an effect on market conditions.
Taking Profits
One last major mistake I see traders make is that they often exit too early out of fear of losing profits.
Ironically, one of the biggest advantages of a trend is the ability to let winners run, but only if you manage risk and trust the structure.
Exiting too early or constantly second-guessing your position can lead to missed opportunities, especially if you had some losing trades trying to catch the start of the trend.
I like to think of this as making sure you are getting paid for being right about a trend.
In that regard, let’s look at some helpful indicators.
Range vs Trending Market: Identifying Trends – Trend Indicators
As mentioned before, there are several ways to identify trends, and one of the most reliable is through price structure itself:
– higher highs and higher lows in an uptrend or
– lower highs and lower lows in a downtrend.
But indicators can help support what the price is already telling you.
Moving Averages
Moving averages are widely used for this purpose.
A rising 50-day or 200-day moving average can indicate an established uptrend, while a falling one suggests a downtrend.
When the price stays above a moving average, it’s often a sign that buyers are in control.
On the other hand, when it stays below, sellers are likely dominating.
Crossovers, like when the 50-day crosses above the 200-day (a “golden cross”), can also signal trend shifts.
Average Direction Index
Less common but just as helpful, I present the Average Directional Index (ADX).
This tool doesn’t tell you the direction of the trend, but rather how strong it is.
A rising ADX above 20 or 25 can confirm that a trend has momentum behind it, whether it’s bullish or bearish.
Trendlines
Other traders watch trendlines, drawing them across the swing lows in an uptrend or swing highs in a downtrend.
As long as these lines are respected and volume supports the move, the trend is often considered healthy.
Ultimately, successful trend trading comes down to confirmation, patience, and not trying to force trades in uncertain conditions.
When used together, price action and indicators can give you a solid framework for recognizing and staying with the trend without getting shaken out too early.
Okay, so now all the groundwork is put in, let’s discuss how to actually use these in your trading strategies!
Range vs Trending Market: How to Trade Ranging Markets
Let’s start with the range markets.
As mentioned previously, trading ranging markets needs to be approached entirely differently from trending markets.
The first step? Identify a range.
This just means finding a chart where price is moving between two points and reversing without breaking in any sort of clear direction.
Remember, the more obvious it is, the better chance you’ll have at success.
If it isn’t clear, just move on to another chart or adjust your strategy depending on what you have in front of you…
AUD/USD 1-Hour Chart Range:
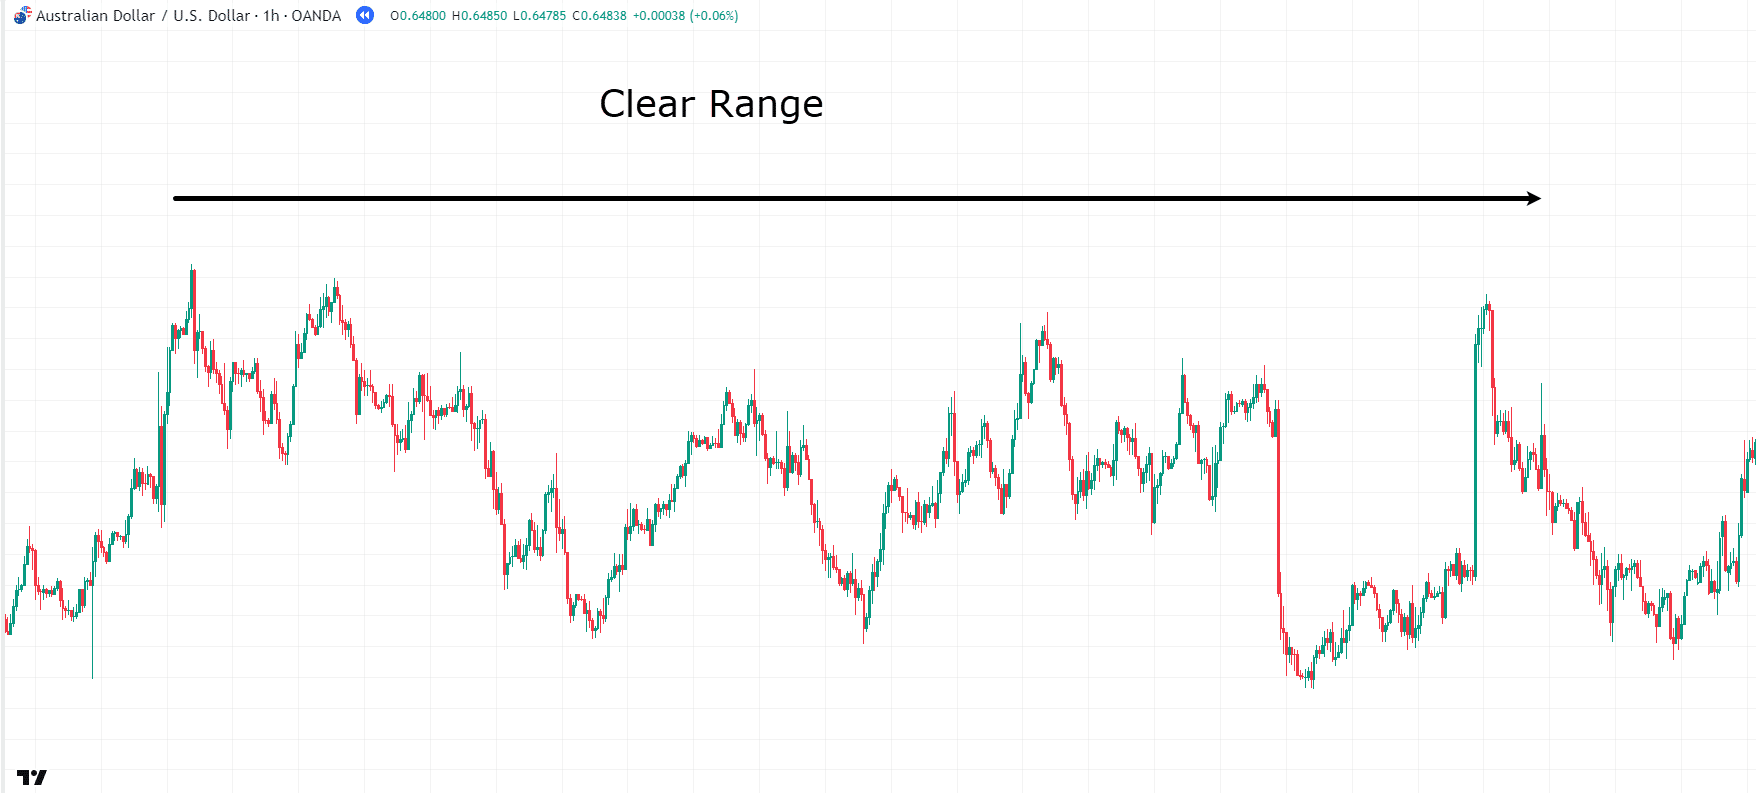
There is no doubt that price is moving within the boundaries of the highs and lows here.
So, how would you trade this range, and would it be so obvious early on?
Well, let’s go back a bit…
AUD/USD 1-Hour Chart Range Forming:
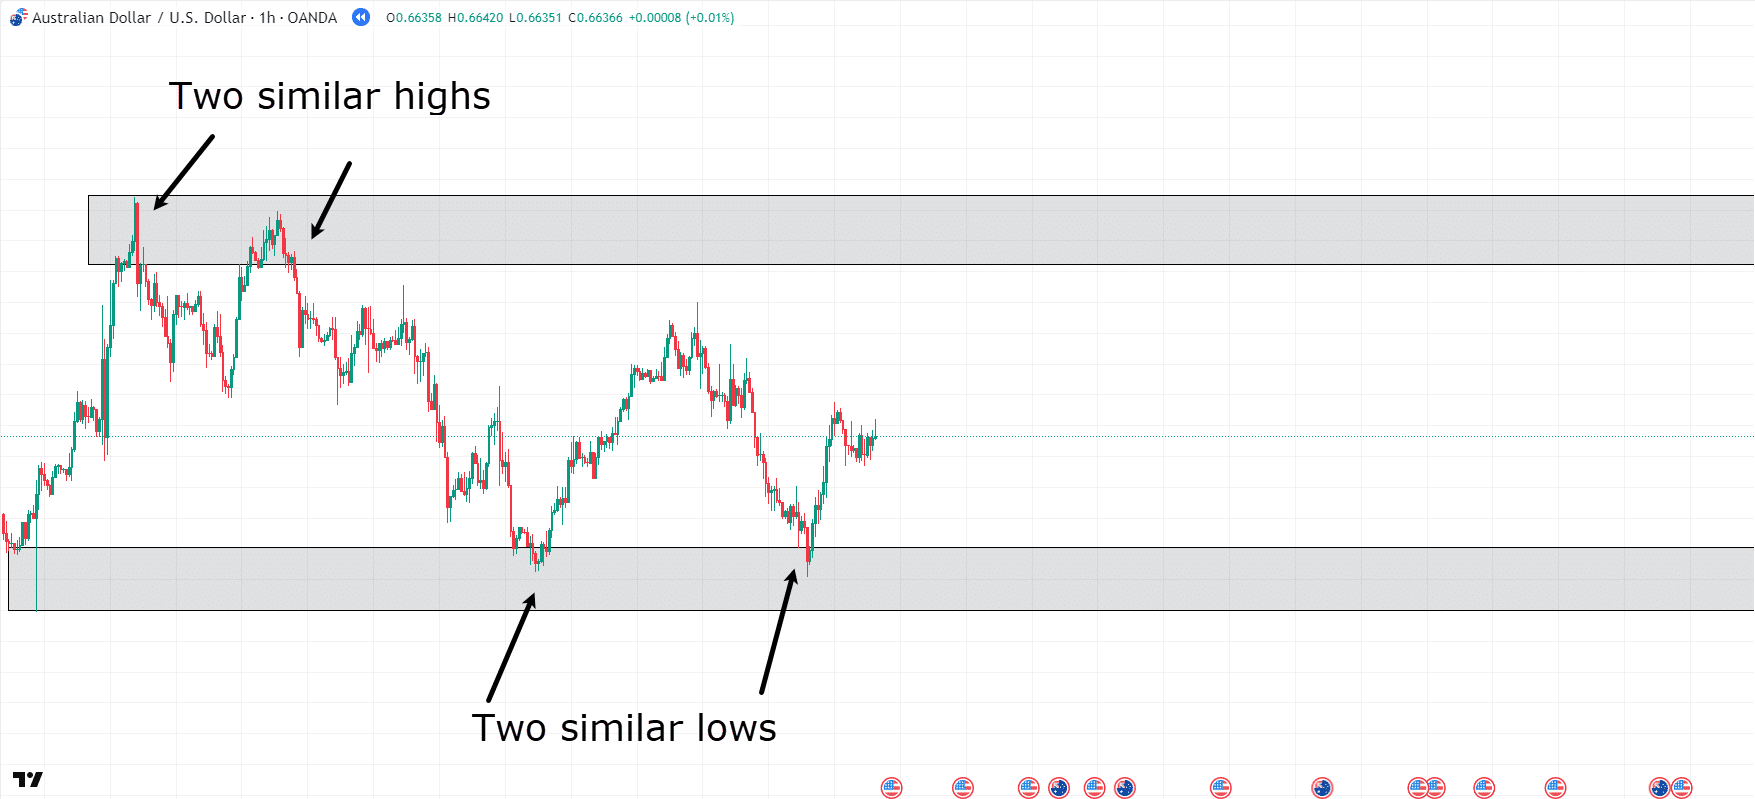
So you can see that price has started doing something interesting.
Every time it’s in the grey zones ( Support and Resistance), there tends to be some level of reversal.
Start paying attention when the price comes back in or even near these zones.
Let’s roll it forward…
AUD/USD 1-Hour Chart Range Rejection:
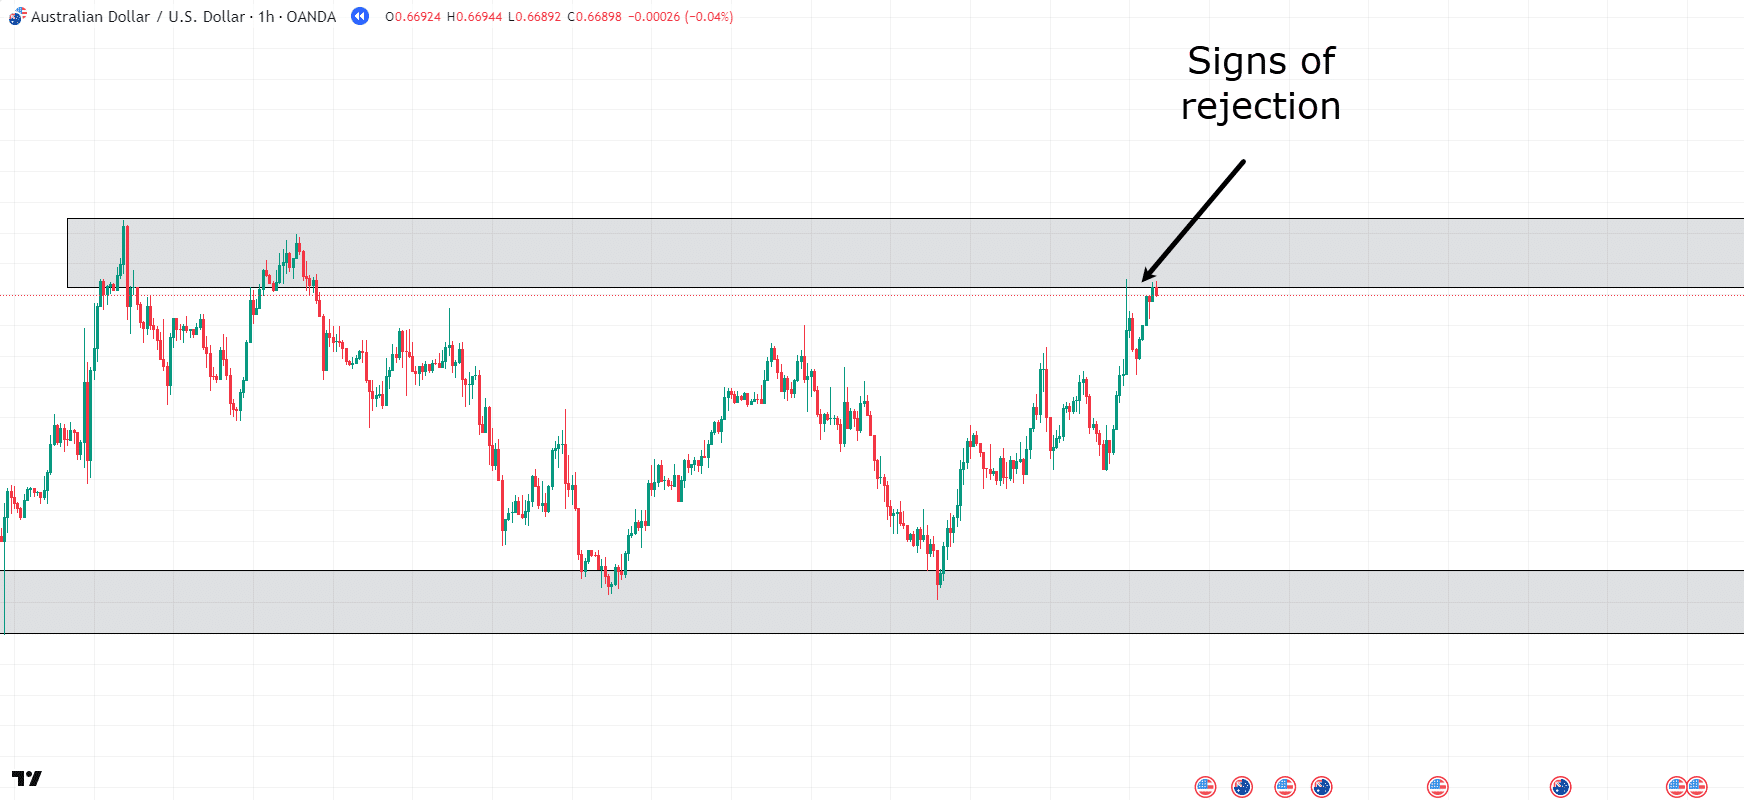
Okay, so price has come back into the zone and is beginning to reject the zone.
There is every chance that price pushes slightly higher than the zone, but for the analysis to be correct, the position should be a short trade in this zone with the stop above the zone.
Our target for take profit can be either the range low or a set TP based on risk-reward.
Let’s see how two different trades could be set up…
AUD/USD 1-Hour Chart Range Trade Setup:
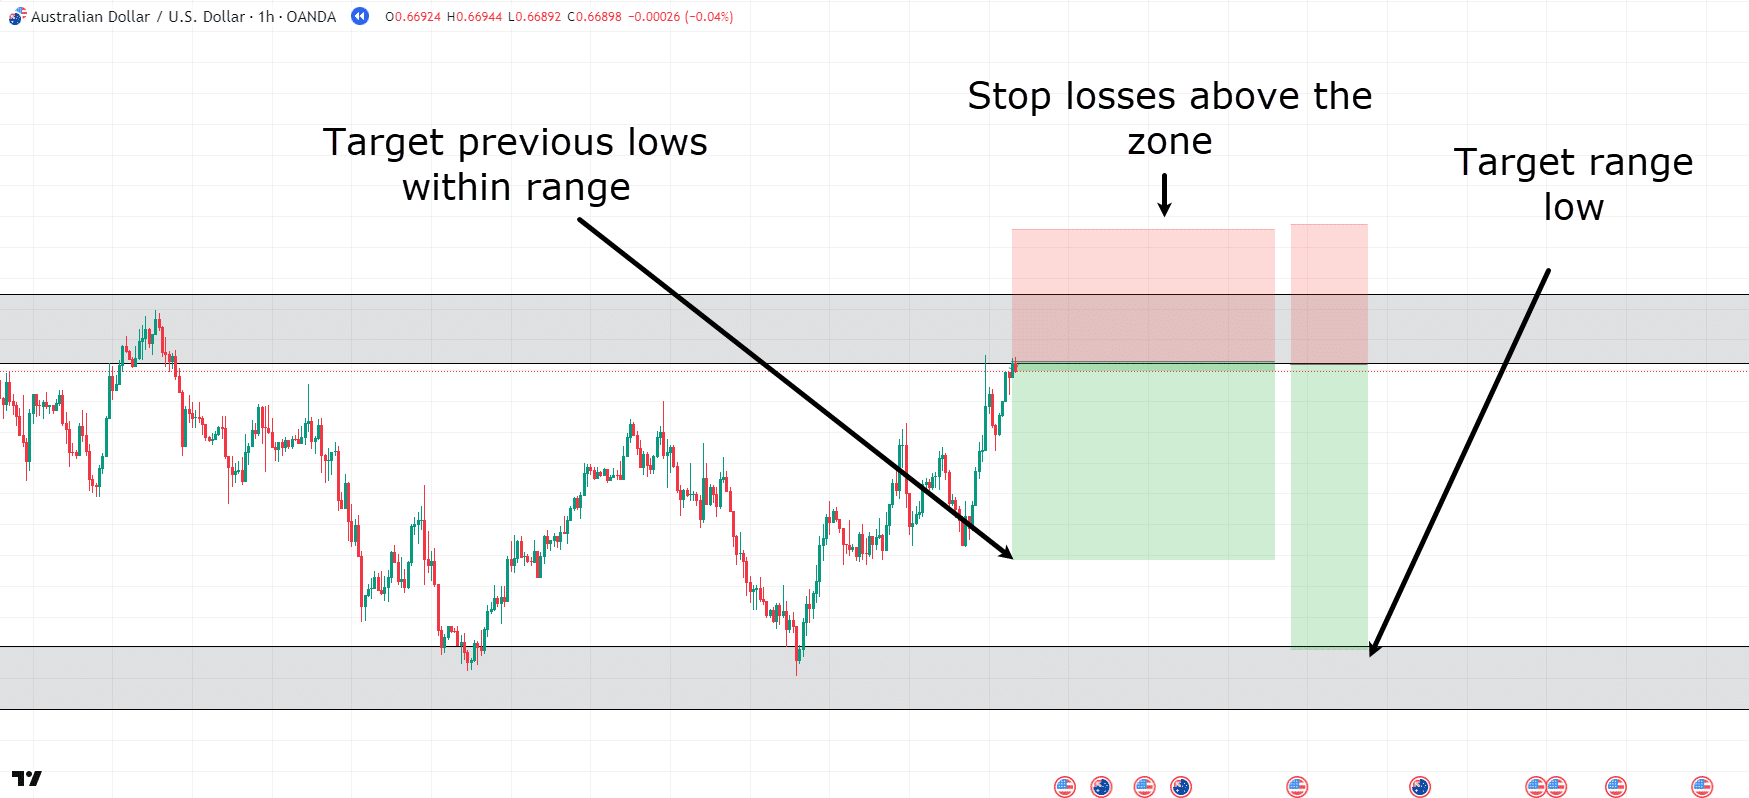
Both these setups are completely reasonable.
The first is more conservative, targeting previous lows, avoiding the risk that price might form a new level and break out to the upside.
While the second is using the concept that during ranges, price will continue to hit the outer boundaries of the support and resistance levels.
Let’s see what happens…
AUD/USD 1-Hour Chart Range Take Profit 1:
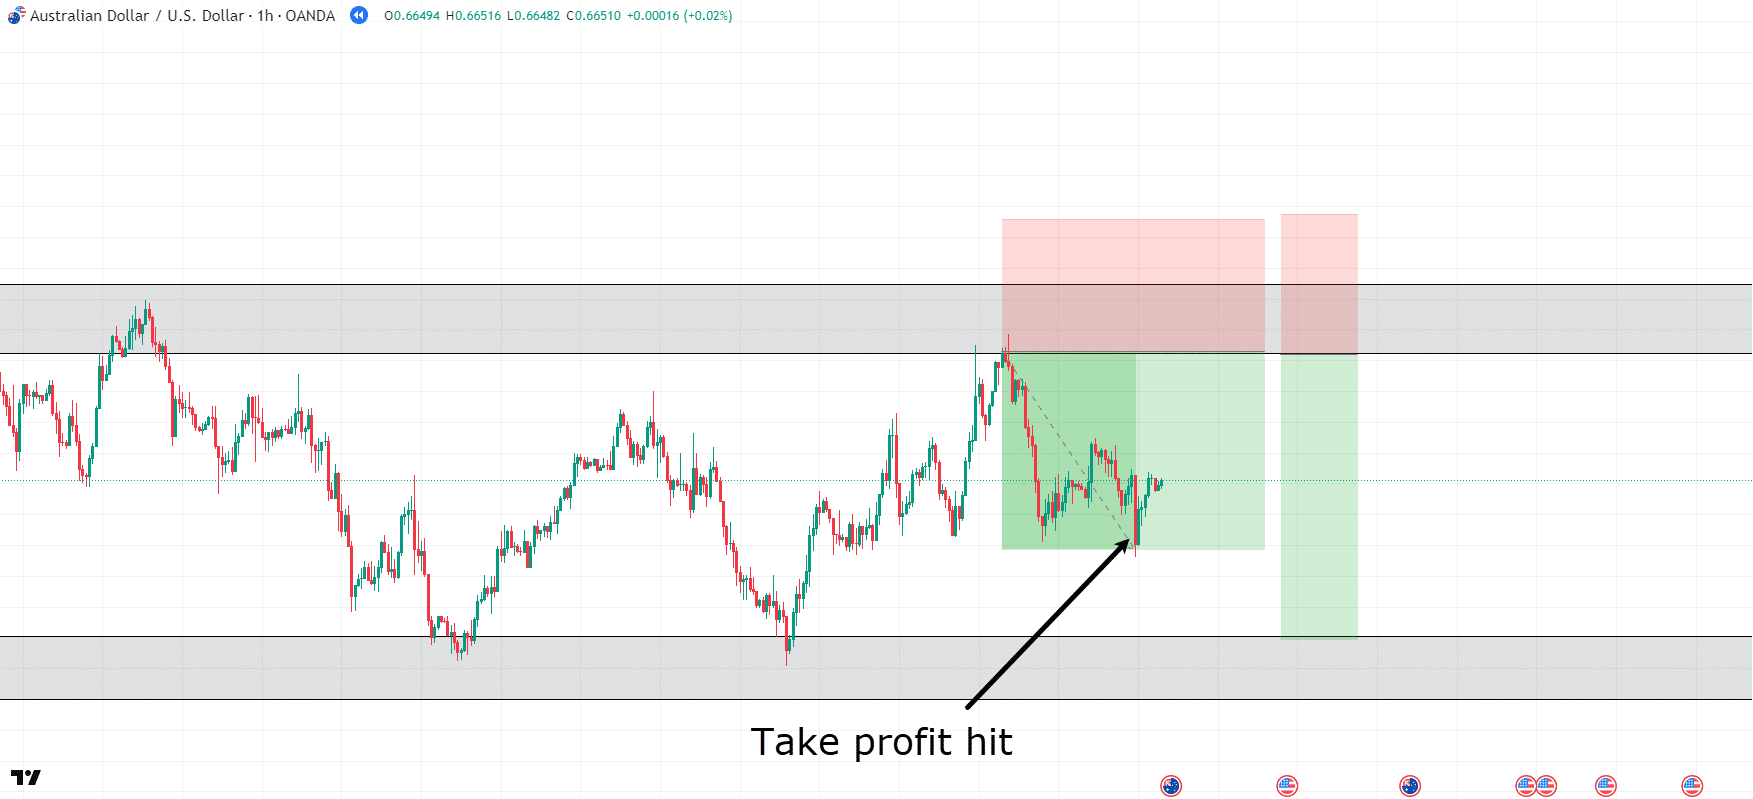
Look at that! Price moved very quickly to the take-profit area after a strong rejection of the zone.
What’s interesting is that price does indeed seem to be stalling at the previous lows.
This might mean the second setup might not play out.
However, patience is required.
Let’s take a look…
AUD/USD 1-Hour Chart Range Take Profit 2:
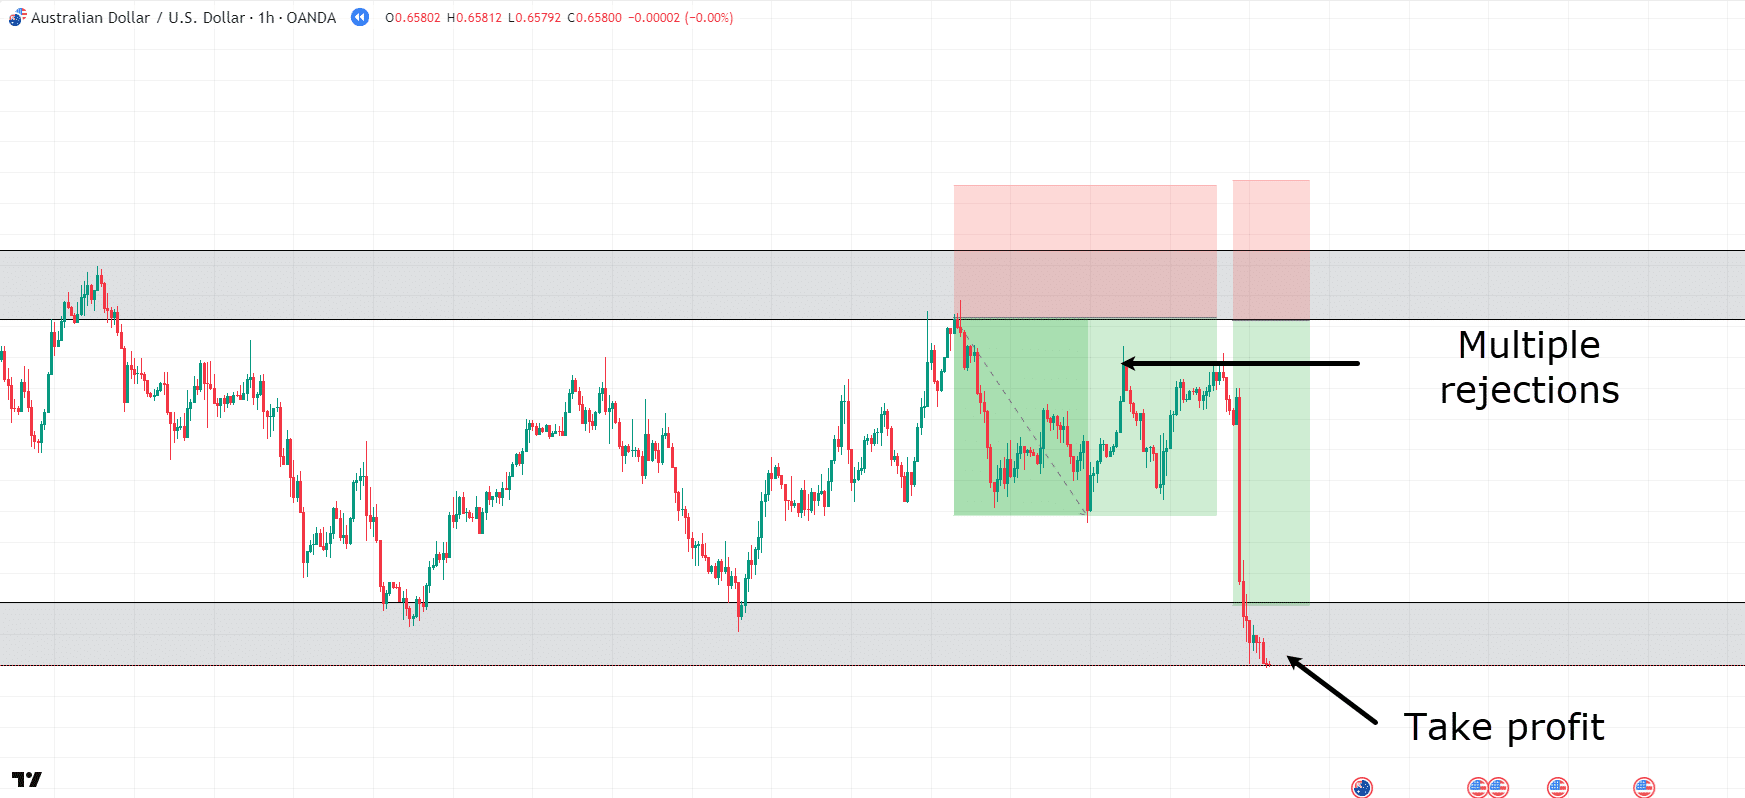
Well, eventually the price fell to the support zone and you could take a profit.
However, it wasn’t without some hesitation!
Price almost reversed back to your entry-level multiple times.
A key difference is that price never truly formed a higher high above entry, so the trade was still valid all the way through till the take profit.
Neither option was right or wrong; both serve their purpose, and in some scenarios, the first option will be the safer option.
Job well done…. Right?
Well, aren’t you still in range, though?
Let me ask you, where is the price right now?
At the range low!
Does this present another trading opportunity?
Technically, it does!
However, the price action at the bottom of this zone presents a difficult question…
Has the selling pressure become too heavy for this support to hold?
If in doubt… simply wait and see if the price rejects the zone…
AUD/USD 1-Hour Chart Range Support:
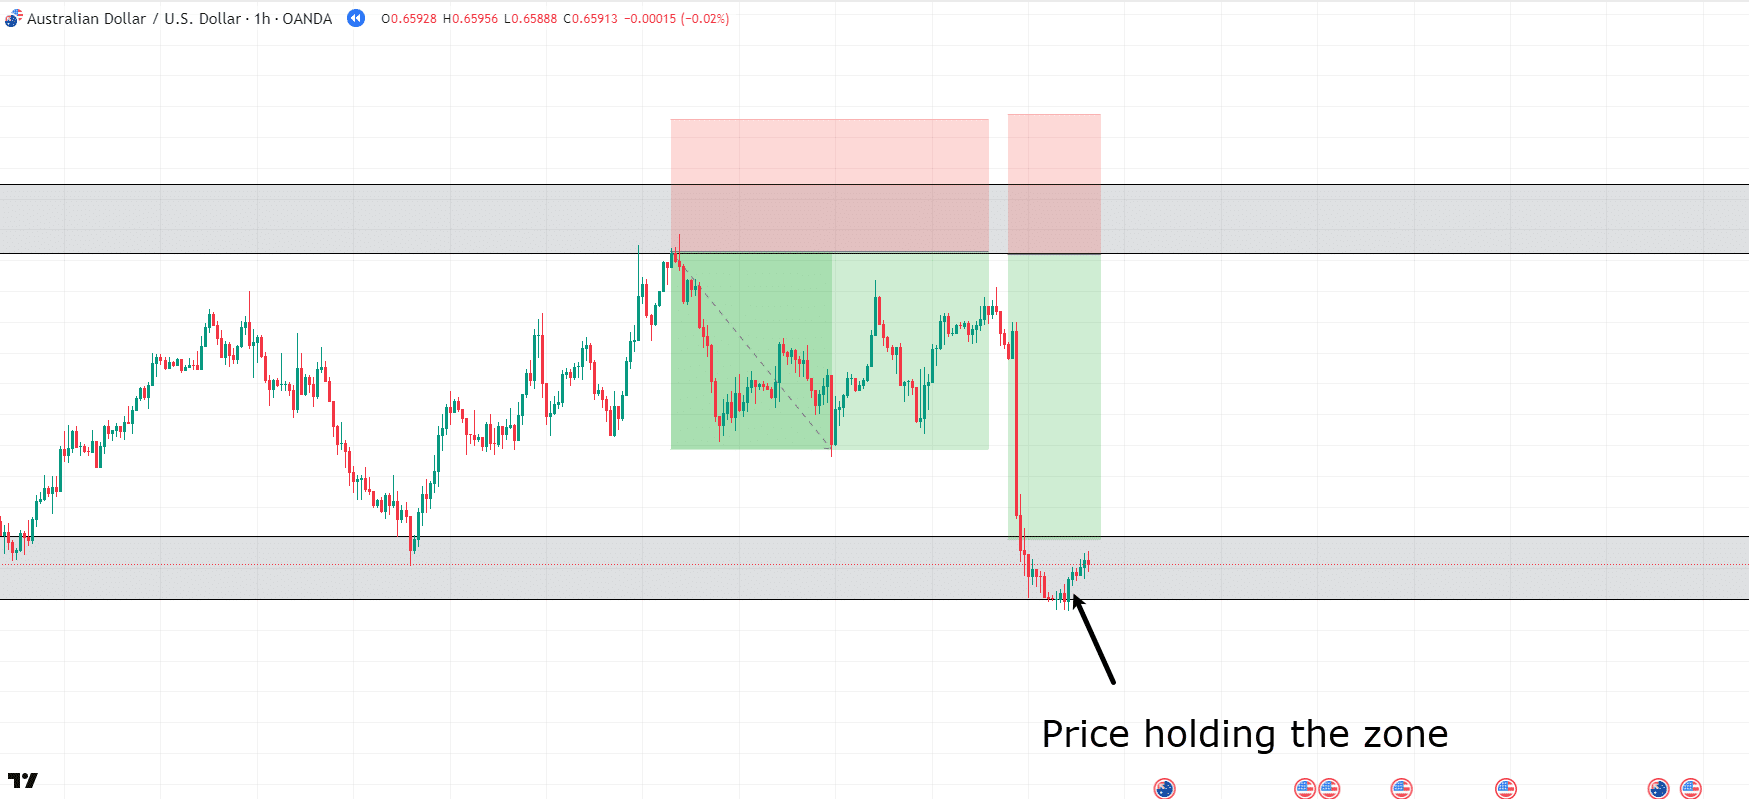
After waiting a few more hours it’s clear that price wants to at least attempt to hold this zone as the range low.
Just like with the resistance, let’s place the stop below the zone and this time target the top of the large sell-off, aka the bearish engulfing candle…
AUD/USD 1-Hour Chart Range Support Entry:
Nice tight stop but still under the support zone whilst targeting the high of the bearish engulfing…
AUD/USD 1-Hour Chart Range Support TP:
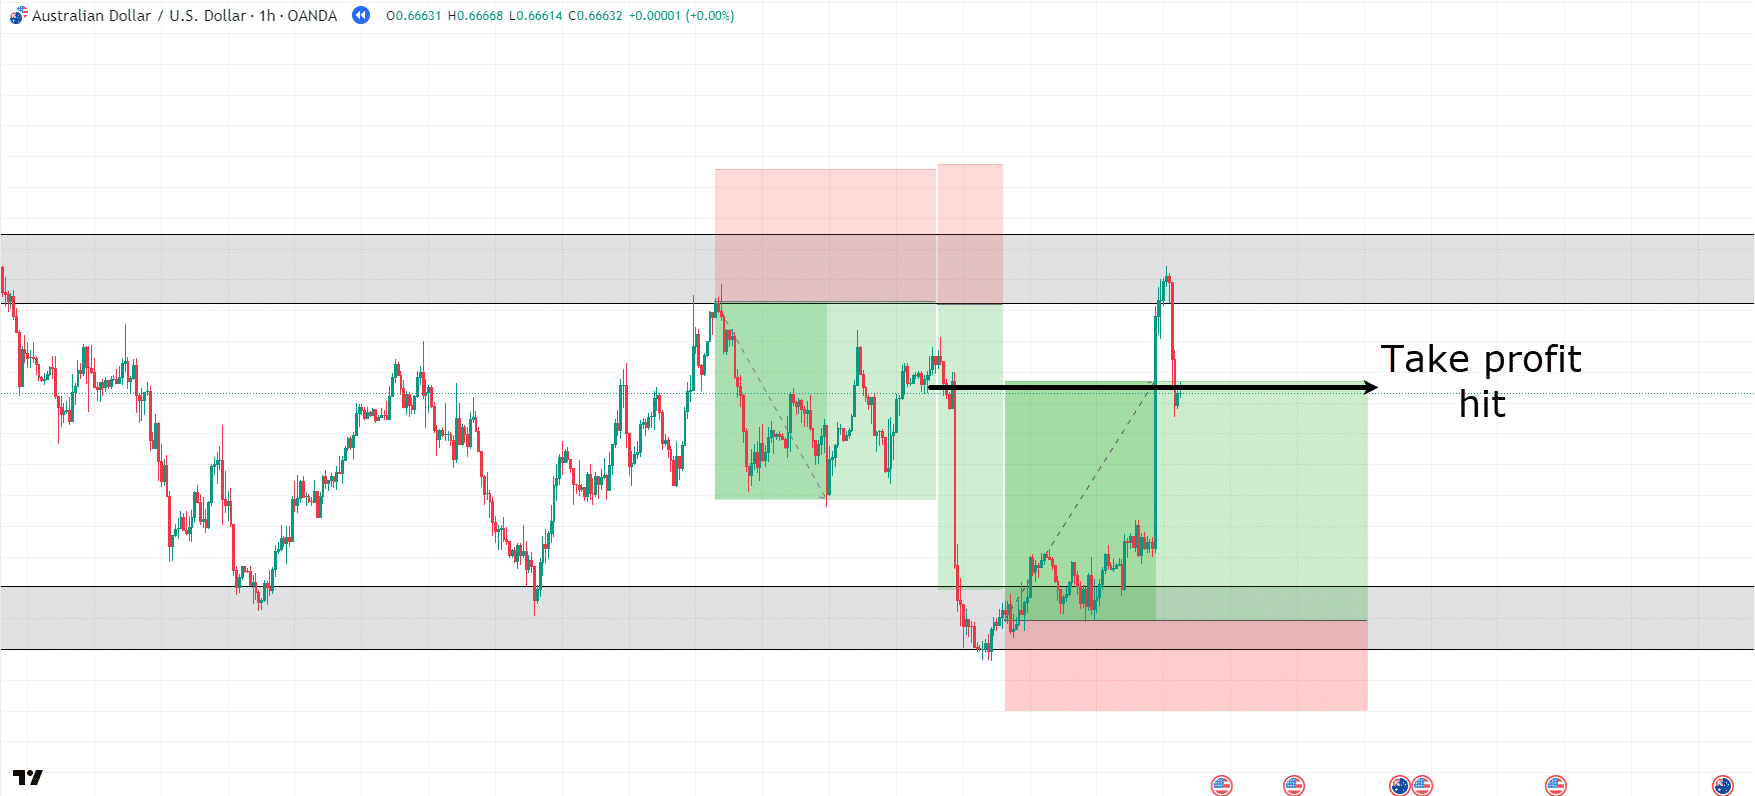
Look at that, price continued to sit in the zone for some time, but eventually broke back up towards the range high.
I know what you’re thinking…
“You should’ve set the take profit at the range high.”
But truth be told, the longer a range goes on, the less clear these boundaries become.
There is nothing wrong with taking profits when they are made available to you.
Take money off the table and reassess the chart to make your next decision.
Just remember, eventually the range highs and lows will break!
It’s about capitalising on the market when it’s acting within the range and making more money on those trades until you eventually get stopped out.
Now that you fully understand range trading let’s take a look at how to trade trending markets.
Range vs Trending Market: How to Trade Trending Markets
The first step in trading trending markets is to identify the change of character.
What do I mean by this?
Simply look at the chart and ask yourself whether or not the previous market structure is continuing in that same pattern or if something has shifted.
Let me show you…
AUD/USD 4-Hour Chart Shift To Downtrend:
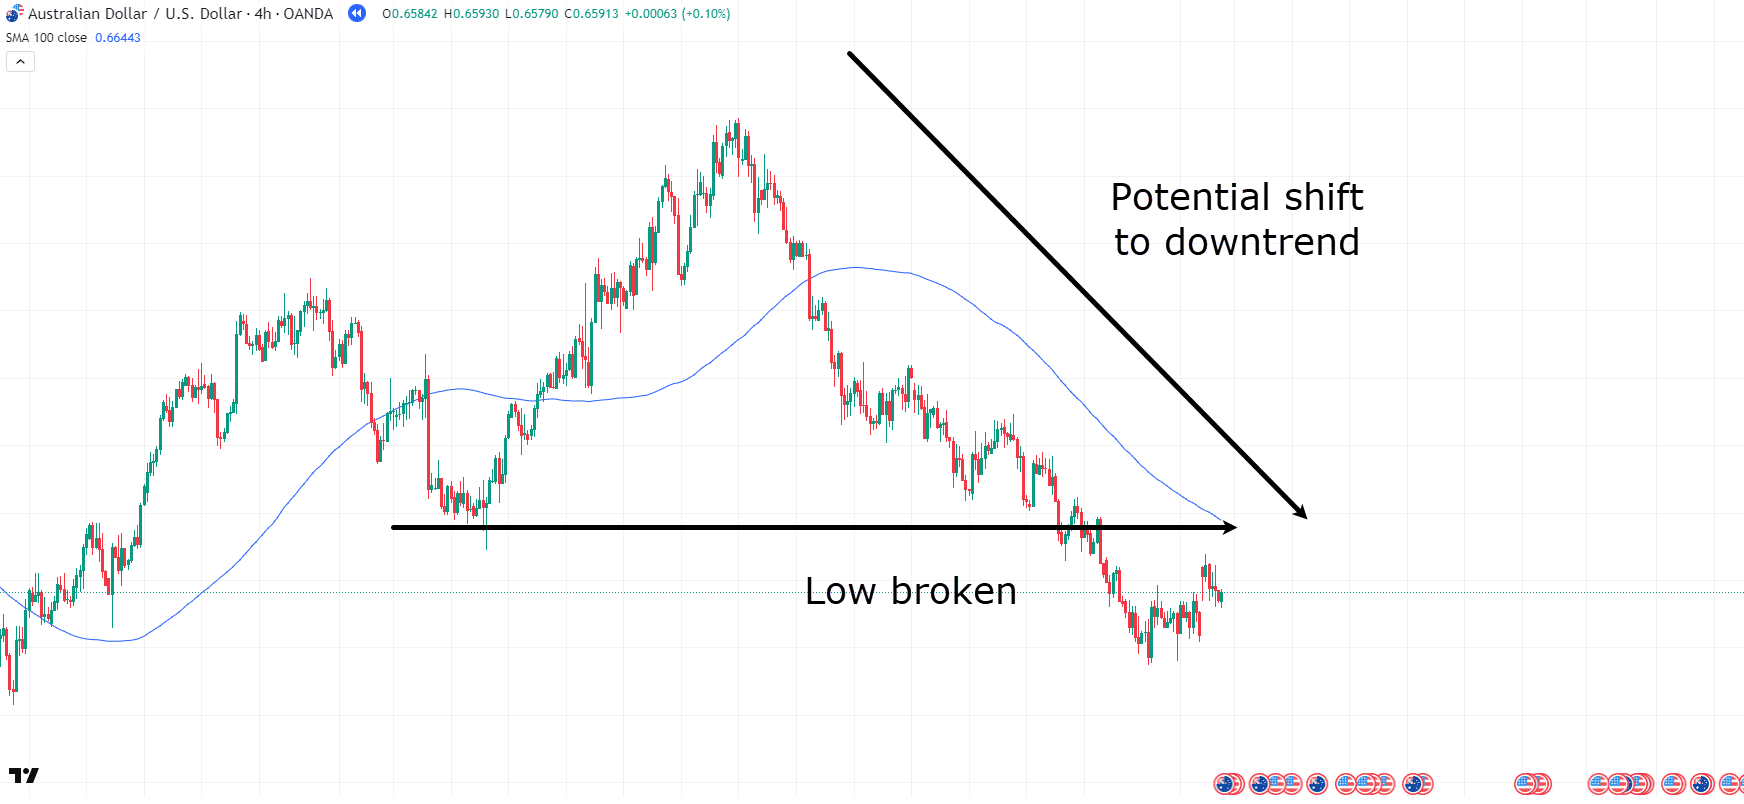
As the previous low is broken, a shift in character has occurred.
Price seems to no longer be forming higher lows and higher highs, does it?
Now, this doesn’t mean you have to act straight away, but it should get you thinking about a potential market shift.
Let’s continue forward…
AUD/USD 4-Hour Chart Rejection:
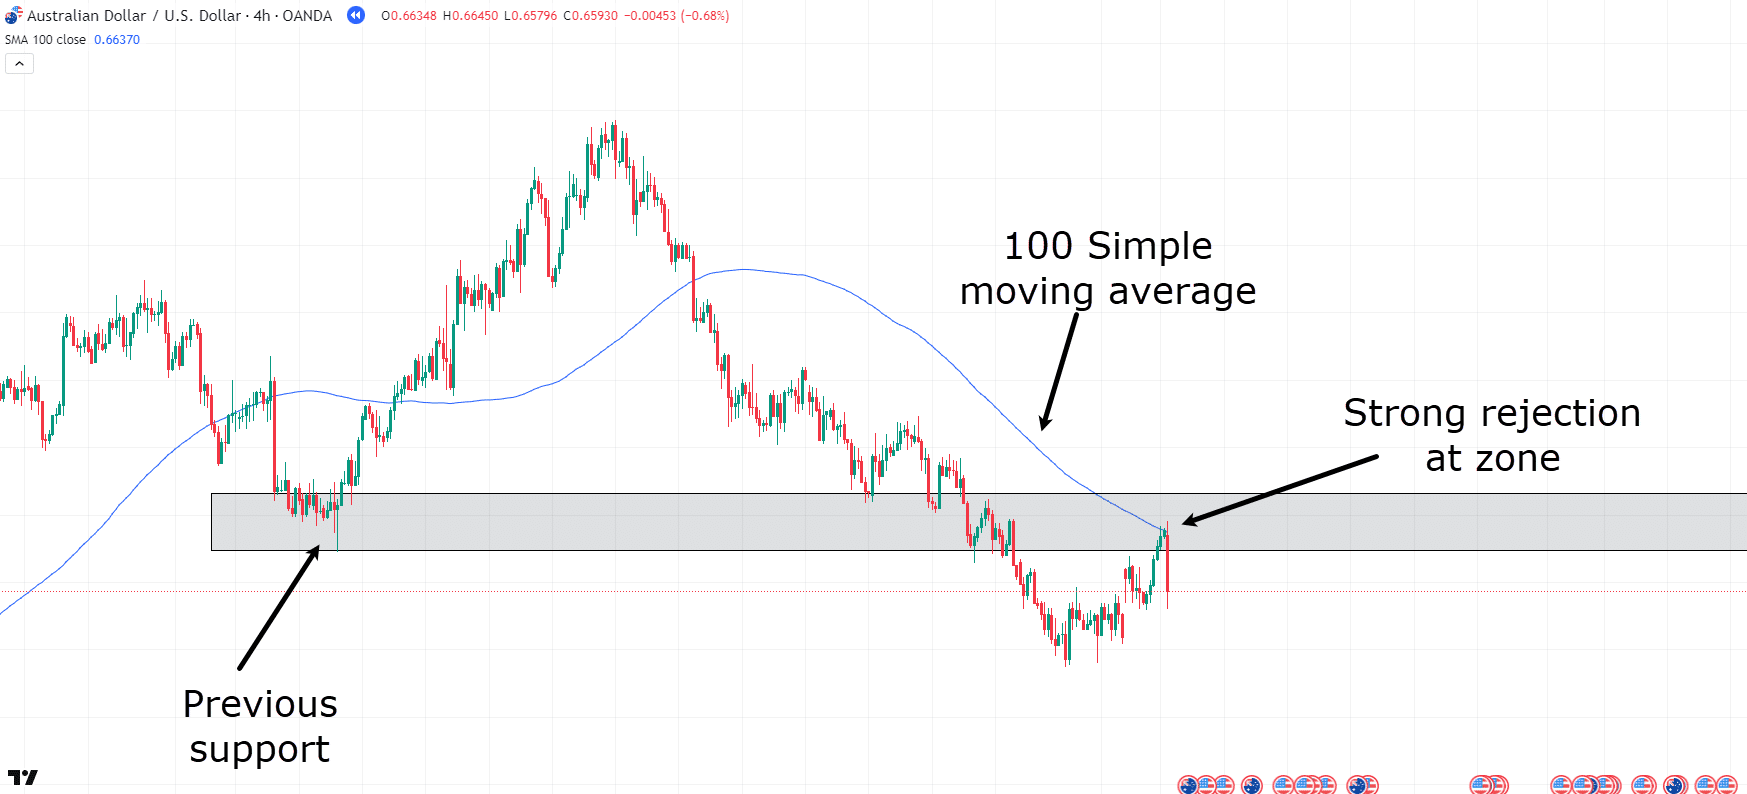
A few things are happening here…
See how price has changed its structure by forming a lower low?
After that, it attempted to reclaim the support level but failed, with a strong sell-off at support now acting as resistance.
On top of all of that, it coincides with the 100 simple moving average.
Everything points towards a continuation downwards!
This now presents an opportunity to take a trade…
AUD/USD 4-Hour Chart Entry #1:
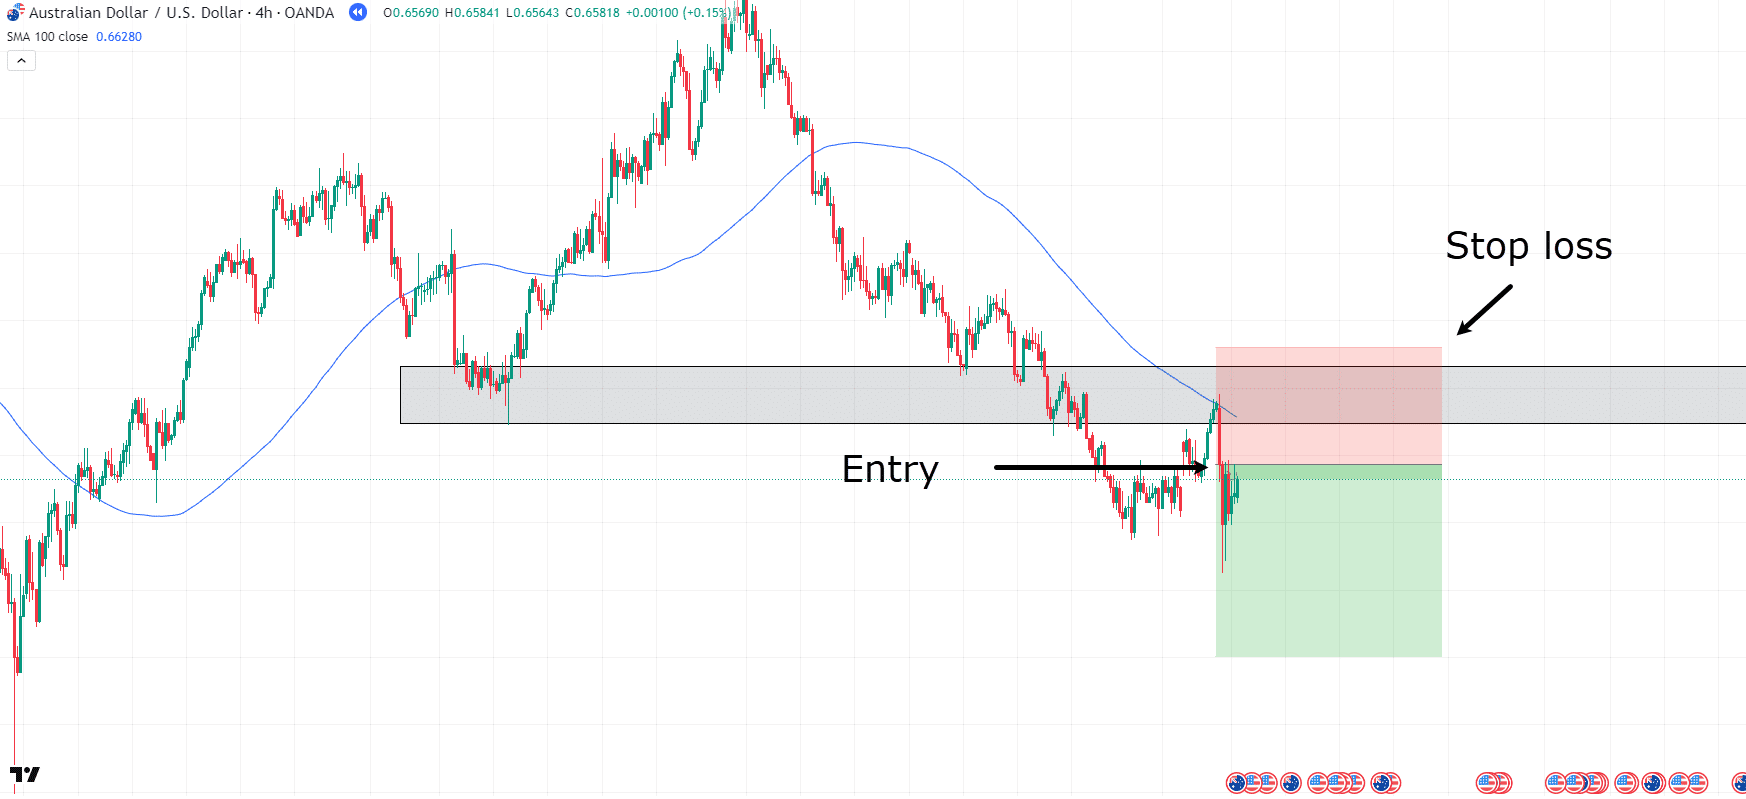
You could enter this trade by simply placing the stop loss above the moving average and the support zone.
Our target is not going to be a fixed target, but rather whenever the price crosses back above the moving average using a more dynamic trailing take profit…
AUD/USD 4-Hour Chart Stop Loss:
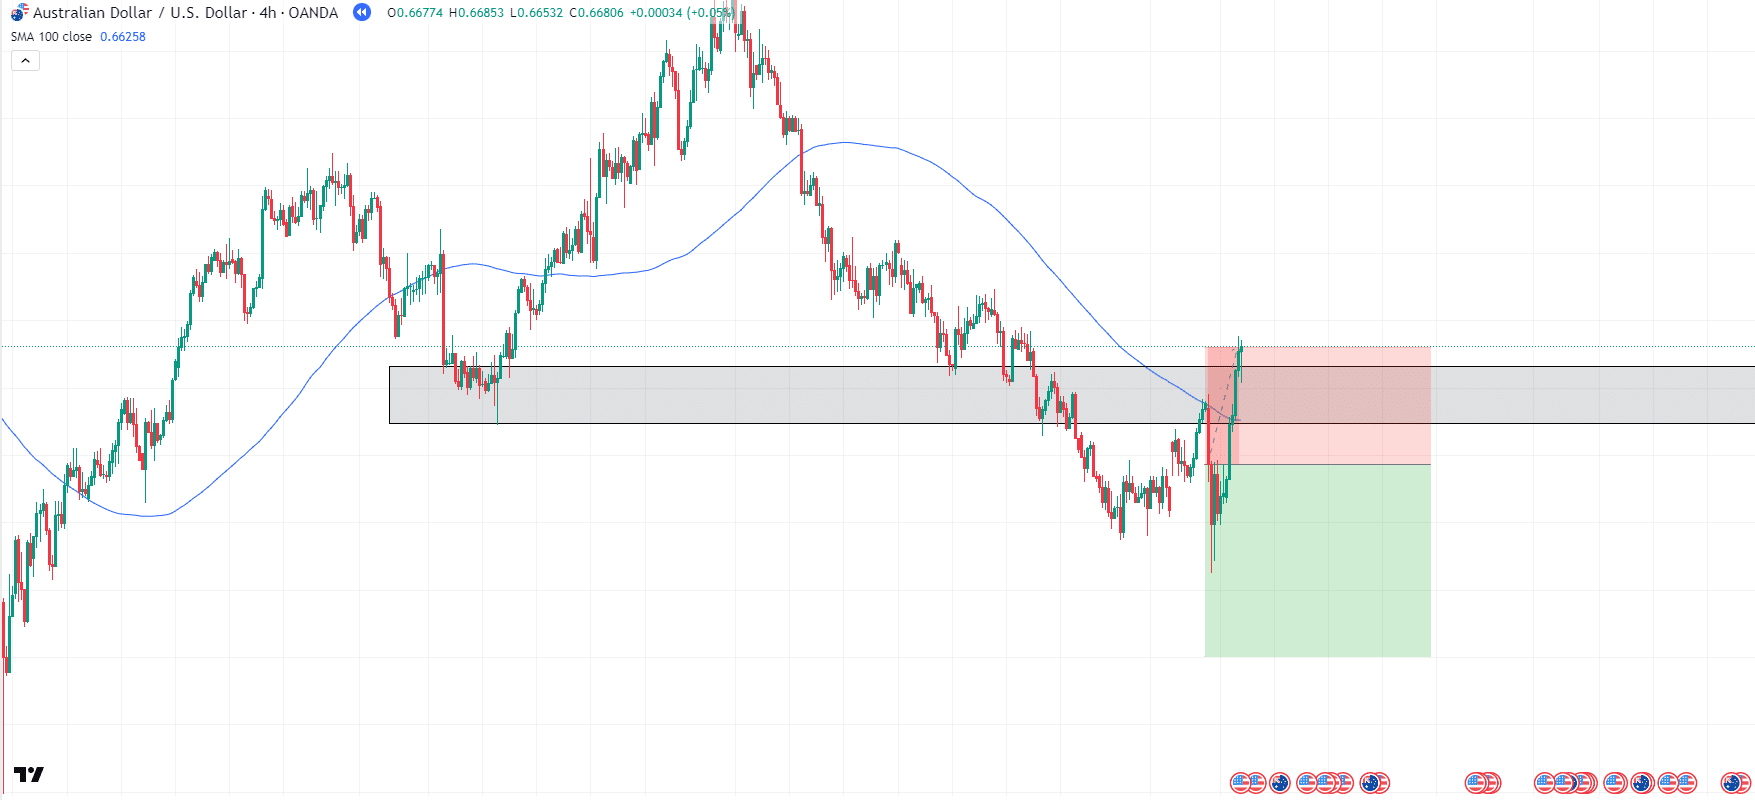
Hang on a minute!
What just happened?
Price shot through the zone and the moving average and stopped out!?
Don’t panic.
These things happen in trading.
However, I am not entirely convinced that this means the downtrend was short-lived…
From here, sometimes it’s best to wait and see what occurs.
Let’s continue forward…
AUD/USD 4-Hour Chart Trend Continuation:
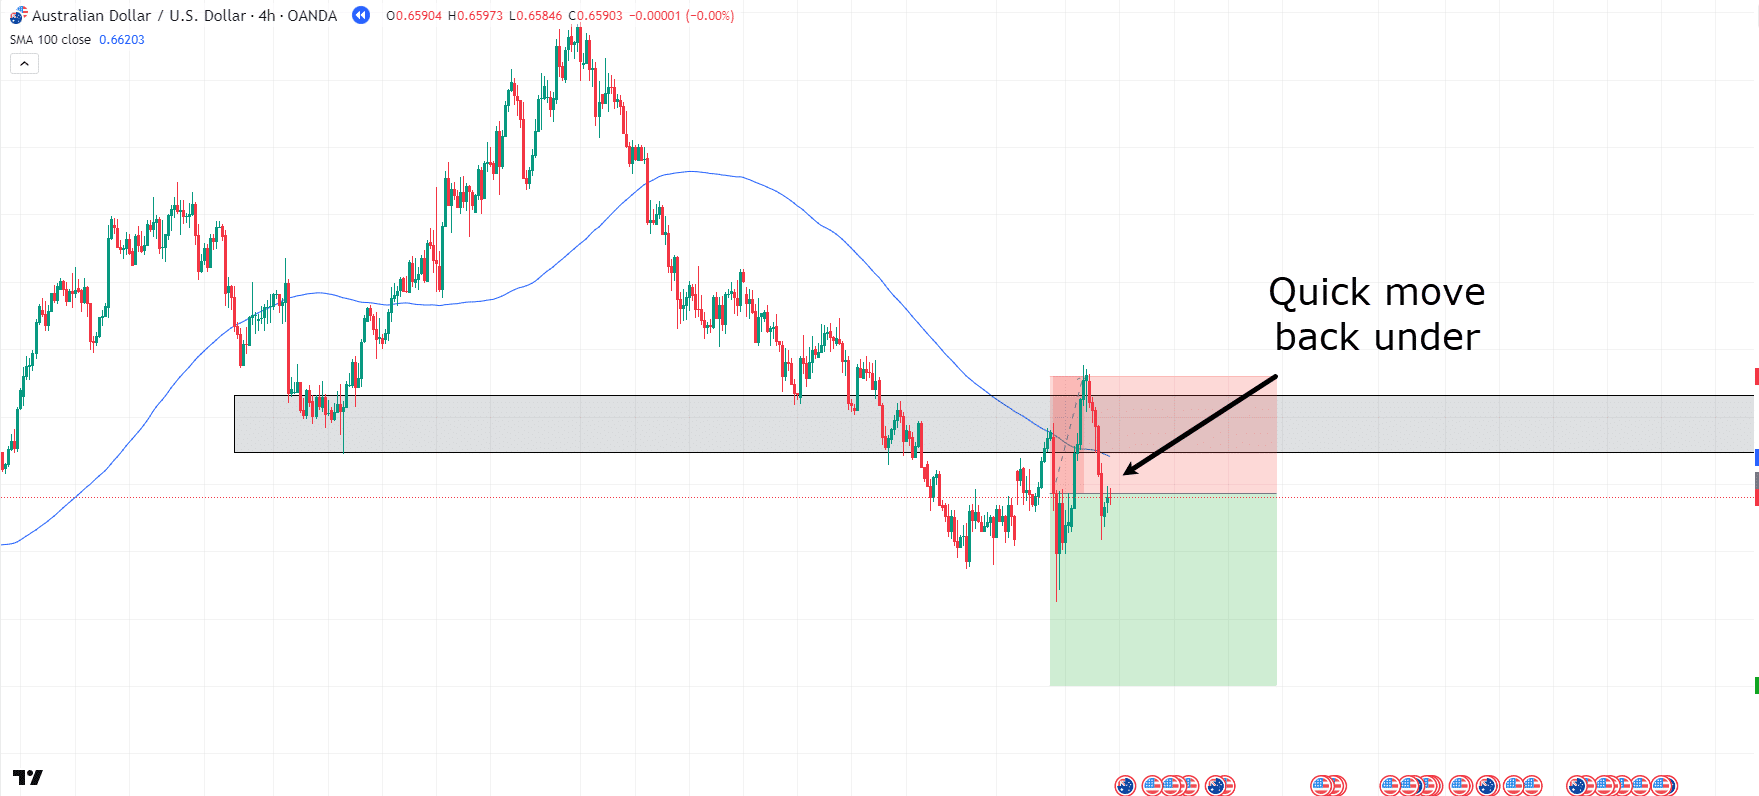
As you can see, right where the stop loss was, price rejected and then fell back below the zone…
“Dammit.”
But hey, that’s trading! And, it doesn’t mean the trade analysis was completely wrong.
Sometimes markets just act slightly differently from how you anticipate.
So, instead of being annoyed, let’s see if a new opportunity has presented itself…
Of course, it is completely up to you at this point whether you choose to re-enter!
But for argument’s sake, let’s say you wanted to see the price reject the moving average again…
AUD/USD 4-Hour Chart New Rejection:
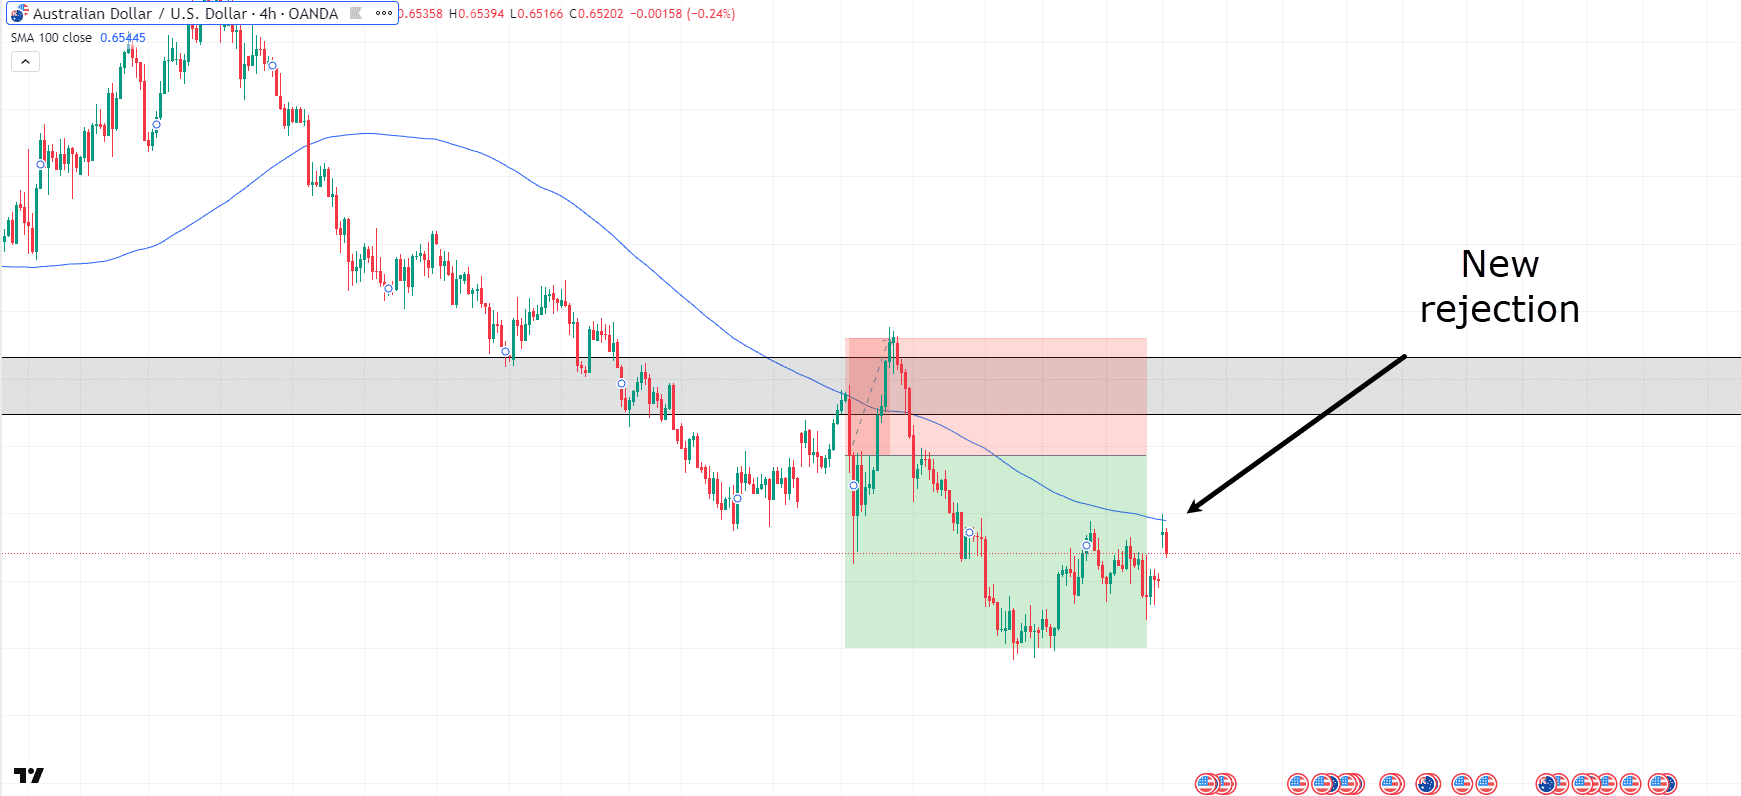
Okay.
So the original trade, if re-entered, would have been successful, but there is nothing wrong with being cautious either.
At any rate, a new trade opportunity has presented itself…
AUD/USD 4-Hour Chart Trade Setup:
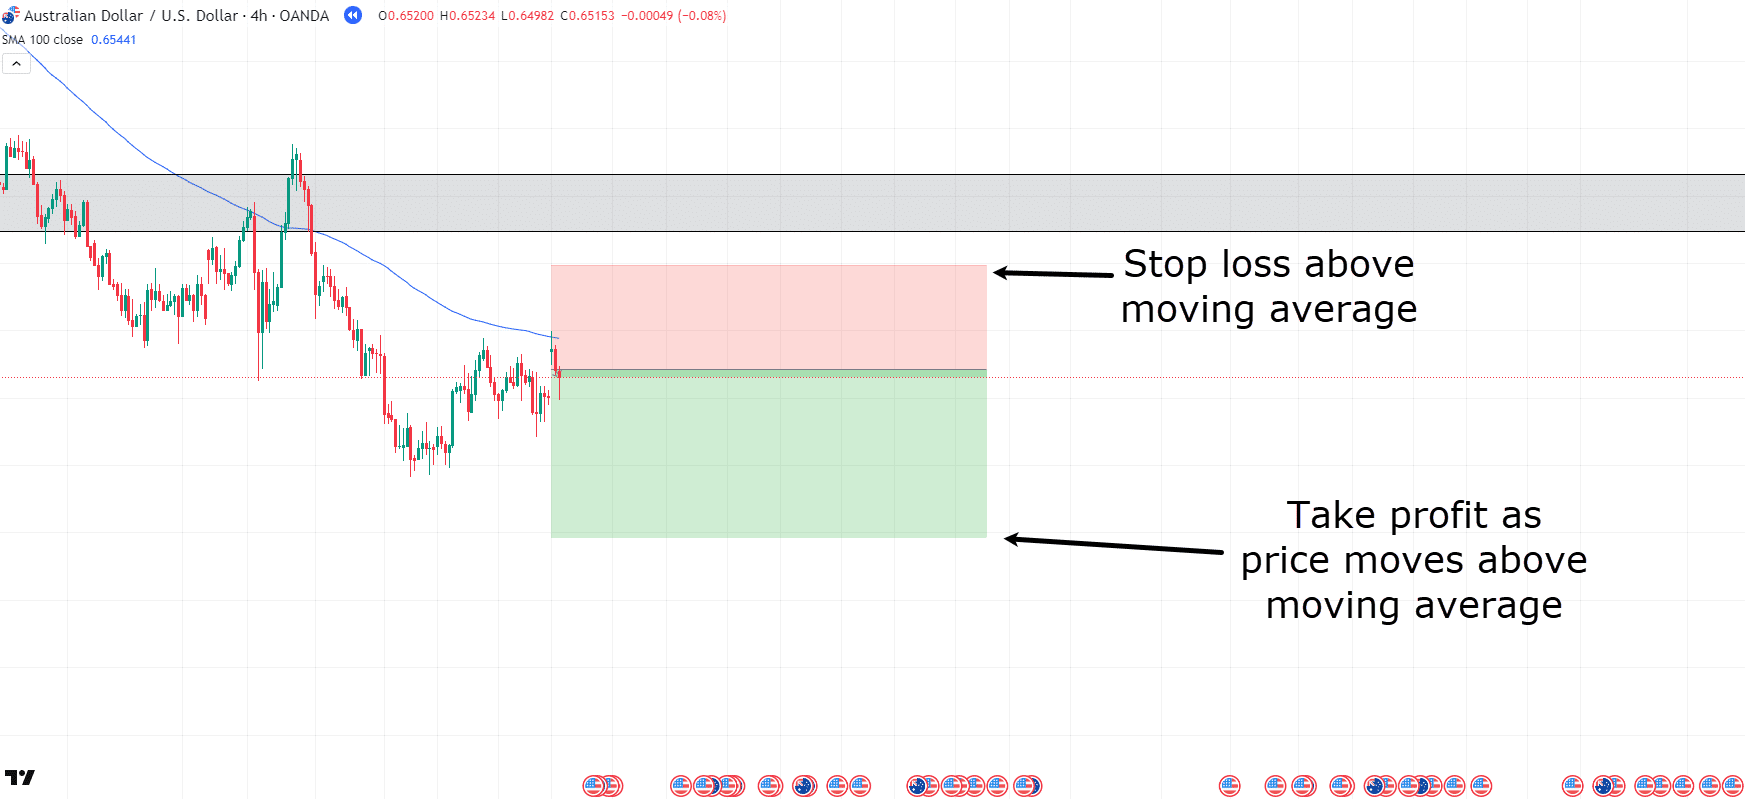
Just like last time, the stop loss will sit above the moving average with a bit of breathing room, and take profit won’t be a set take profit, but rather a take profit when the moving average breaks.
Let’s see what happens…
AUD/USD 4-Hour Chart Take Profit:
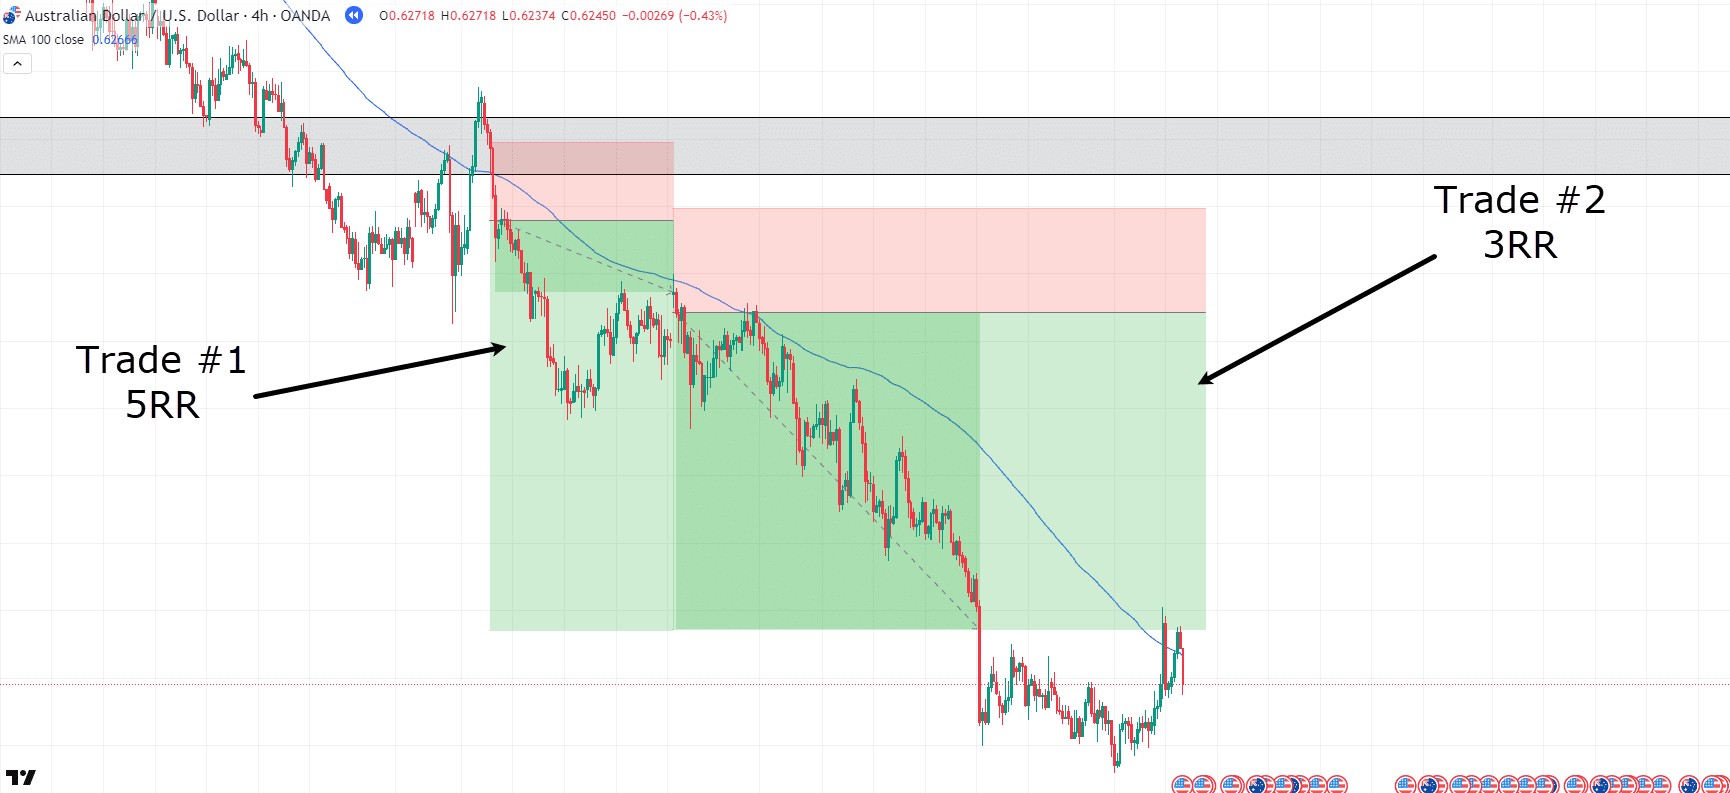
Look at that!
Price continued in your direction for a significant amount of time before breaking above the moving average and stopping out in profit.
If you re-entered after the original trade on the re-entry below the moving average, this trade would be worth around 5rr, and if you waited patiently for a retest of the moving average, depending on your stop loss placement, you would have yielded 3+rr.
See how the initial loss really was just the cost of more information before the winner?
That’s why it’s important to never doubt yourself, even if the price doesn’t act exactly how you expected.
Watch the chart and check if it was just a liquidation grab or a news event that caused a brief disruption to your trading plan before a new opportunity presented itself.
It won’t always be perfect, but if you can catch a trend trade, the profits will often outweigh the losses taken trying to get in at the right time.
Range vs Trending Market: How do these work together?
Markets often have certain characteristics as discussed earlier.
They can be going up, down, and sideways, meaning you need to use the right tool for the right job…
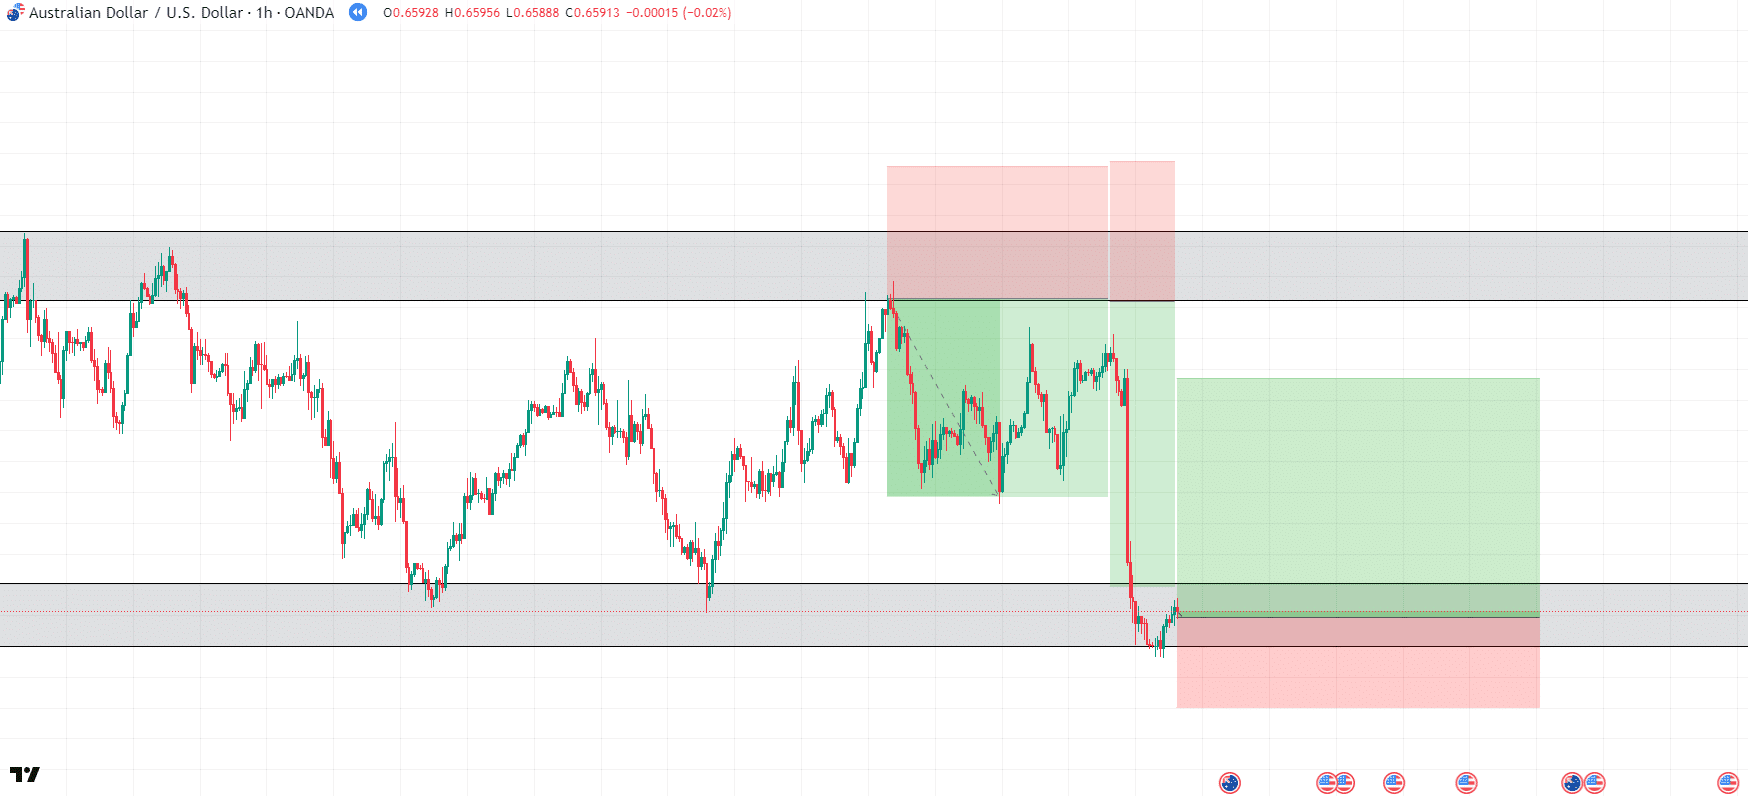
Diagram Of Dynamic Trading:
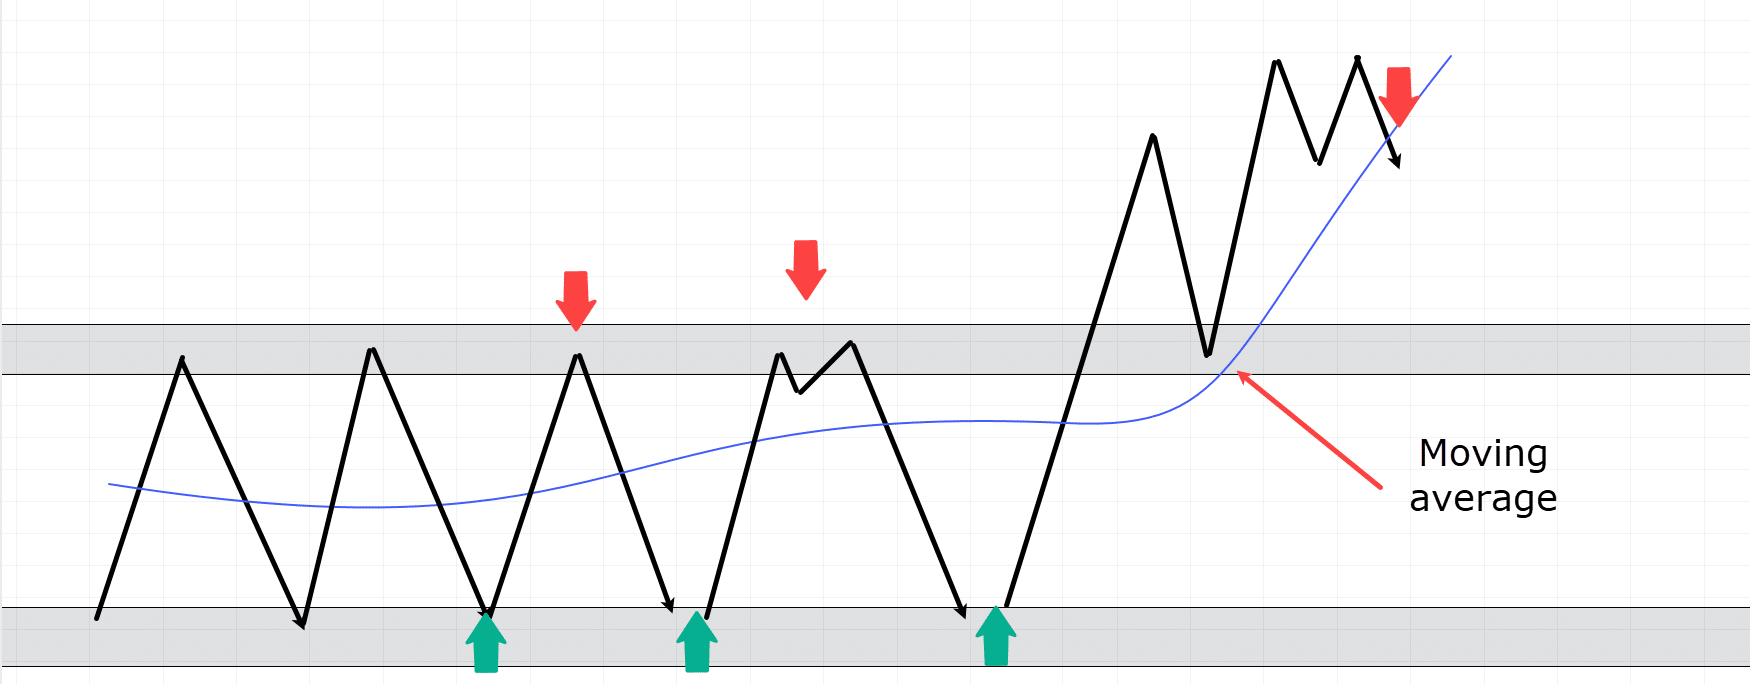
As the diagram shows, as price goes through the range, the moving average is of no use.
However, the range highs and lows provide perfect opportunities to take long and short entries.
But when the price busts through the range high without any resistance and retests the high of the range, your trading strategy has to shift and the moving average does come into play in a more trend trading style.
Staying dynamic and aware of what market conditions you are in is vital to trading success!
Conclusion
By now, you should have a clear understanding of the differences between range-bound and trending markets and why adapting your approach to each is so important.
In this article, you’ve learned:
- What defines a range-bound market, and how to recognize support and resistance zones
- How trending markets form and how to identify their structure
- Common mistakes that traders make in both environments
- Which indicators can help confirm ranging or trending conditions
- Real examples of how to trade both markets
- How discipline and context help avoid false entries in both market types
Mastering these two conditions is less about predicting the future and more about recognising the present.
When you can confidently identify whether the market is ranging or trending, you give yourself a clear edge and a strategy that fits with reality.
So the next time you sit down to trade, ask yourself one simple question:
Is the market ranging, or is it trending?
Once you’ve got that, the rest becomes much easier to manage!
So, do you have a market condition you prefer trading?
Have you traded both conditions already?
Let me know in the comments below!
This guid is incredibly valuable.
I have tried many strategies and at some point managed to stick with one. However, that strategy wasn’t clearly defined in a contest as this guide have stressed out. Now, I have figured it out what my approach is and in what markets conditions I should be trading.
For instance, Soybean futures has been ranging on the daily timeframe since August last year and I’ve catch the swings 4time. It’s likely to breakout of resistance and give a new uptrend I’m waiting to jump on.
Tradingwithrayner.com is naturing potential traders and I believe we would be able to contribute to the growth of it.
Thanks for sharing! Glad to hear the guide helped you clarify your strategy and trading conditions.
Appreciate your kind words about TradingwithRayner.com. We’re excited to grow with traders like you!
Cheers!