This post is written by Jet Toyco, a trader and trading coach.
At this point…
I’m sure you’re already familiar with bullish candlestick patterns such as the:
- Hammer
- Bullish engulfing
- Morning star
That’s why in today’s guide…
We will focus on practical implications on how you can use bullish candlestick patterns to create your own strategy whether you trade stocks, forex, or crypto.
You ready?
You better be because you’re in for a treat!
But first, let’s find out the true nature of these bullish candlestick patterns.
The Truth Behind Bullish Candlestick Patterns
Before we go deep into this guide with technical concepts and strategies, you must first know the absolute truth behind them.
So what is this truth, you may ask?
Well, first of all…
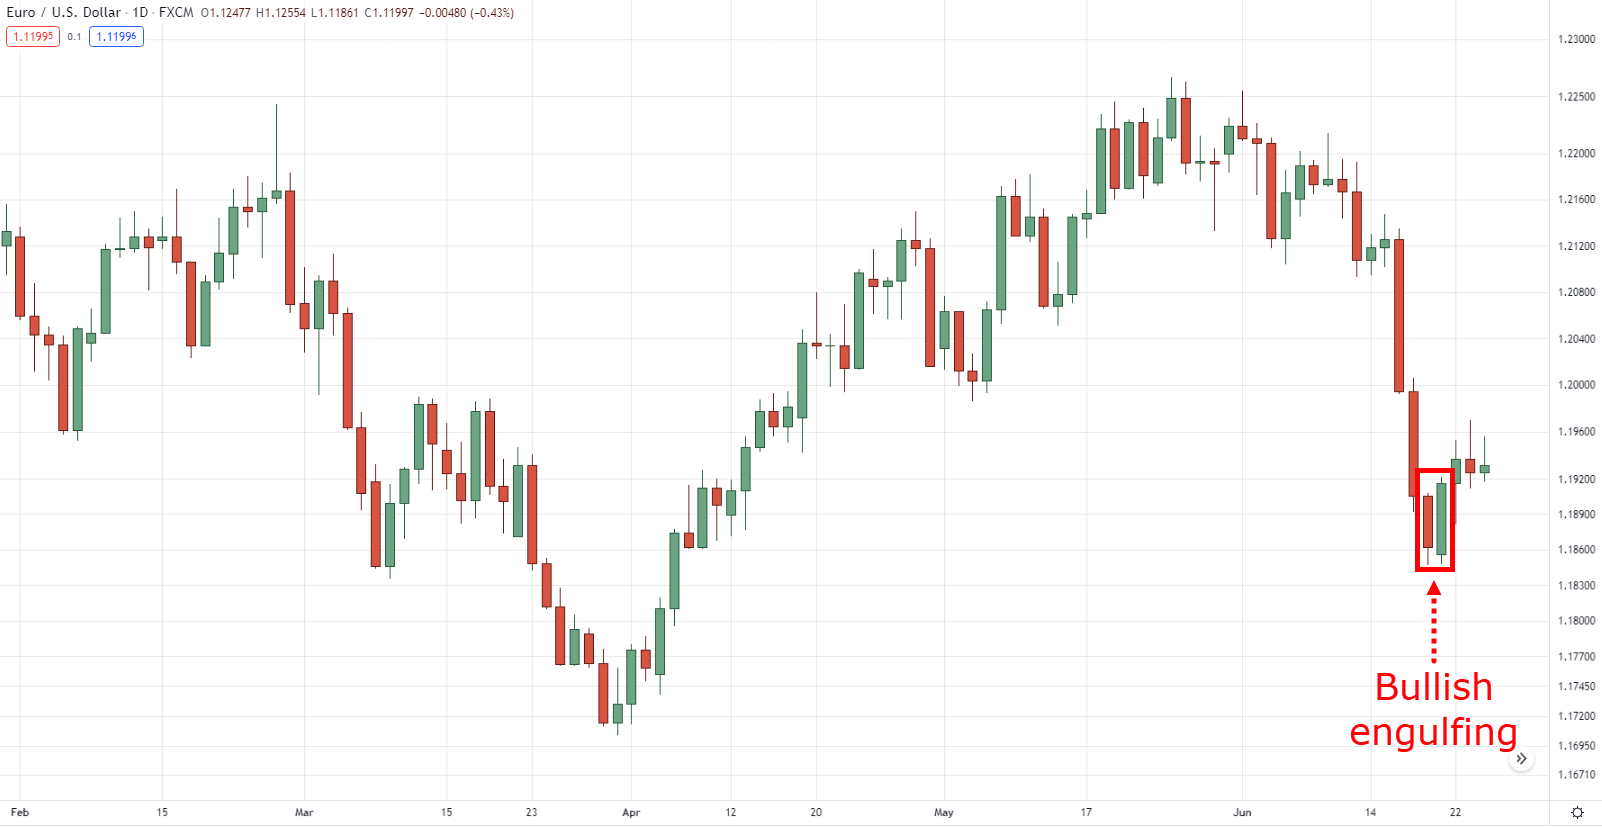
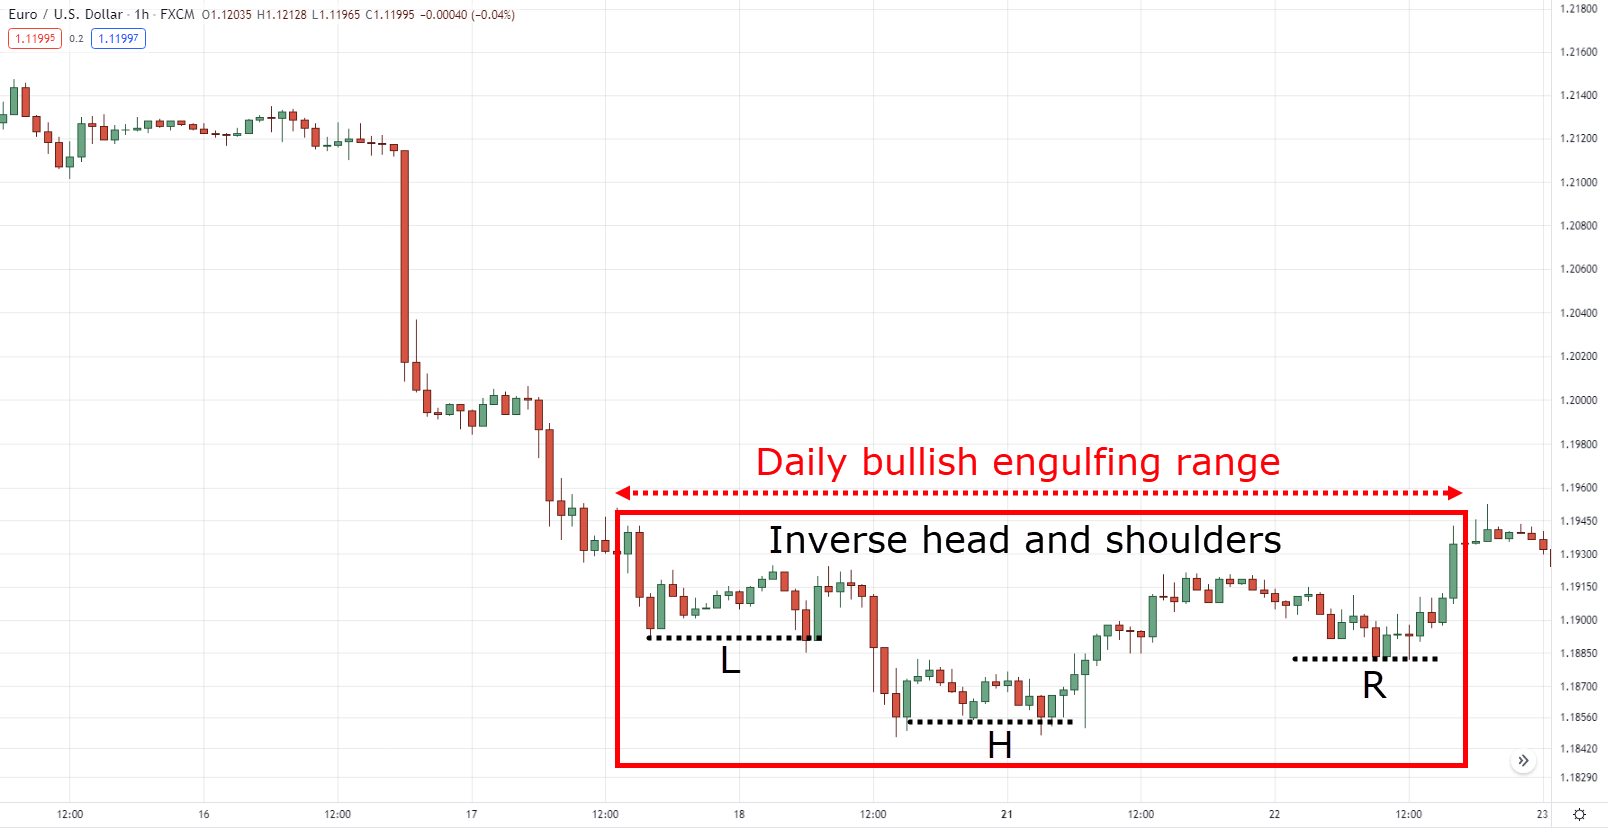
The truth is that bullish candlestick patterns are essentially chart patterns on the lower timeframe.
Bullish engulfing on EURUSD daily timeframe:
Inverse head and shoulders on EURUSD 1-hour timeframe:
It means that there’s always a story, a battle of buyers and sellers for every bullish candlestick pattern you see on the lower timeframes.
So, why am I sharing this with you?
Why is this important?
Here’s why:
Many traders can get too attached to what specific candlestick pattern it is before they enter a trade.
“Ah shoot, I have to wait for a bullish engulfing pattern first before I enter a trade.”
“A morning star candlestick pattern? Ew, I’d rather wait for a hammer candlestick pattern.”
But here’s the second truth…
Bullish candlestick patterns can be formless.
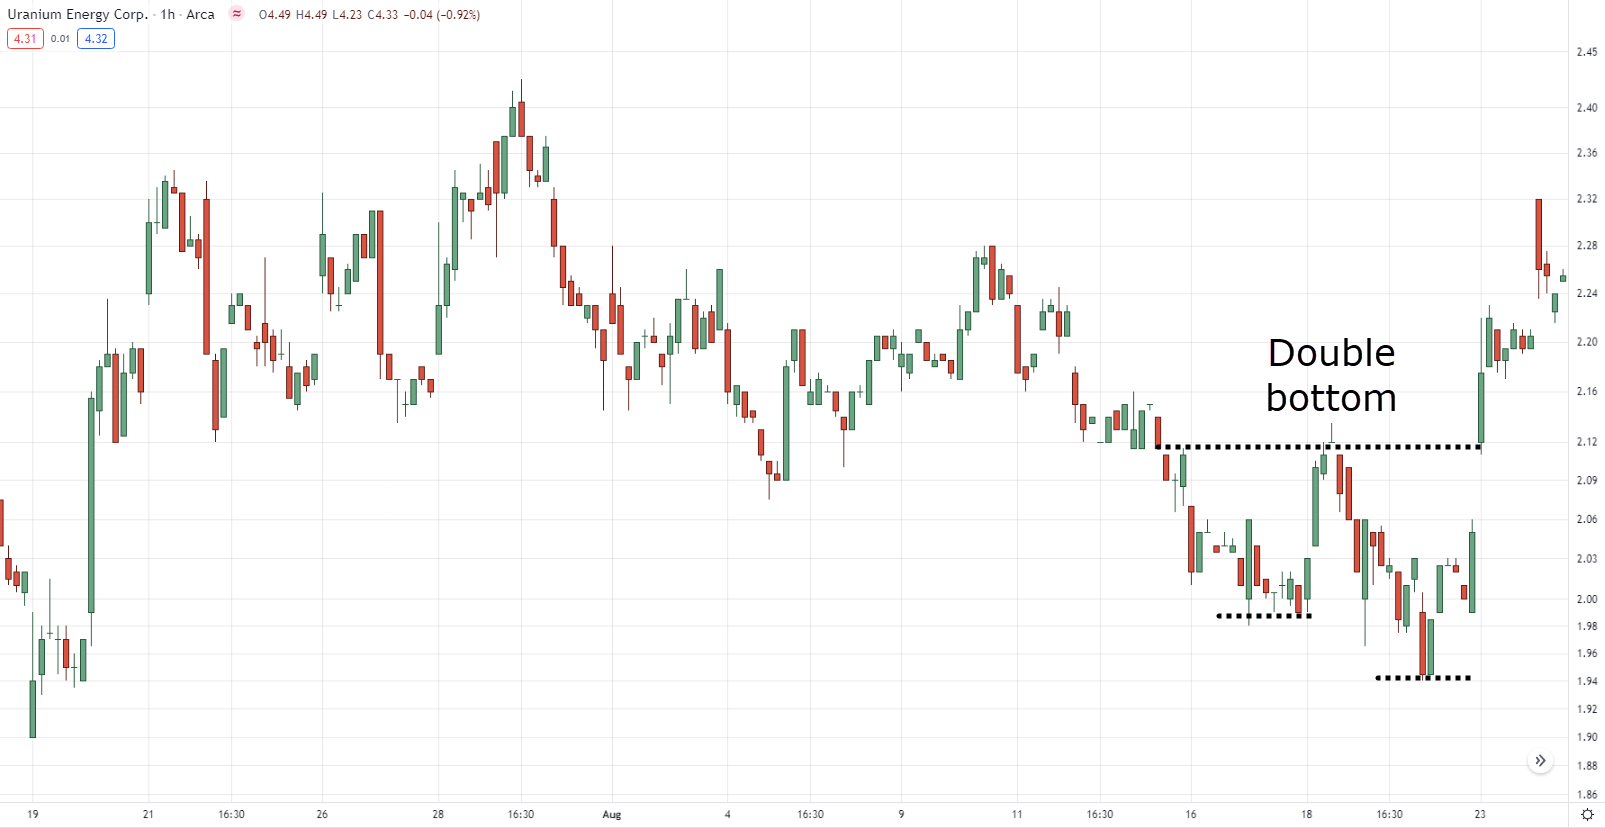
On the lower timeframe, a chart can show a double bottom chart pattern…
Double bottom on UEC 1-hour timeframe:
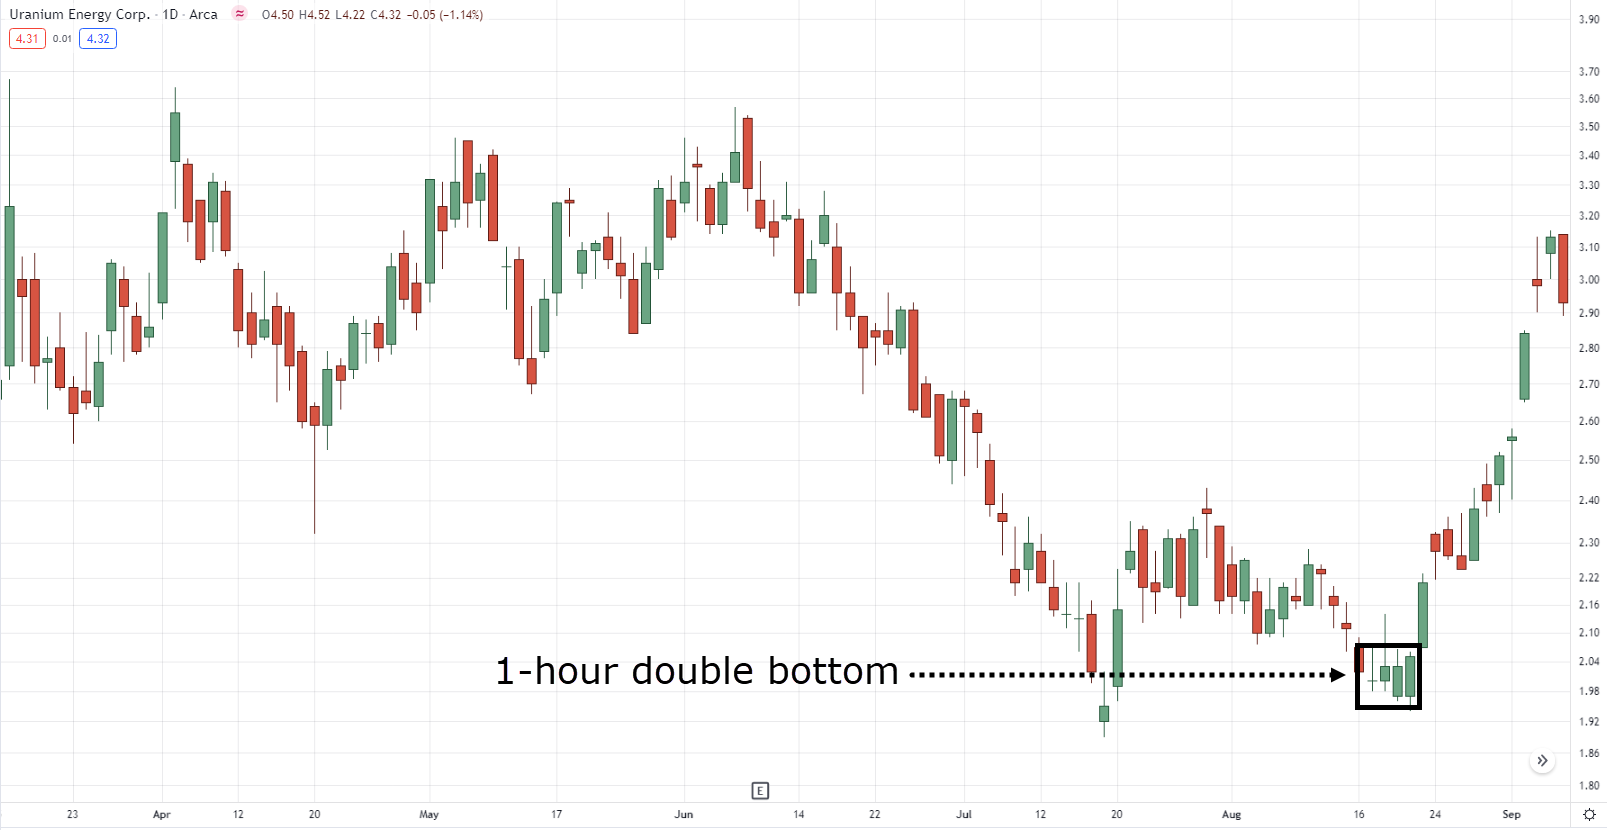
But on the higher timeframe, the whole pattern looks like this.
Double bottom from the 1-hour timeframe on UEC daily timeframe:
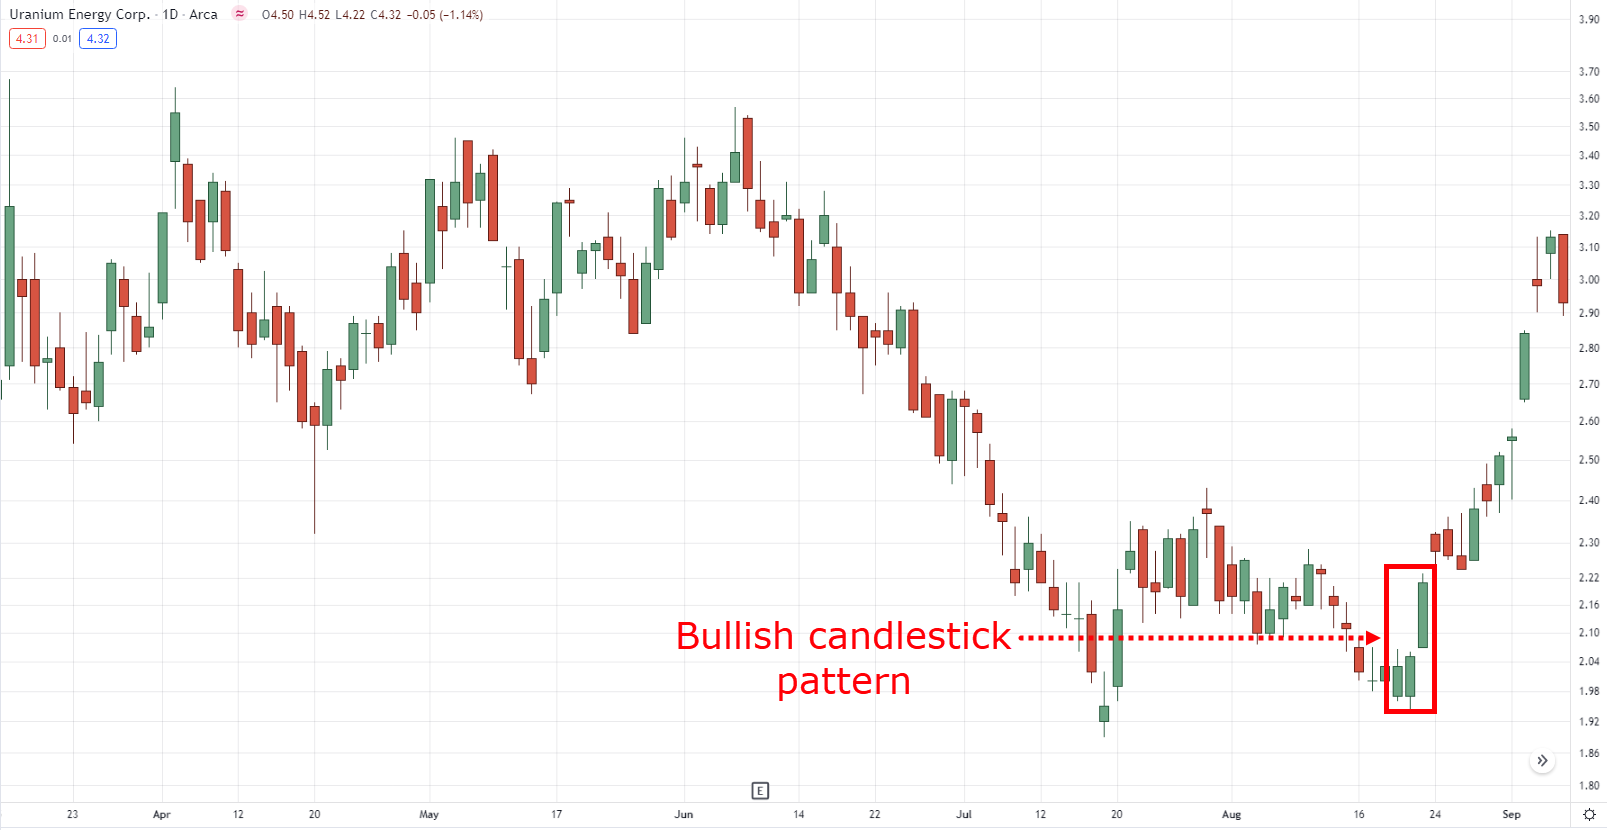
Bullish candlestick pattern on UEC daily timeframe:
Would you still consider it a bullish candlestick pattern?
Of course!
So can you see what I mean?
Just because a candlestick isn’t shown in the books doesn’t mean you’d ignore the trade!
Starting to make sense now, right?
So now that you know what a “real” bullish candlestick pattern is (again, it can be formless)…
What’s next?
Well, the next part is how exactly do you use them?
There’s no point in knowing what they look like if you can’t use them to make money off the markets, right?
So please keep reading, and let’s move on to the next section…
How To Find High-Probability Bullish Candlestick Patterns To Trade
To be able to have a complete trading strategy or a fully functioning trading business…
It’s essential to have these three things identified:
- Trading methodology
- Trading setup
- Trade management
Let me ask you…
Where do bullish candlestick patterns come into these three?
Know the answer?
Well…
The bullish candlestick patterns come under trade management.
That’s right; bullish candlestick patterns are meant to be used to time your entries and exits to get into the trade.
On the other hand, if you spend too much time knowing your entries and exits but don’t know who you are as a trader…
Then you can expect to have inconsistent results no matter how bullish your candlestick patterns are.
What do I mean?
It means that bullish candlestick patterns should only be a small part of the equation and shouldn’t be traded in isolation.
So, let me help you out and break down how you can go about trading bullish candlestick patterns from top to bottom.
1. Trading methodology
Knowing what you want to get out of the markets is a crucial first step towards consistency.
So, if you’re the type of trader who wants to capture one leg of the move or prefers to have fixed targets…
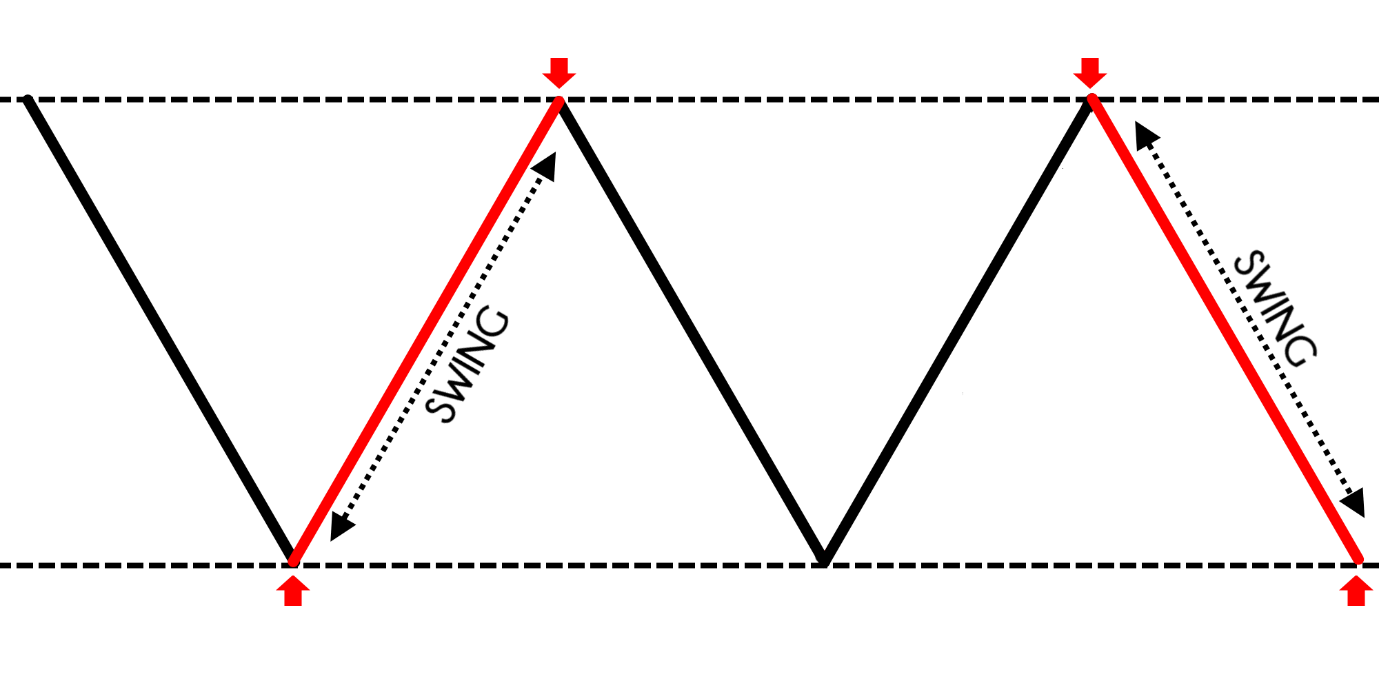
Swing trading might be for you.
On the other hand, if you’re the type of trader who wants to capture long-term trends and prefers to trail your stop loss…
Then trend following might be for you.
I’m sure there are a lot more trading methods out there, so if you want to learn more, you can check this article out: 5 Types of Forex Trading Strategies That Work
Nonetheless, there are no “best” trading methods out there, but the best one for you.
So how to know the best one, you may ask?
Try out a lot of them, of course!
Only by knowing what you don’t want will you know what you truly want!
It will take time and effort, but that’s what trading is all about — a journey.
Next, what is your trading setup?
2. Trading setup
Whether you use indicators or zodiac signs to enter your trade, it usually only comes down to these two:
- Pullback setup
- Breakout setup
Let me explain…
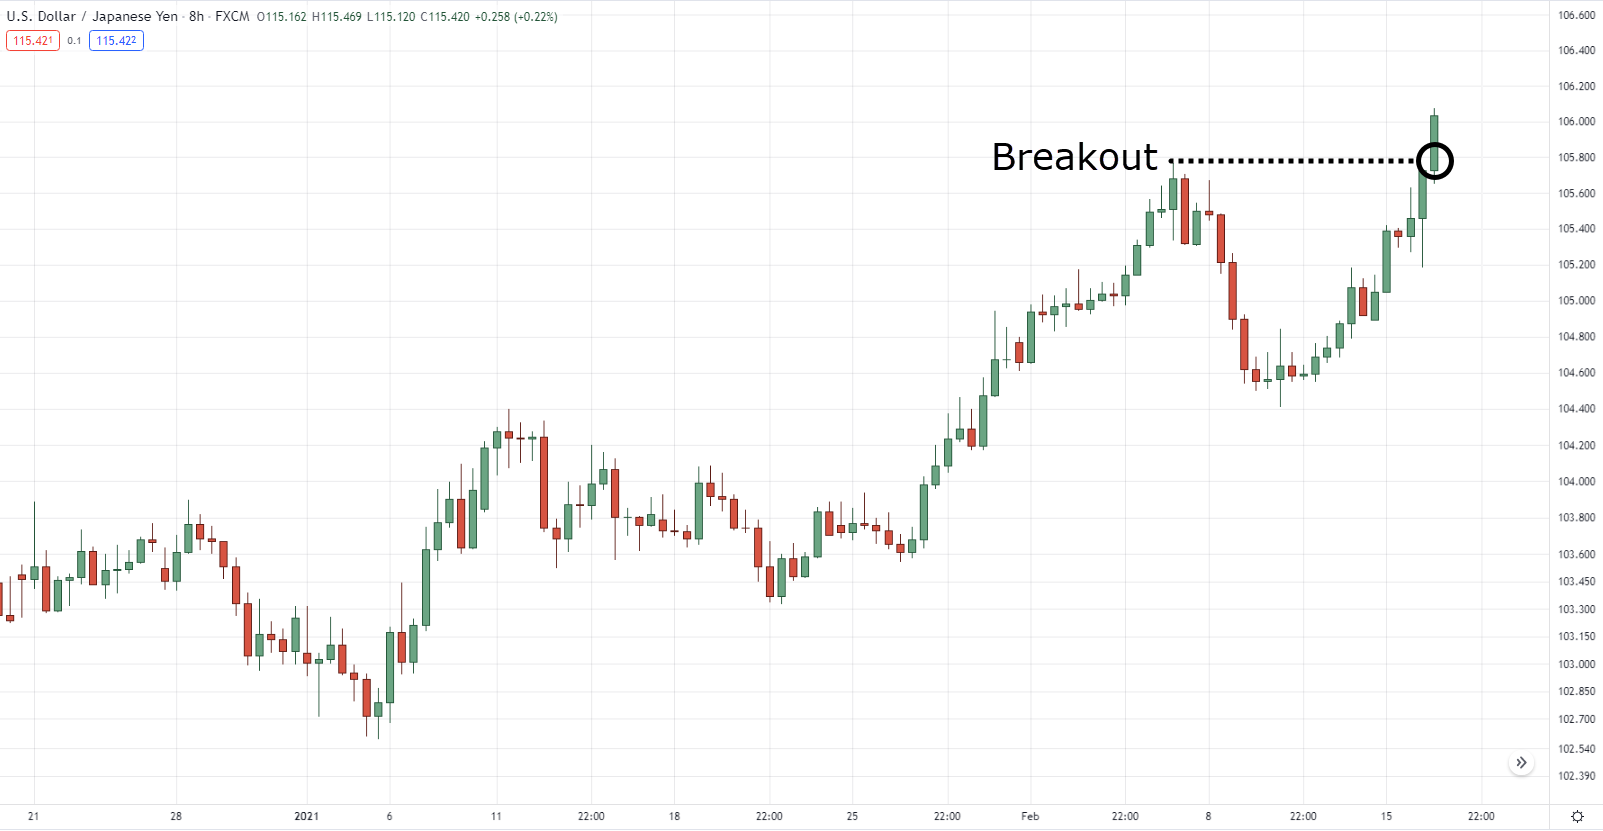
Trading breakouts means that you’re looking for confirmation.
Breakout on USDJPY 8-hour timeframe:
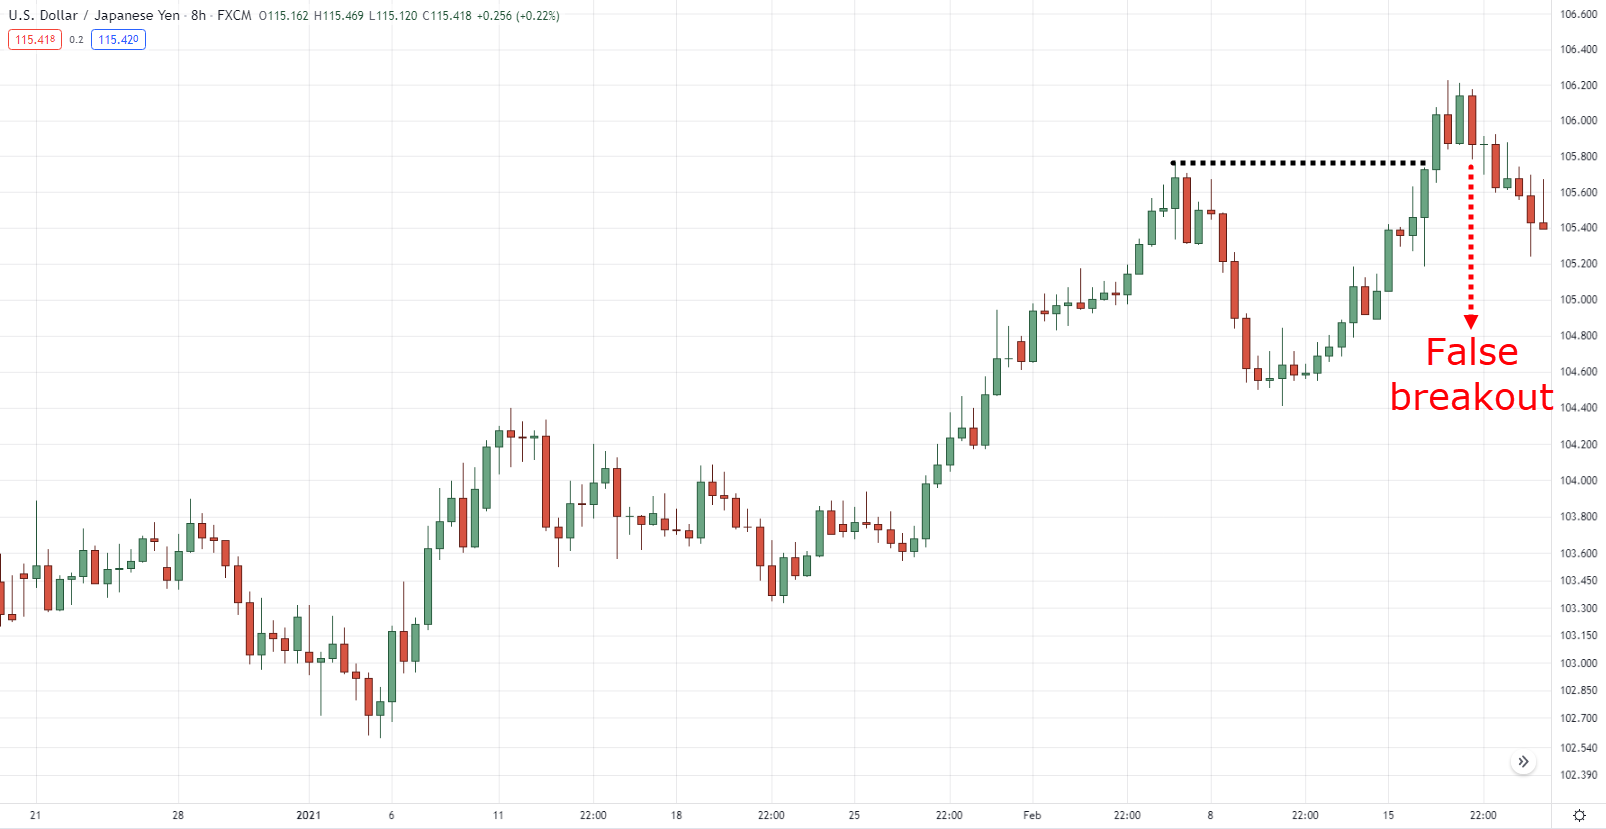
However, the downside is that it can turn into a “false breakout.”
False breakout on USDJPY 8-hour timeframe:
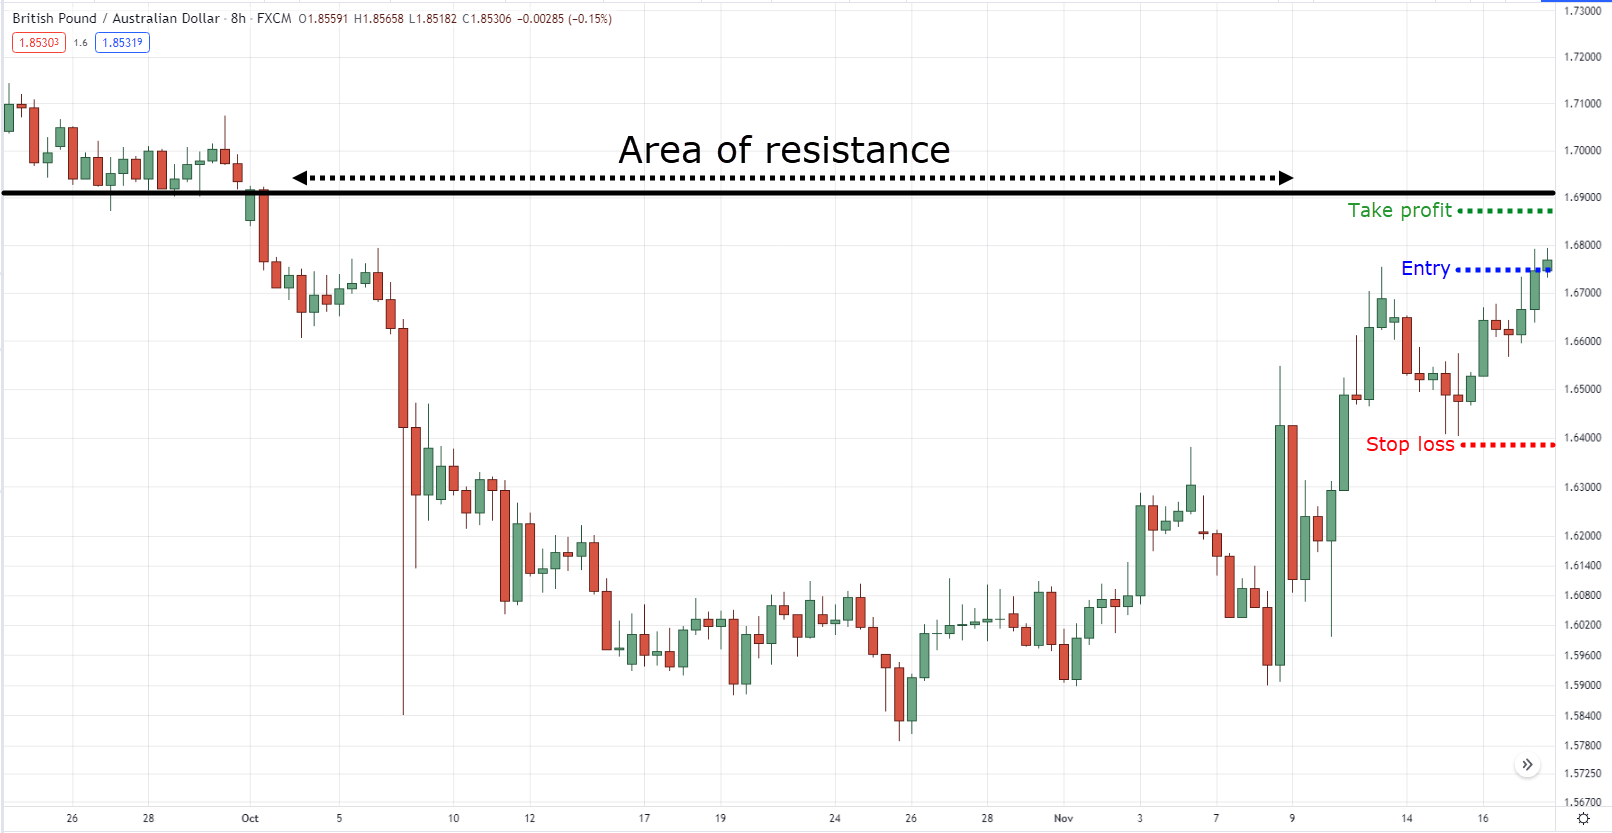
And there’s less flexibility on how you want your risk to reward ratio to be.
Poor risk to reward ratio breakout setup on GBPAUD 8-hour timeframe:
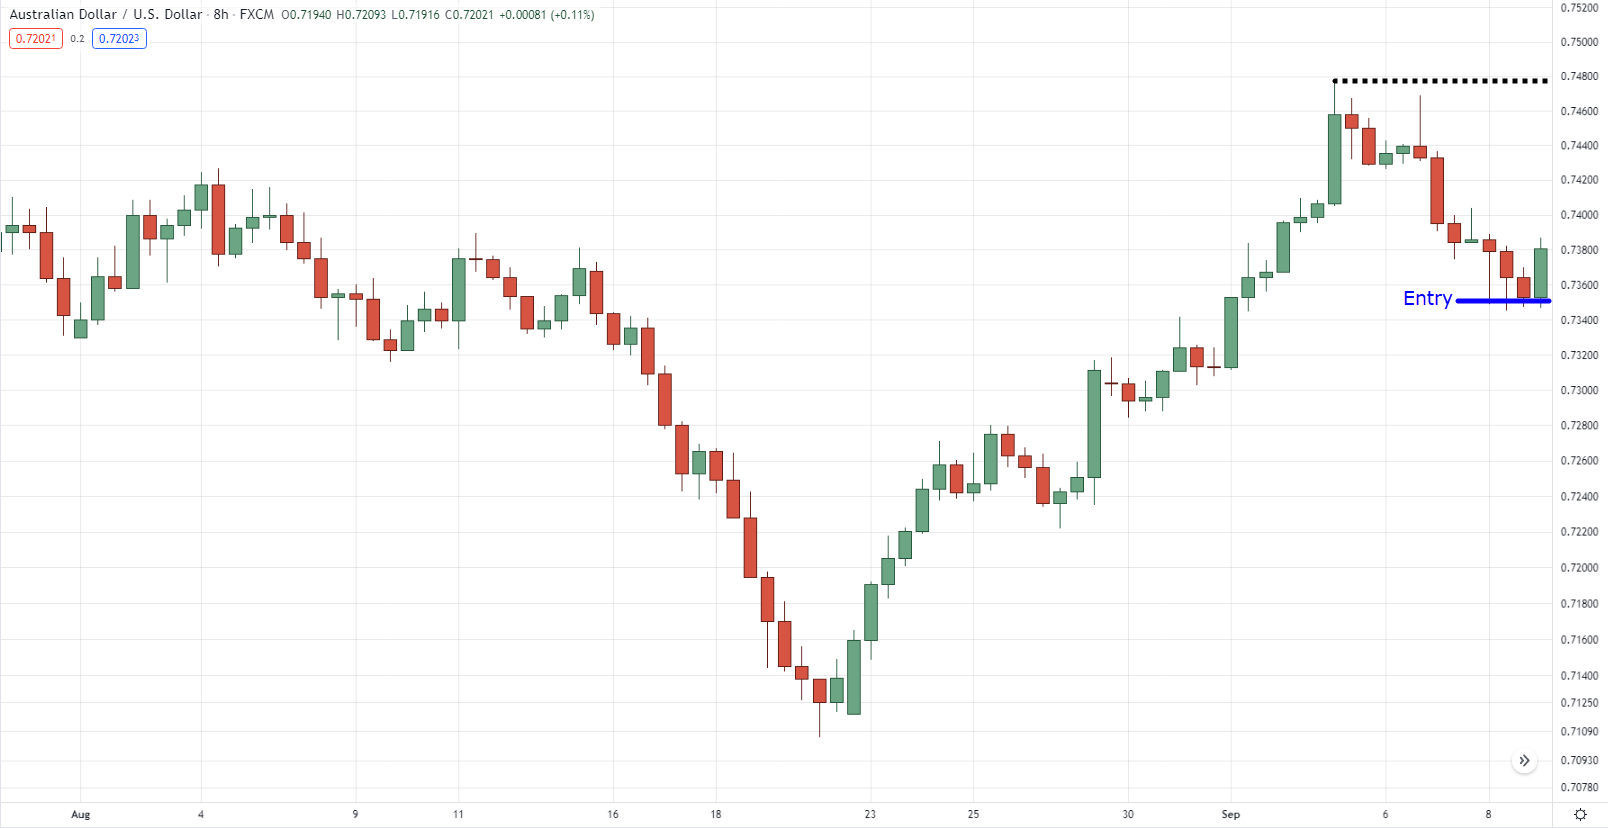
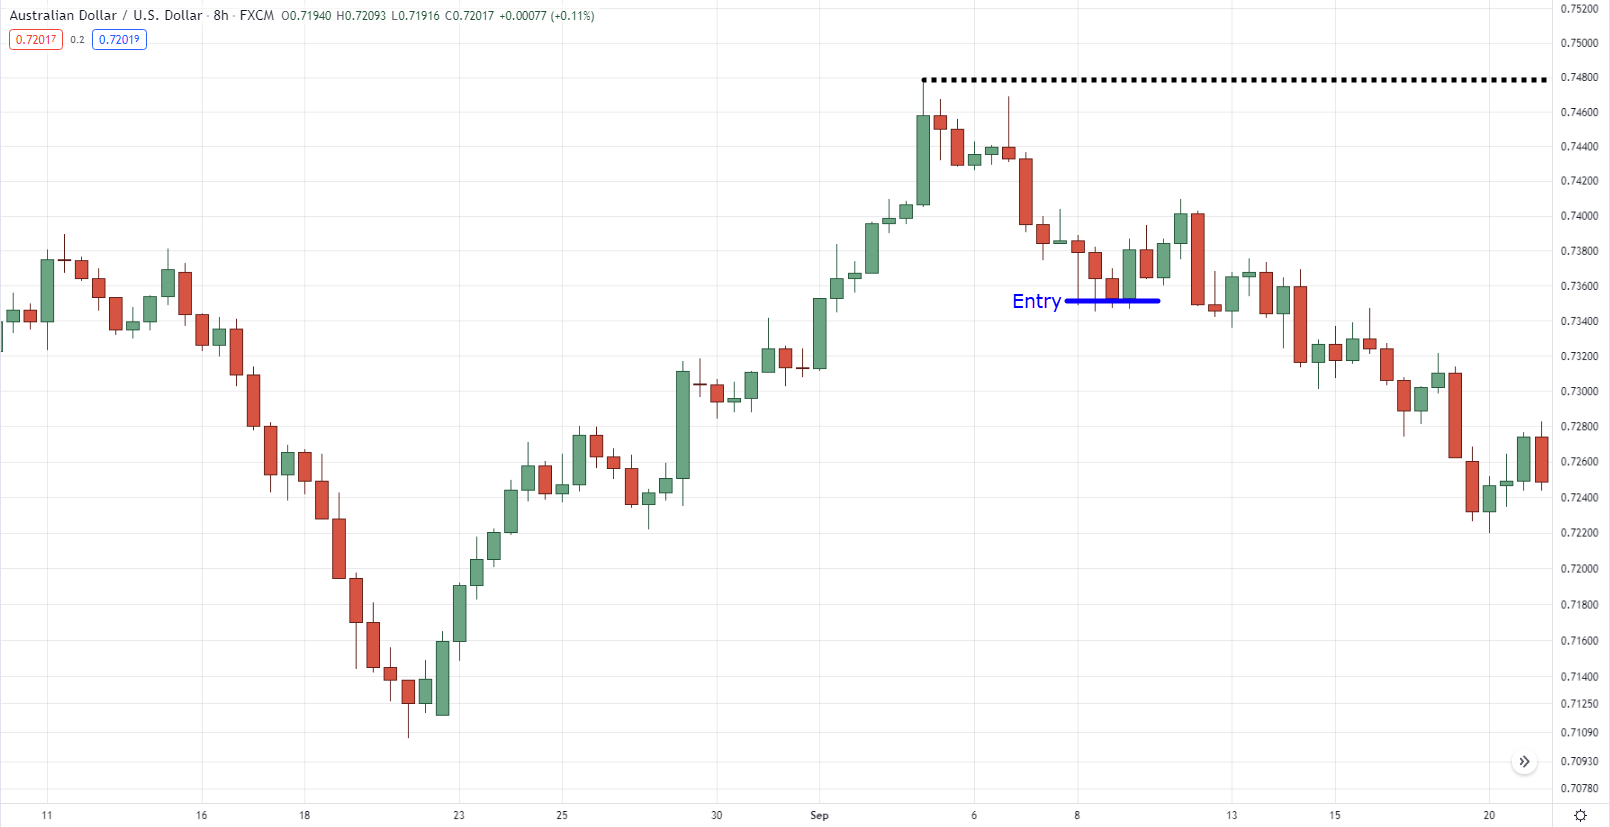
On the other hand, buying on pullbacks means that you’re waiting for the price to come to you before you enter a trade.
It’s like waiting for fuel prices to go down first before you chug in a full tank on your car!
Pullback setup on AUDUSD 8-hour timeframe:
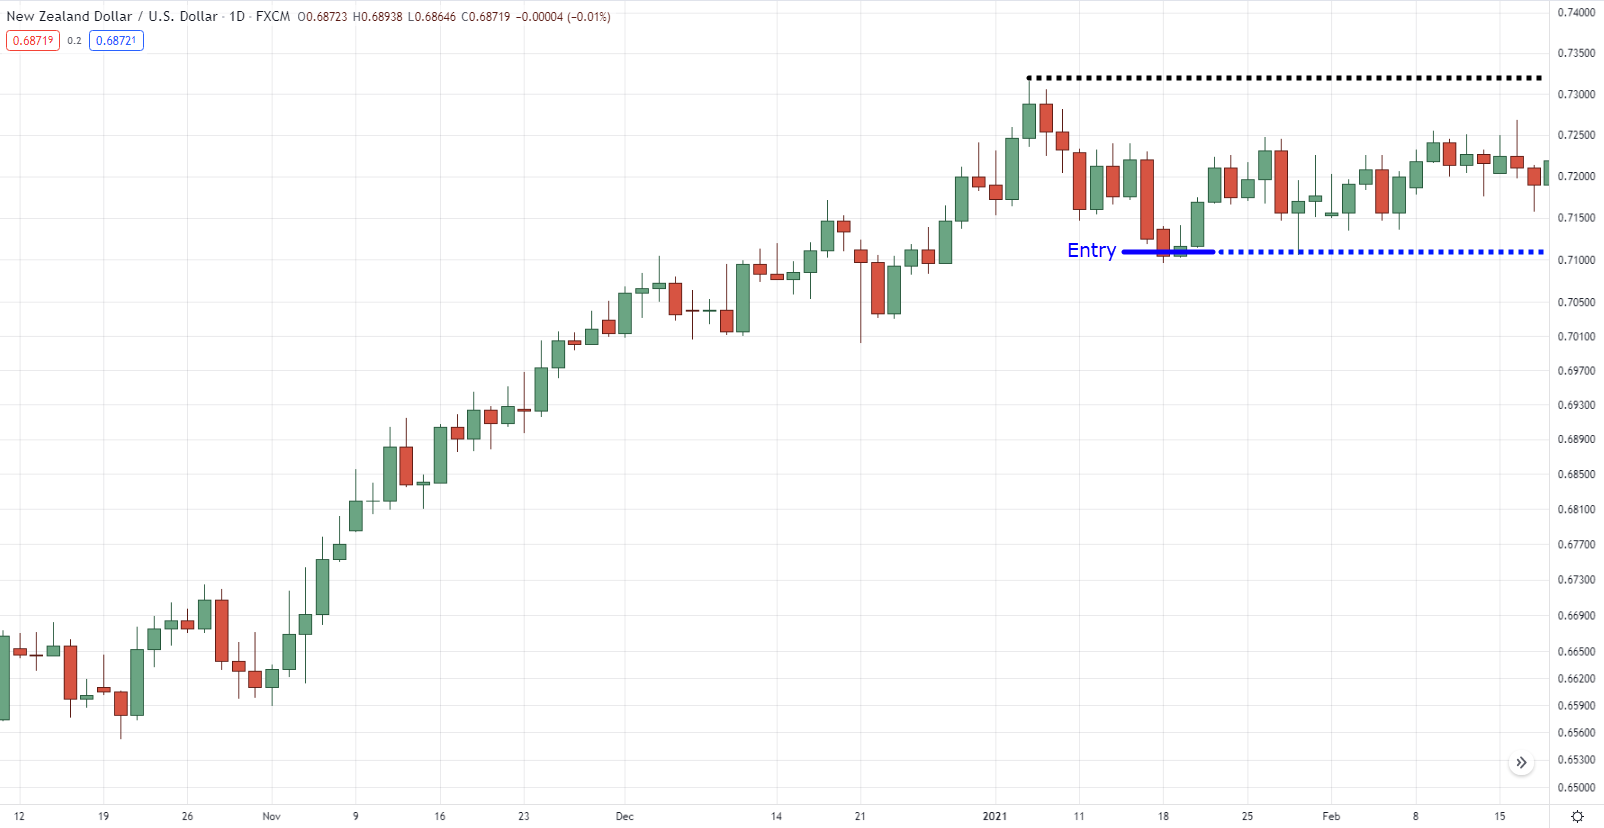
But then again, the downside is that the pullback that you entered may not move for a long time.
Long pullback setup on NZDUSD daily timeframe:
Worse, there’s also a chance that a pullback can even go against you almost immediately!
Failed pullback setup on AUDUSD 8-hour timeframe:
Now…
You should notice already that I don’t only show you the pros but also the cons.
It’s because, in truth, every concept out there has them!
There’s no such thing as a strategy or chart pattern that works all the time!
So how you weigh in those pros and cons to decide which one you’d use consistently is different from mine.
That’s why I’m giving you the privilege to decide which setup you should use.
3. Trade management
It’s is the part you’ve been waiting for, as this is where bullish candlestick patterns come in!
So, determining how to use bullish candlestick patterns as entries will depend on your trading setup.
Let me give you an example.
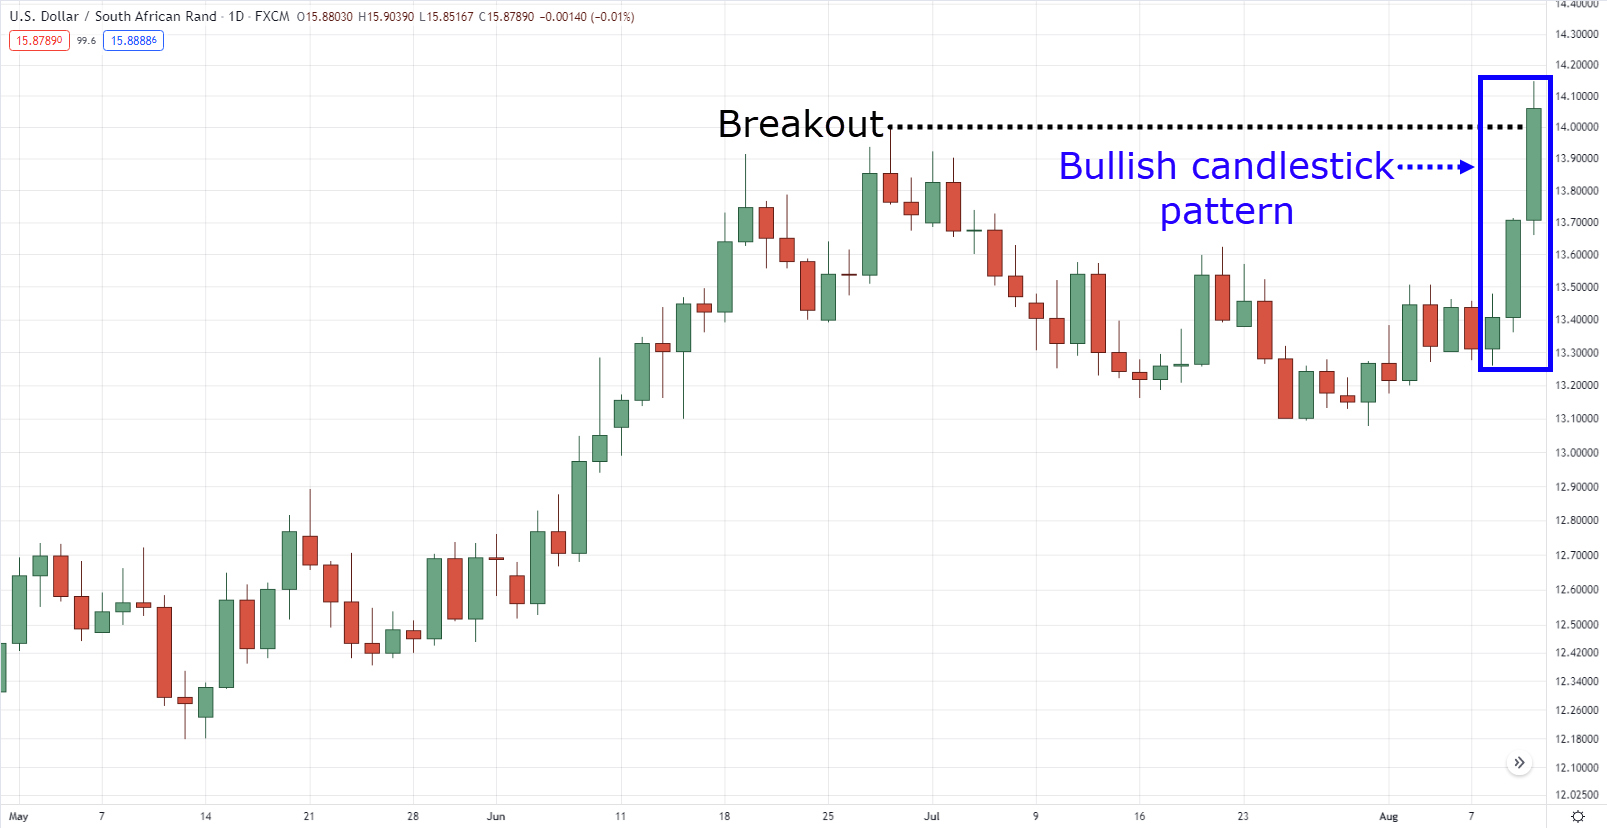
If you trade breakouts, then you’d want to make sure that the candlestick at the breakout is bullish relative to the previous ones.
Strong breakout on USDZAR daily timeframe:
You can say that the candlestick is a variation of the three soldiers’ candlestick patterns.
But the main highlight here is that the third breakout candle stands out than the rest!
This concept couldn’t be more critical if you’re trading pullbacks.
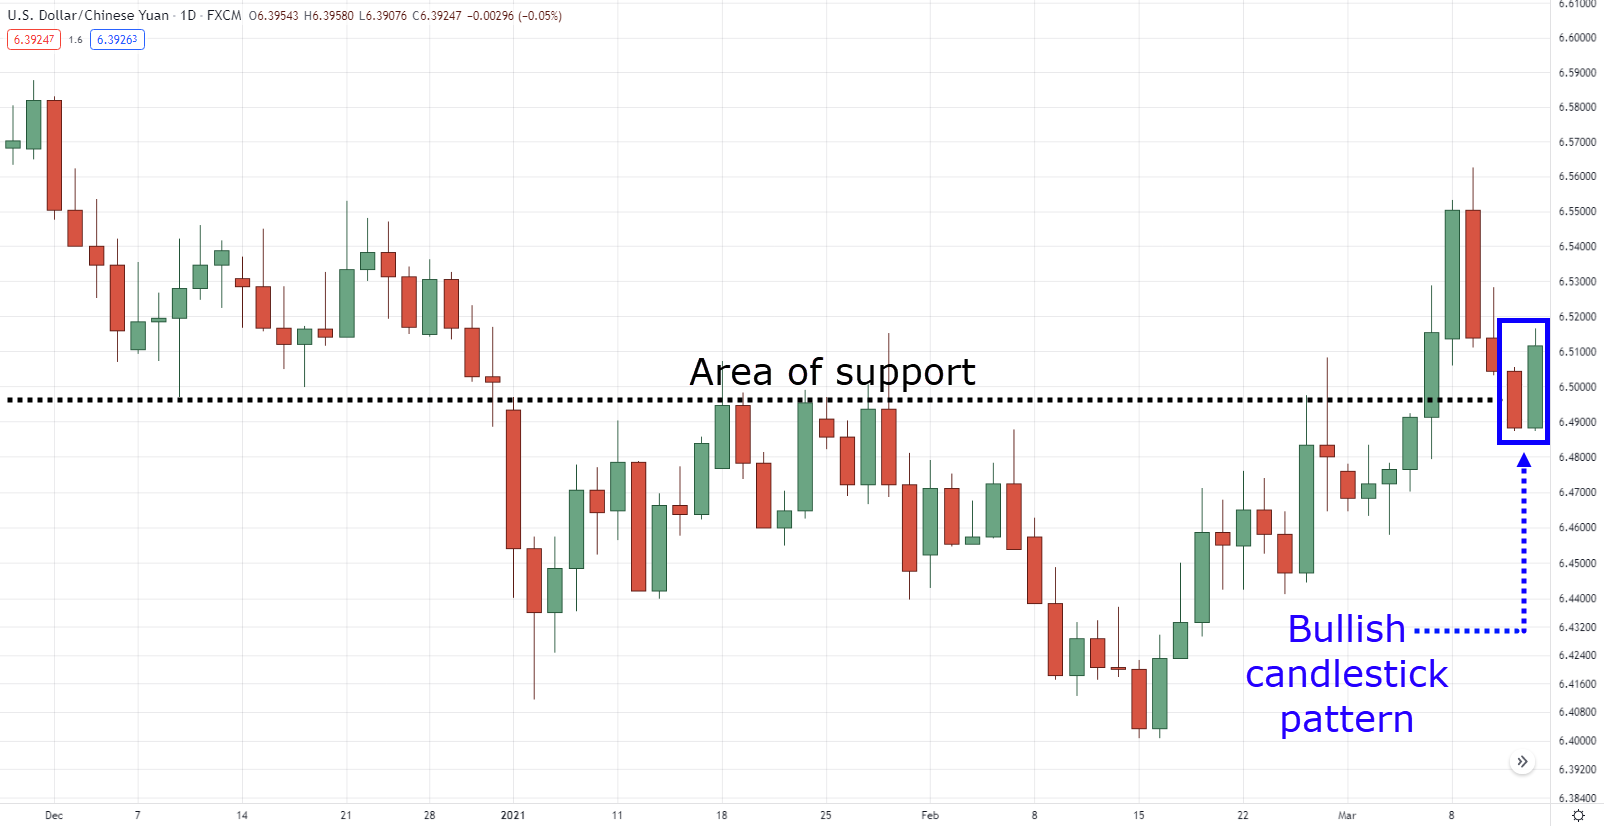
Because if you’re willing to enter trades at the lows, you want a bullish candlestick pattern present before you enter a trade.
Here’s an example.
Pullback setup on USDCNH daily timeframe:
Now for exits.
The key here is that how you exit your trade should depend on your chosen trading method.
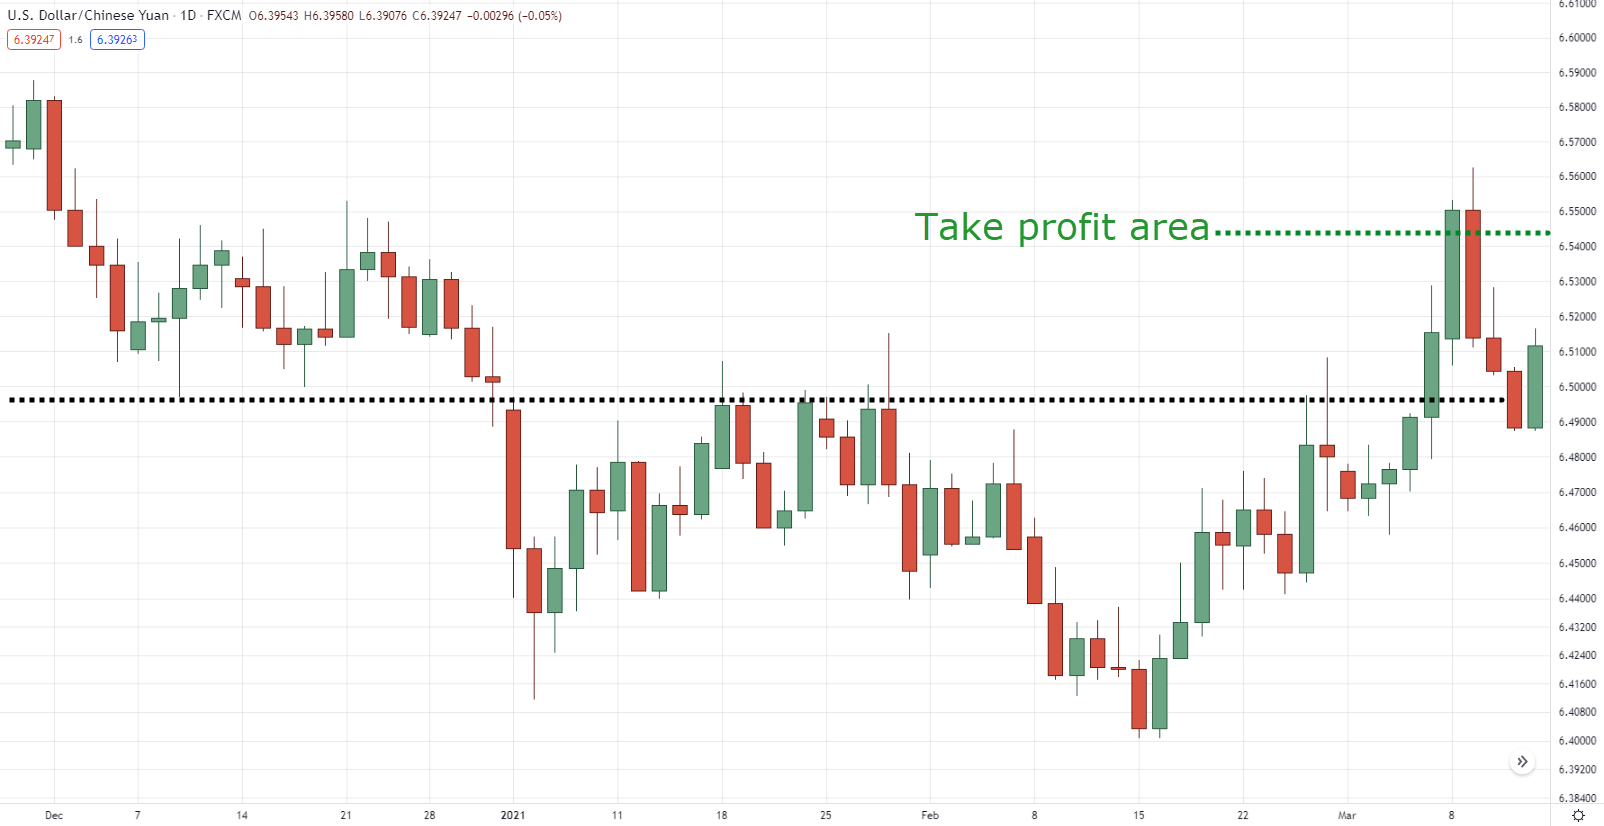
So if you’re a swing trader, then consider taking your profits before the area of resistance.
Swing trading setup on USDCNH daily timeframe:
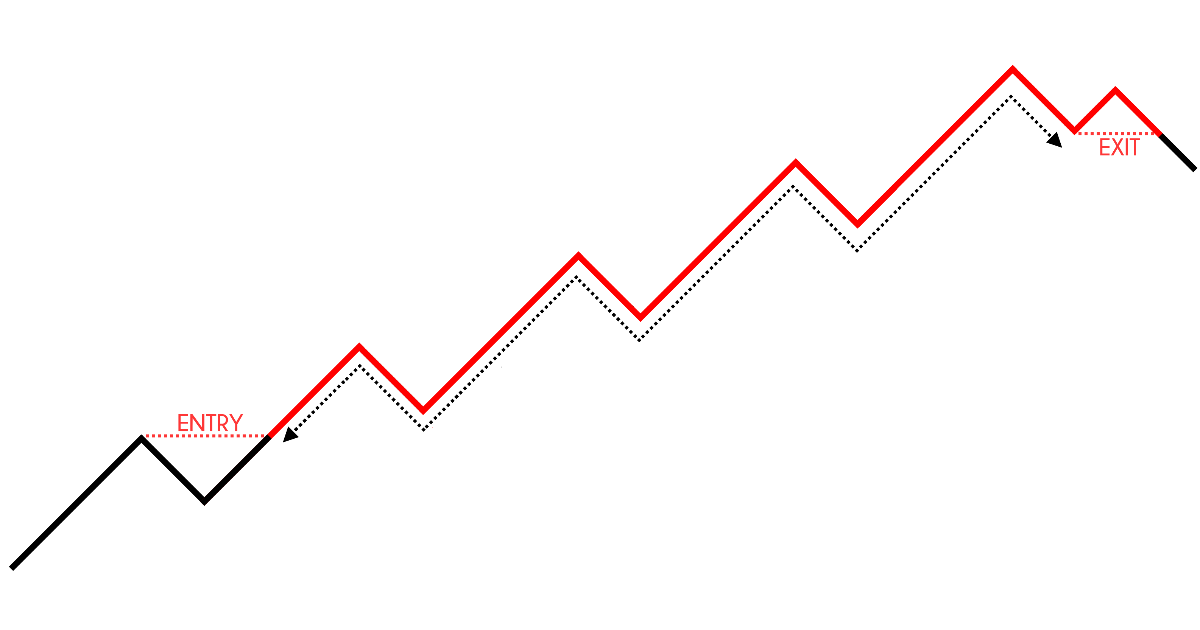
And as a trend follower, using a trailing stop loss would be much more relevant than taking fixed target profits.
Trend following setup on USDZAR daily timeframe:
I know it didn’t have any bullish candlestick patterns in it.
But it wouldn’t be fair if I taught you how to enter trades and not how to exit them, right?
Nonetheless, the bottom line is this:
Bullish candlestick patterns should never be traded in isolation because bullish candlestick patterns aren’t a complete strategy in itself.
You’re probably thinking right now:
“Okay, so if bullish candlestick patterns aren’t a strategy in itself, how about you show me a strategy!”
Don’t worry.
In the next section, I’ll finally share with you a couple of complete strategies that utilize the power of bullish candlestick patterns.
So keep reading, and let’s get right into it…
Bullish Candlestick Pattern Strategies That Work in Different Markets
Everything you’ve learned so far comes down to this section, so it’s time to use what you have learned so far!
Now I know that there’s a high chance you either trade stocks, forex, or crypto.
So I’ll be extra kind to you and give you strategies for each of those markets.
Strategy #1: Stock market trend-following
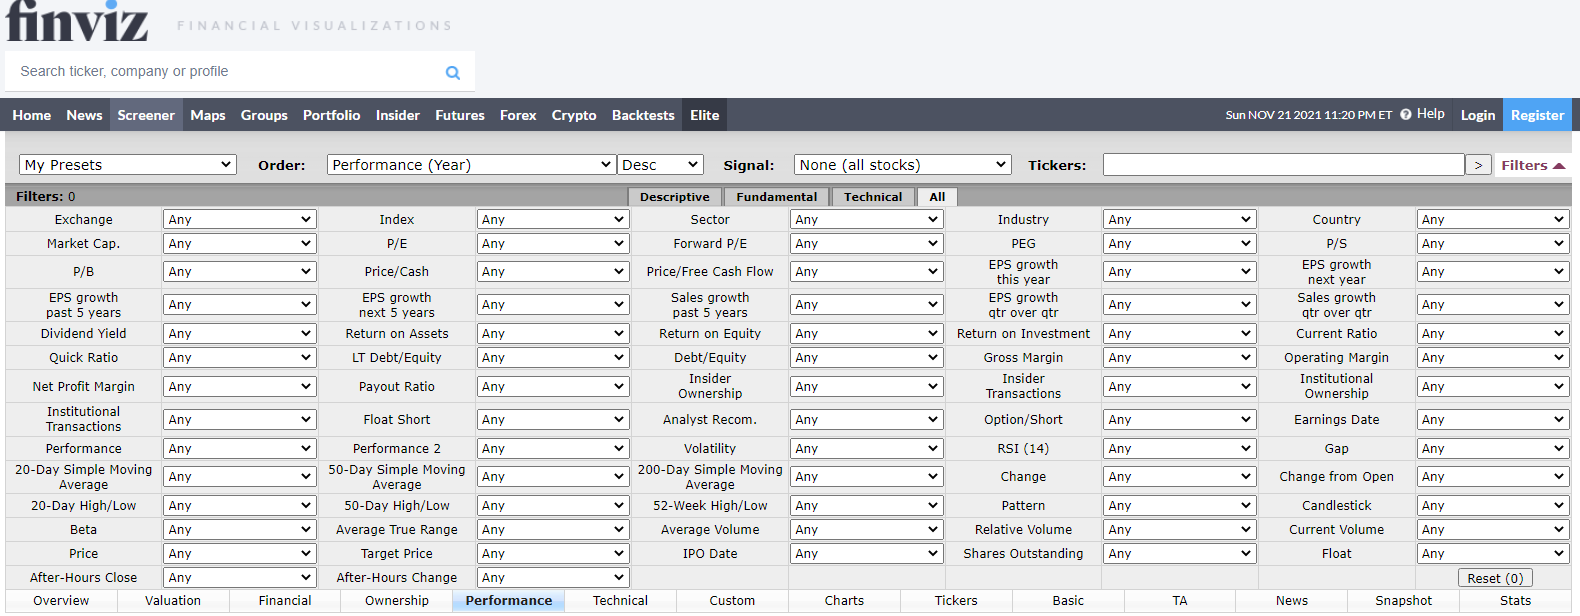
I’m sure you know that there are thousands of stocks out there—that’s why to filter out the “high-quality” stocks out there, you must use a screener such as finviz.
Finviz screener:
At first glance, it’s like going into an airline cockpit without knowing which buttons to press.
But the key here is to know what your trading method is, then pick relevant parameters that meet your trading method’s objective.
It makes sense, right?
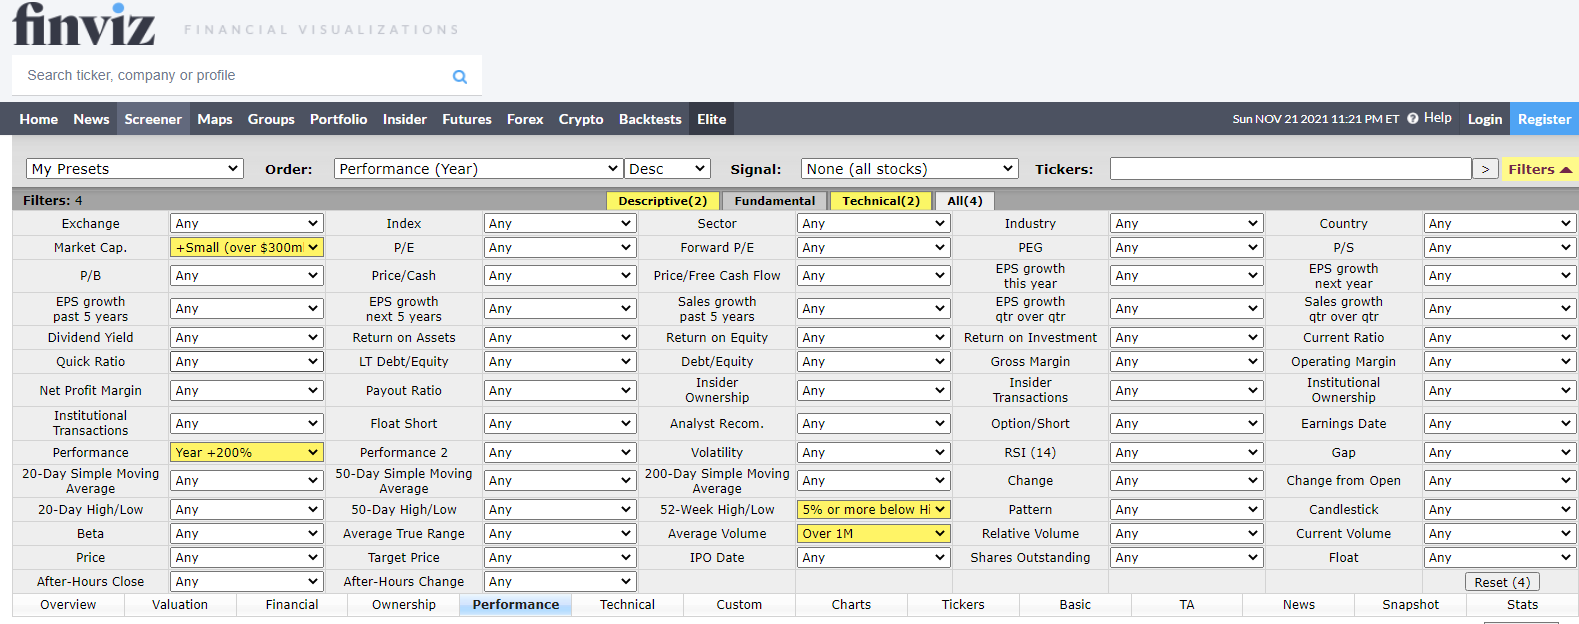
In this case, we’ll look for stocks that are already performing well and at the same time has good volume and room for growth (small cap)…
Finviz screener parameters:
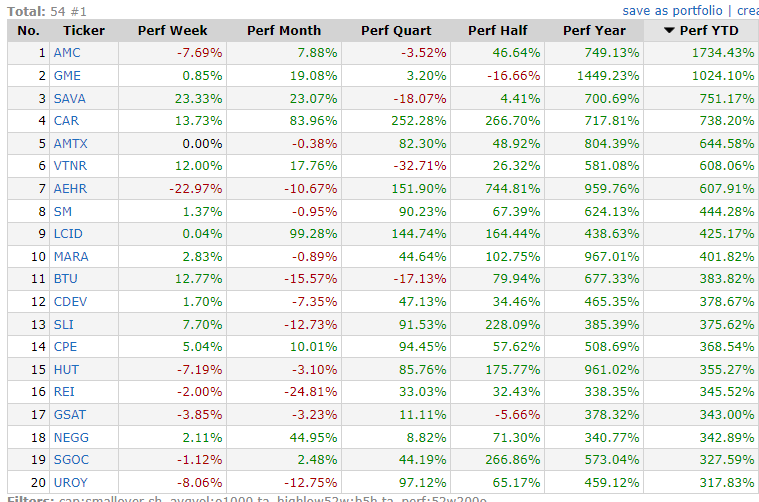
The next thing you should do is look for setups that are at the top 10 stocks on the list and prioritize stocks that has the best performance so far.
Finviz screener results:
So what’s the setup, you may ask?
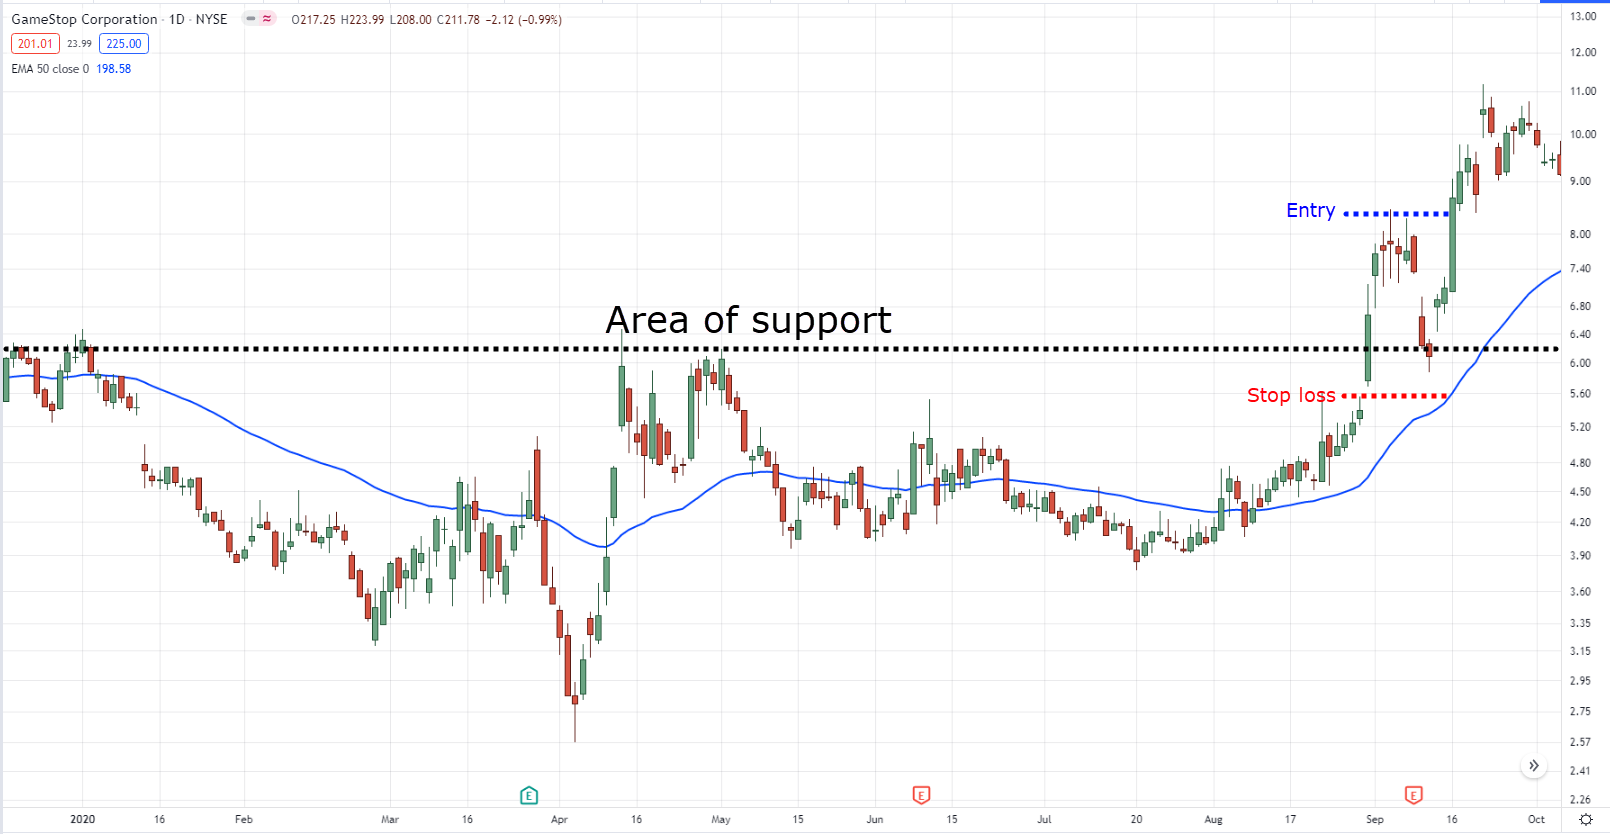
If you are a trend follower, you can consider using a breakout entry setup.
Breakout setup on GME daily timeframe:
Notice how the bullish candlestick pattern sticks out before we entered the trade?
Good, because if it showed a small or indecision candle, then you would’ve ignored the trade instead!
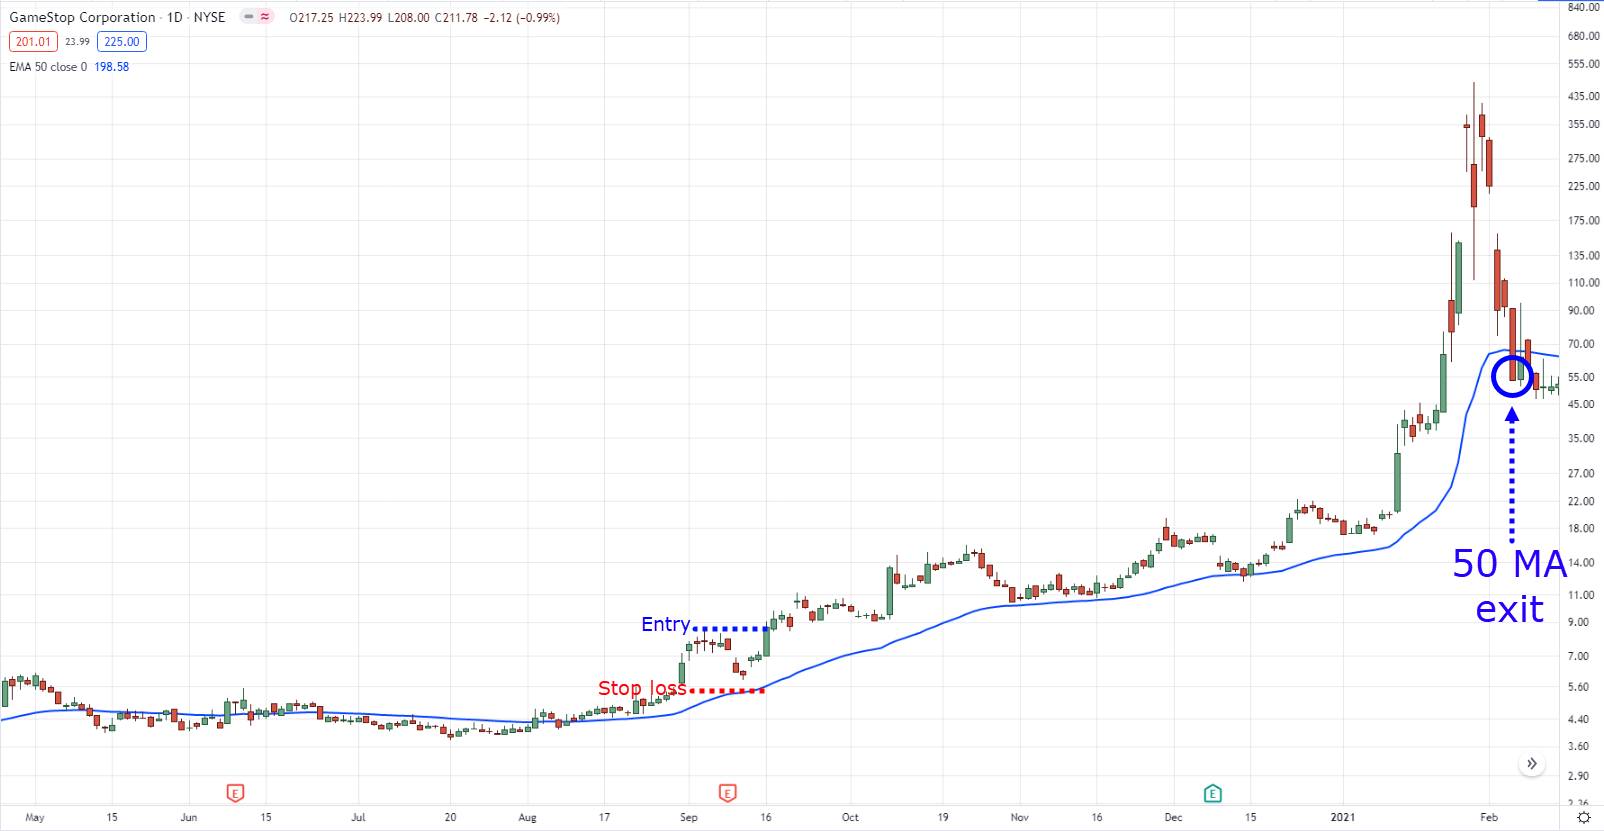
As for the exits, you can consider using a 50-period moving average as a trailing stop.
Breakout setup on GME daily timeframe:
Of course, being a trend follower doesn’t mean you are limited to breakout setups.
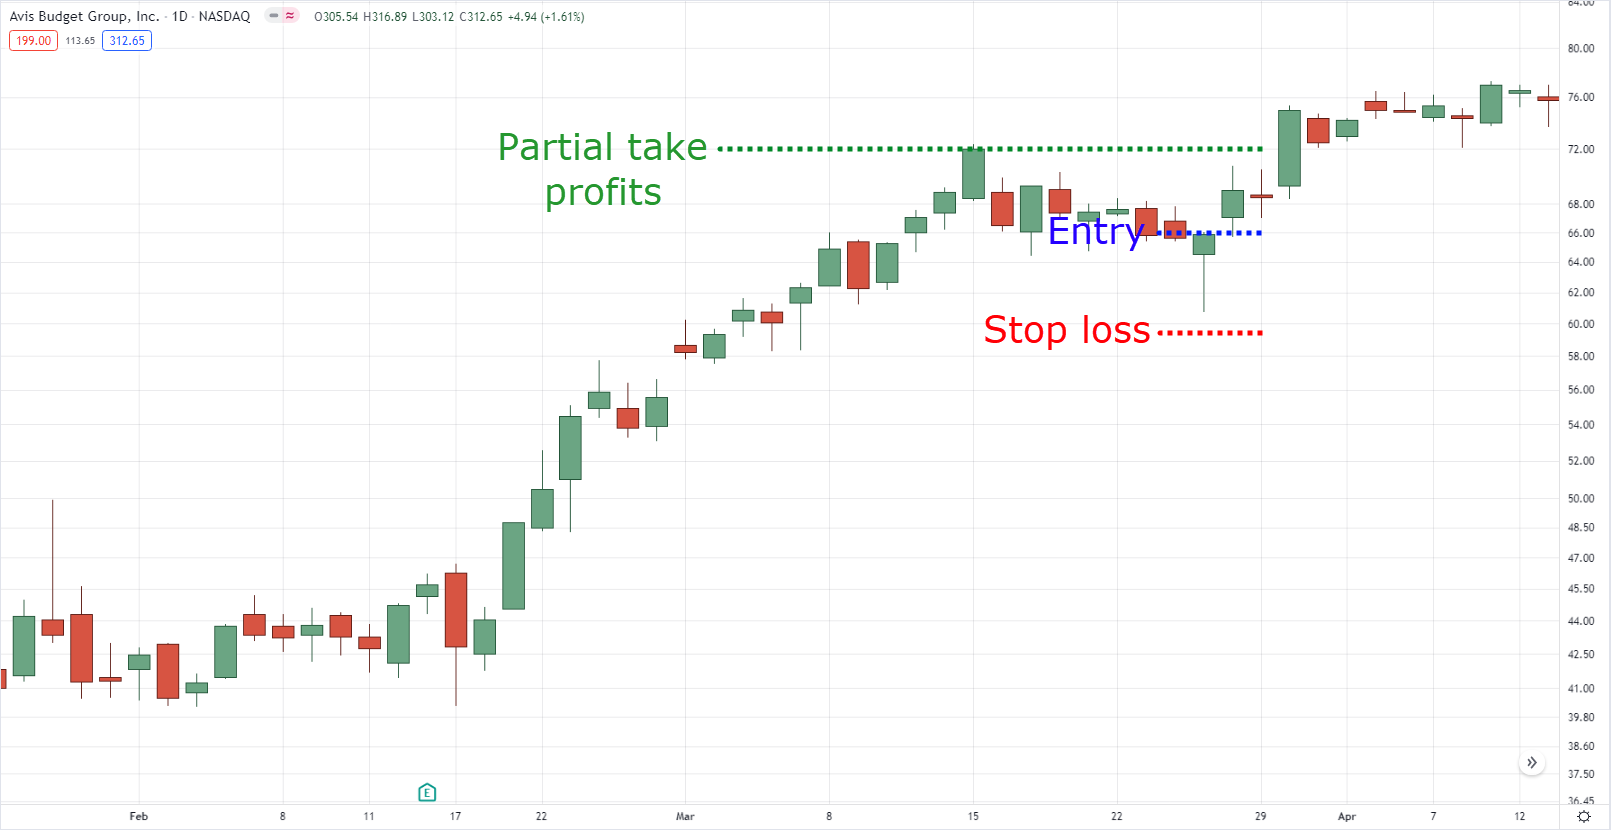
You can also consider entering on pullbacks then selling half of your position before the breakout point.
Pullback setup on CAR daily timeframe:
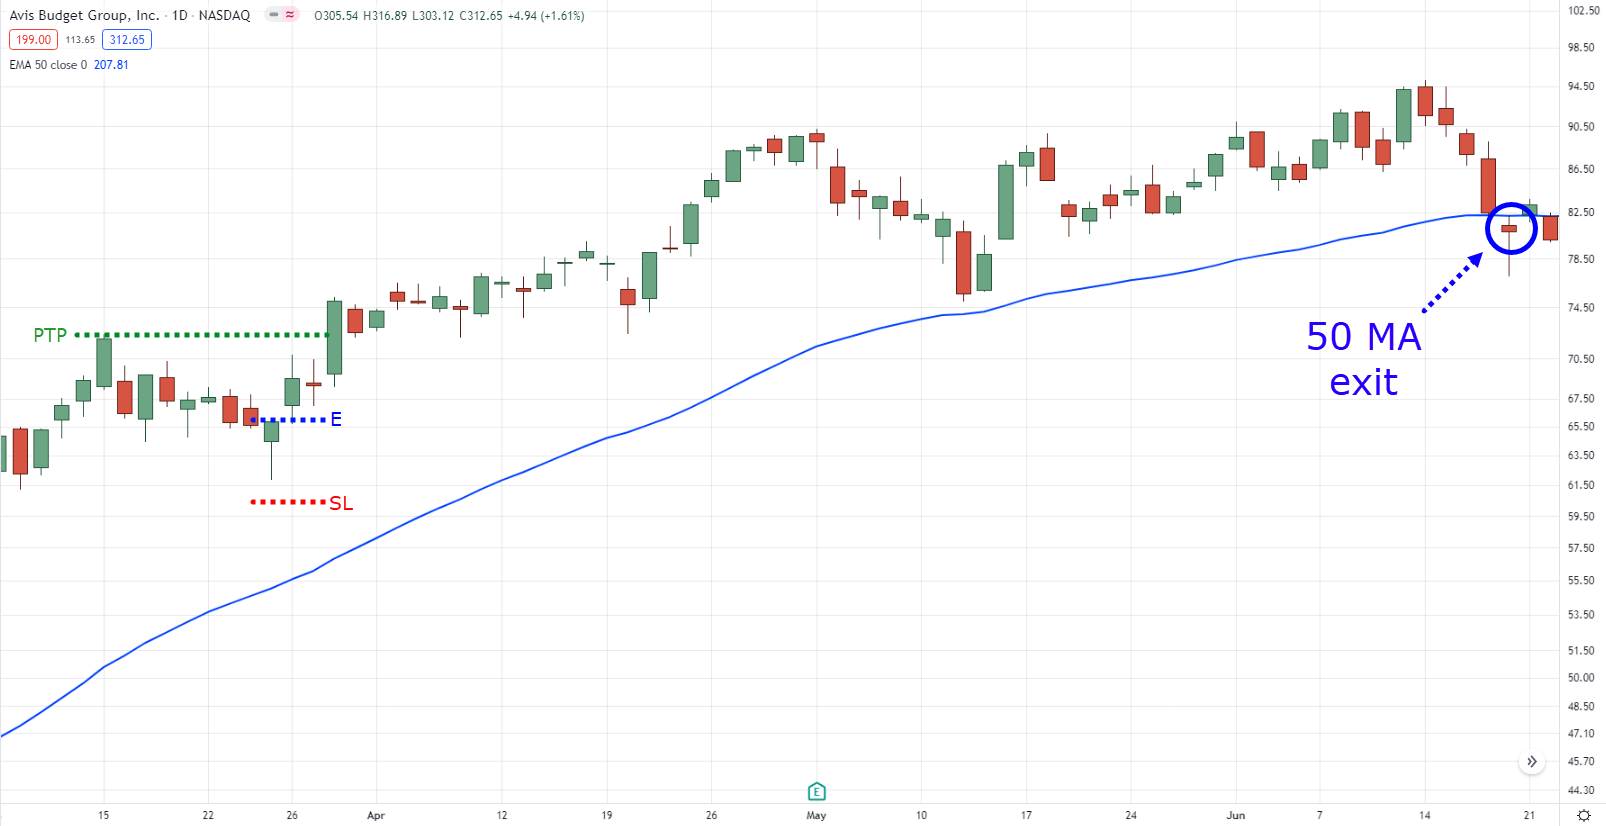
Then finally, trailing your stop loss.
Trailing stop loss on CAR daily timeframe:
Pretty advanced stuff, right?
Strategy #2: Forex market swing trading
Compared to the stock market…
We can’t just use a screener as there are probably less than a hundred pairs out there.
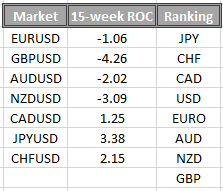
Instead, we’ll be using a currency strength meter.
Currency strength meter result:
How do we use it?
Simple, pair the strongest and weakest pairs, then trade them!
If you’re wondering how to create a currency strength meter, you can learn how to make one here in this article: The Essential Guide to Currency Strength Meter
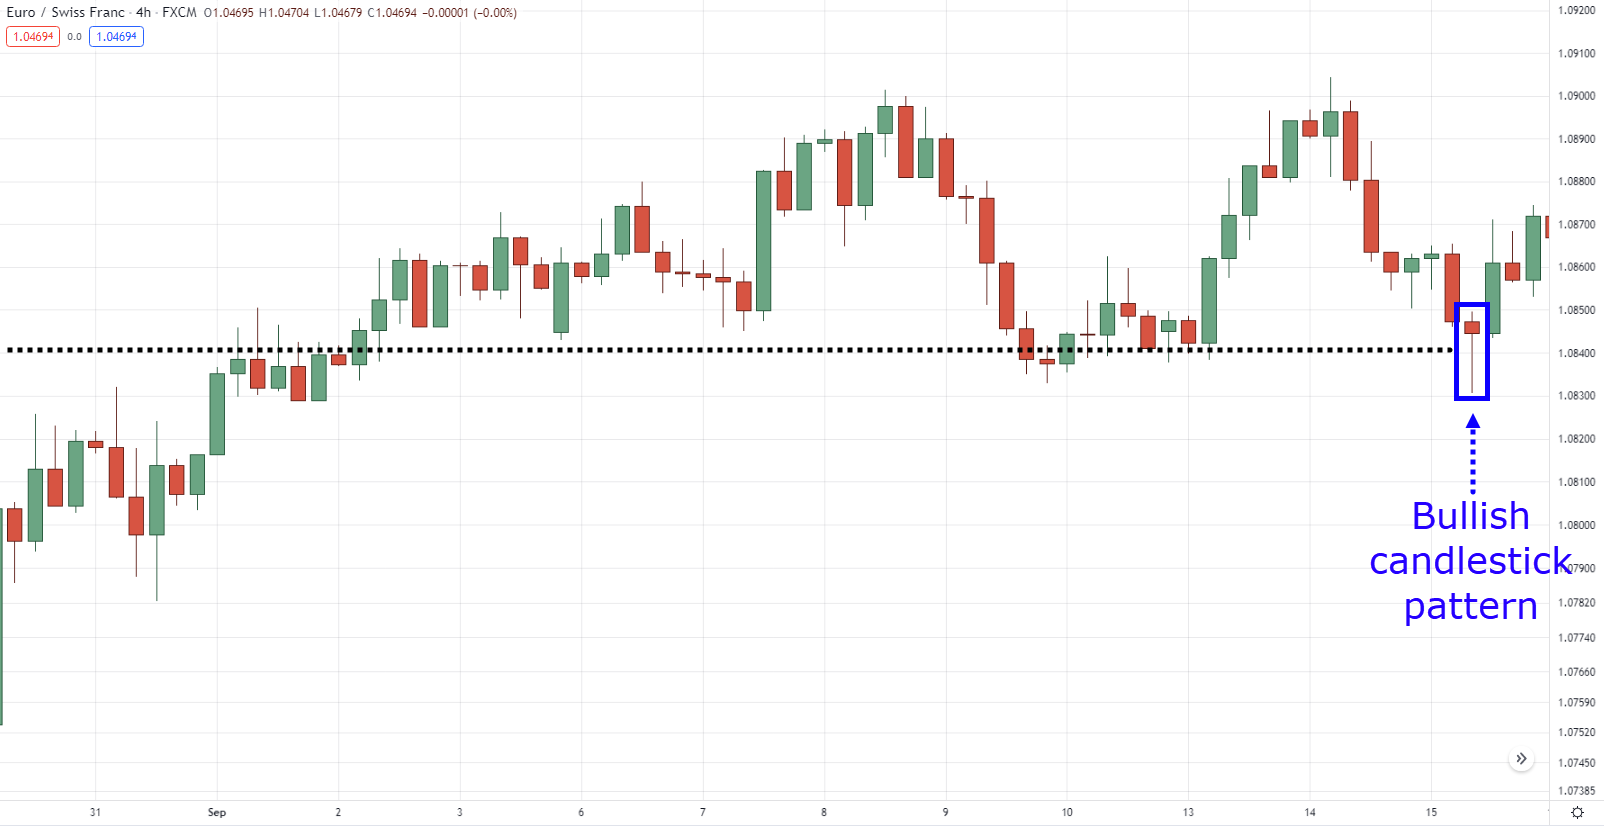
If you are a swing trader in the forex markets, you’d want to consider waiting for the price to reach an area of value.
Swing trading setup on EURCHF 4-hour timeframe:
Again, notice how we waited for the price to make a bullish candlestick pattern before entering the trade?
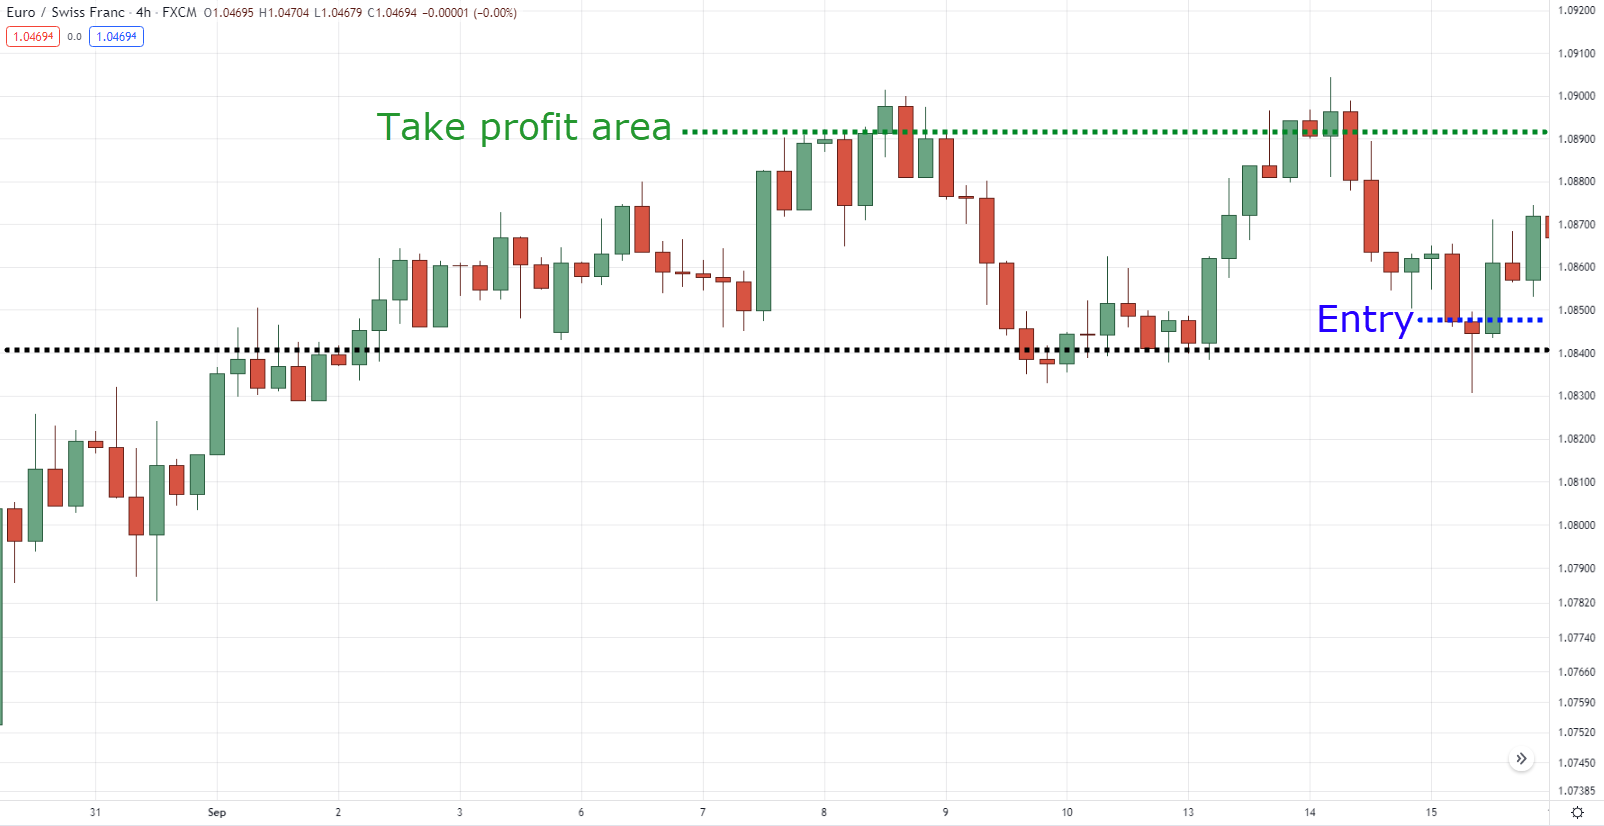
Finally, you can consider taking your profits before resistance before selling pressure comes in.
Swing trading setup on EURCHF 4-hour timeframe:
Next.
Strategy #3: Crypto market trend-following
At this rate, there are almost all new types of coins coming out in the crypto market.
The sad part is that they kept being hyped and ended up being a scam, just like a pump and dump!
How do you avoid this?
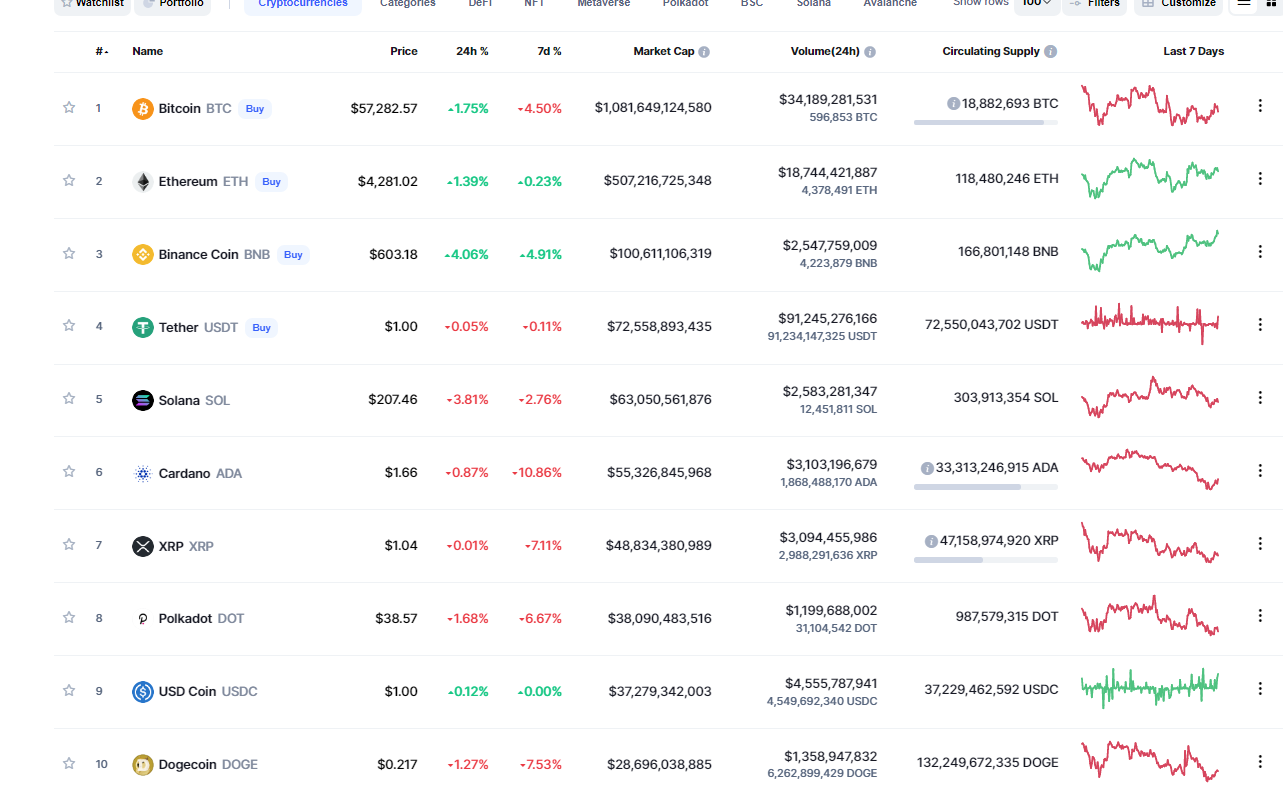
Simple, focus on the top 20 coins that have the highest market cap on them.
CoinMarketCap results:
I’ve only shown 10 since the image might take up too much space for this article, so I suggest you check all of them out here: CoinMarketCap
You see…
The longer the coin that’s already in existence, the higher the trust and the confidence investors have in that specific coin.
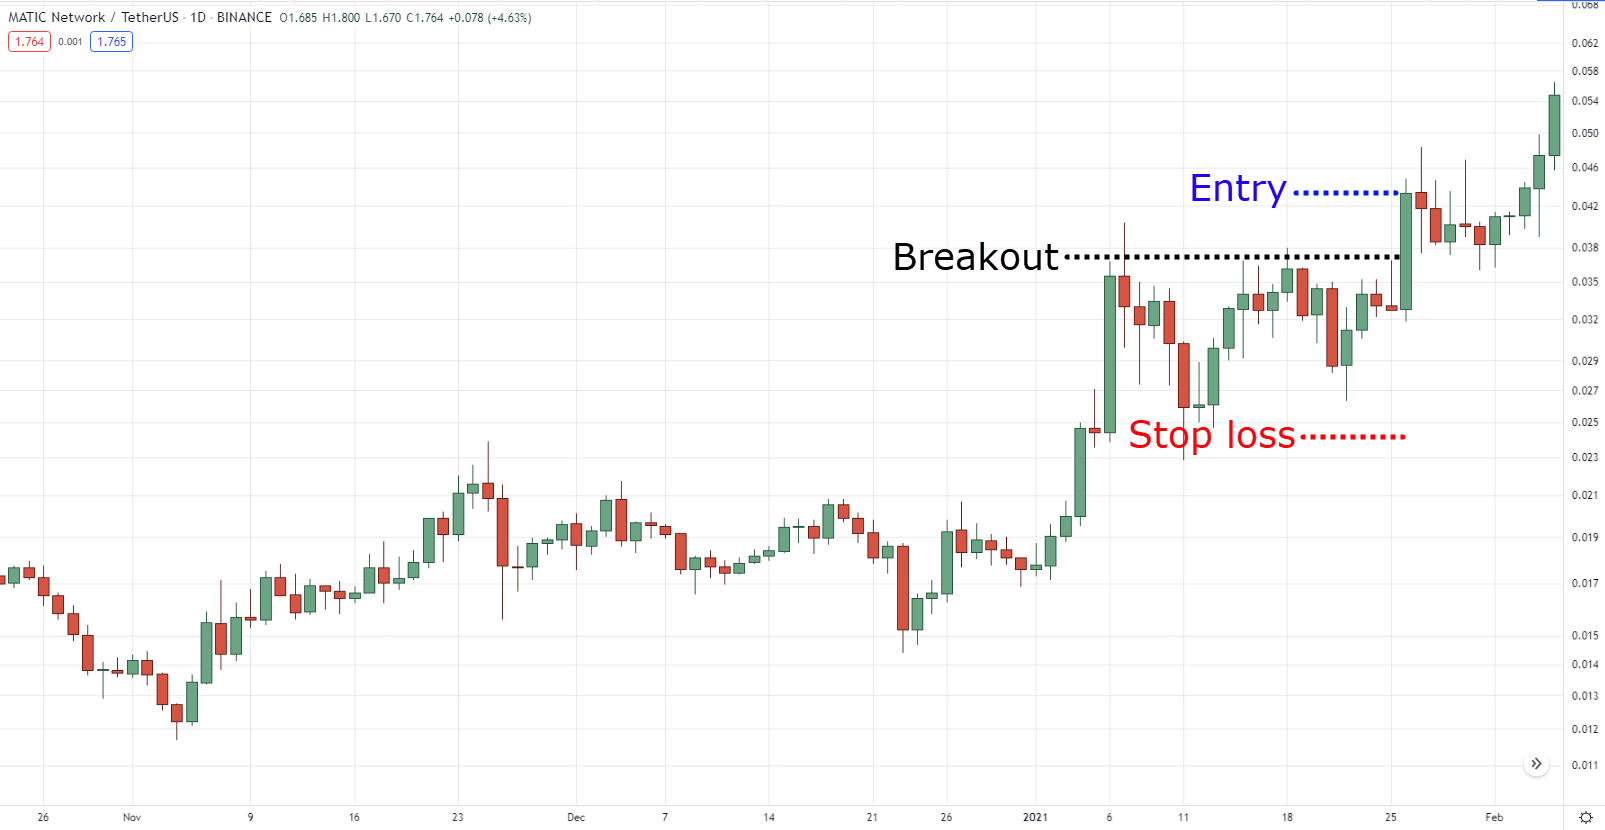
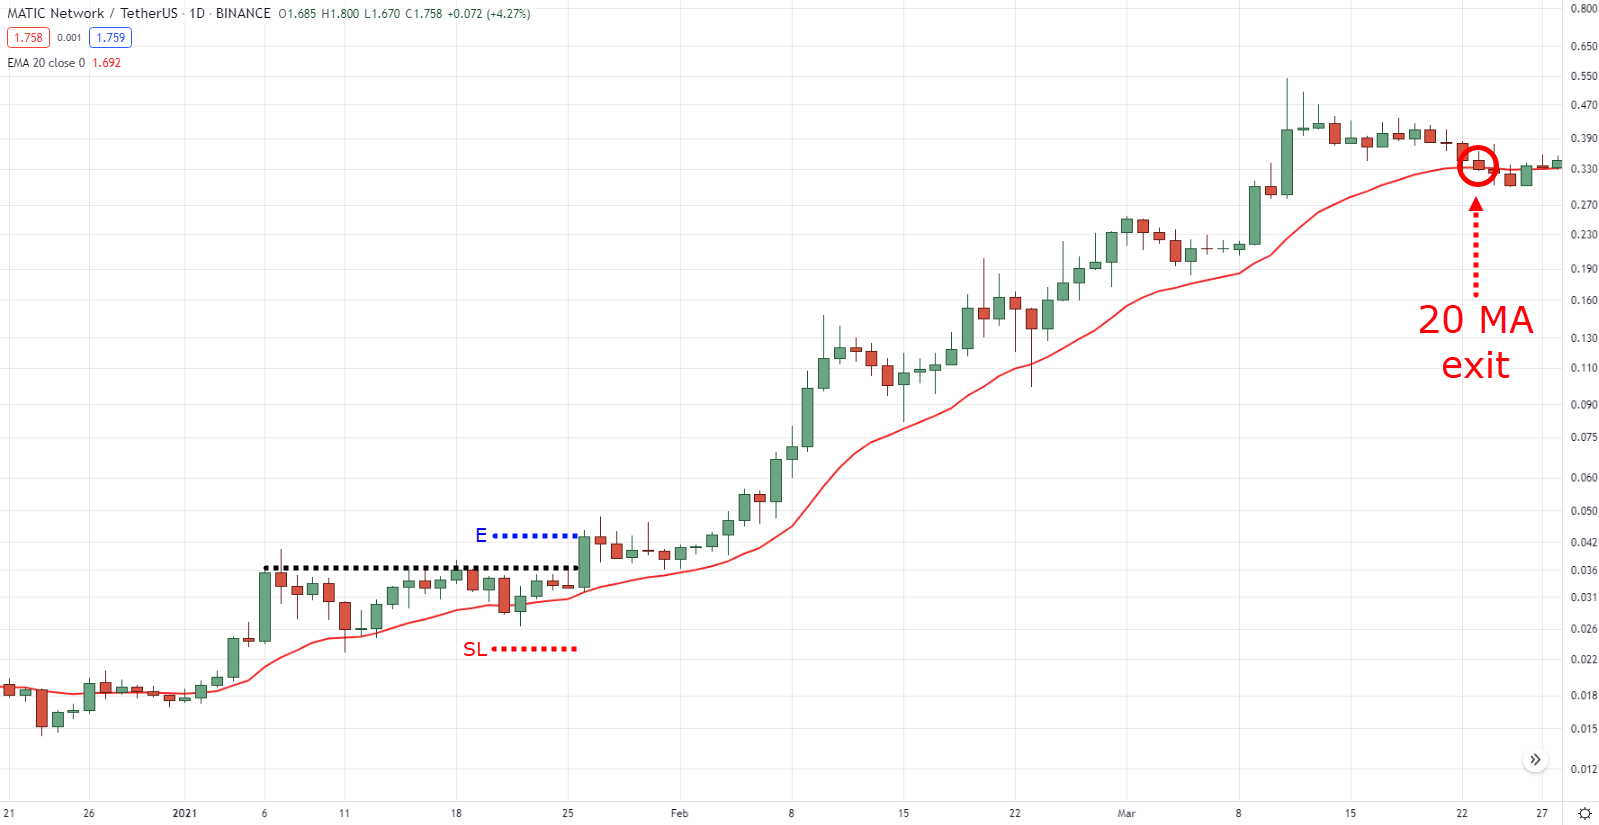
As for the setup, since the crypto markets tend to trend high…
Being a trend follower could be favorable.
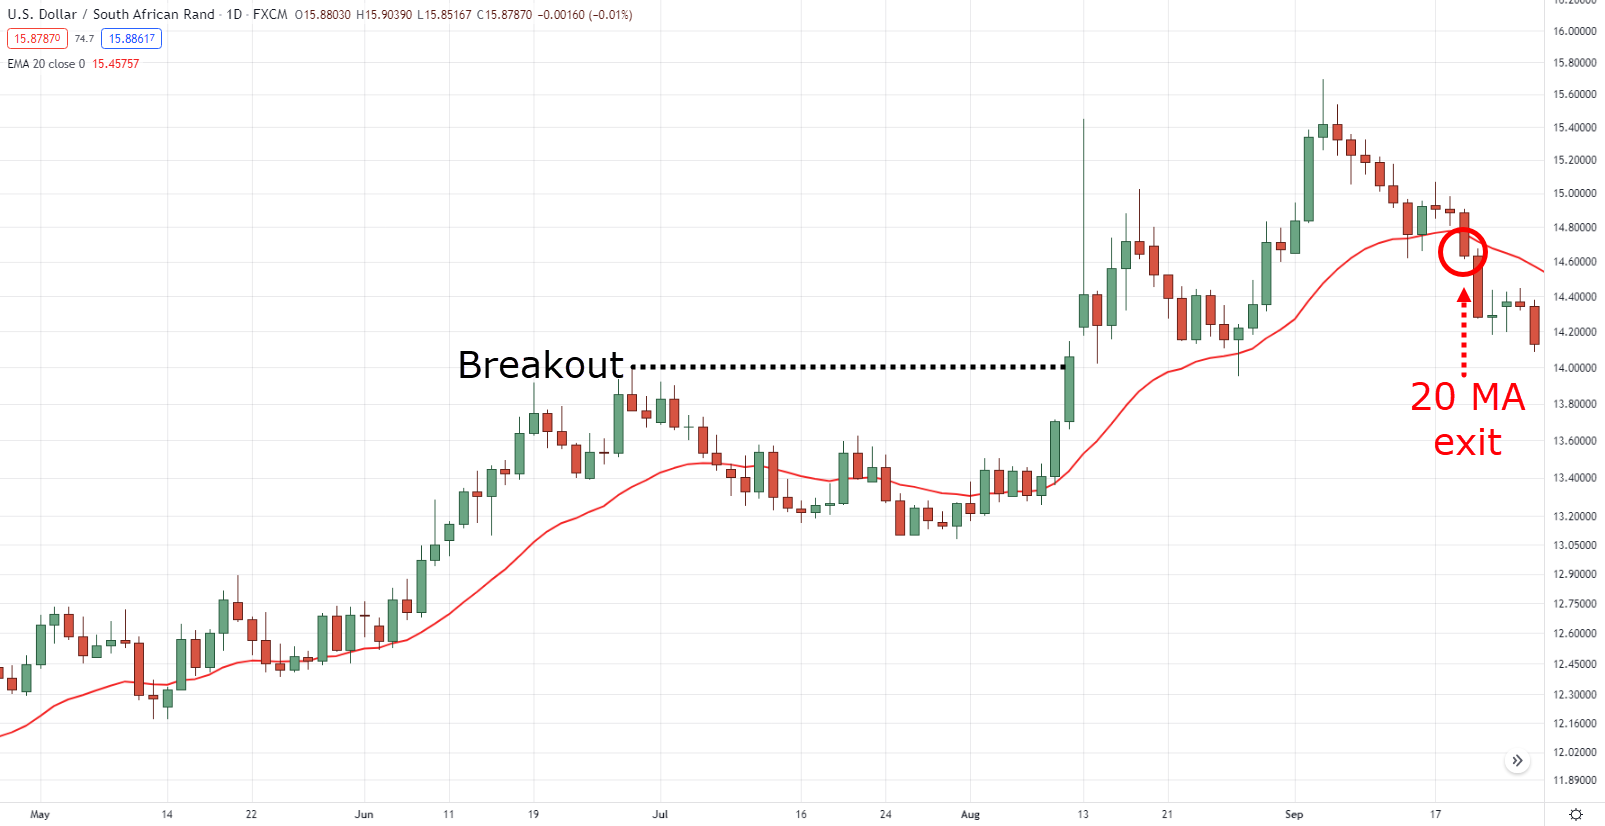
Breakout setup on MATIUSDT daily timeframe:
On top of that, crypto markets tend to trend fast, so using a 20-period moving average trailing stop loss could be favorable.
Breakout setup on MATIUSDT daily timeframe:
That’s it!
Disclaimer
Now, I know I’ve shared with you a couple of strategies.
So I have to make it clear that you must do your backtesting and demo trading first before you consider trading one of these strategies with your hard-earned money.
Remember, a strategy is only as effective as the mindset of its user.
Finally, another essential thing to consider is risk management, as it can determine whether or not you will survive long in trading!
With that said, let’s put everything you’ve learned into perspective…
Conclusion
A bullish candlestick pattern is essentially a chart pattern on the lower timeframes and can be formless at times.
In addition, bullish candlestick patterns are a powerful tool to use when entering trades as it puts you on the right side of the momentum.
However…
Bullish candlestick patterns shouldn’t be used in isolation and must be paired with other factors such as price action.
Makes sense?
With that said, I’d like to hear your thoughts.
How do you trade bullish candlestick patterns on specific markets?
Have you found success with them in the past?
Let me know in the comments section below!


I have considered there are 3 types of entries in price action not 2
Those are :
1) breakouts(trade with momentum)
2) pullbacks(trade with trend & against current momentum).
3) Reversals{counter trend} (trading against current momentum & trend).
Awesome, thanks for sharing Salai!
Note that reversals are pullback trading in higher timeframes
This is great Rayner. Great article. Learned a lot. Thank you!
You’re welcome Tinashe, glad to hear that!
If you know who’s in control, and the extent to which they’re in control, the only thing left is determine your entry and place a logical stop on your trade regardless of its direction. Candlesticks provide us with all the clues we need for this.
The time-frame comparisons in this article are particularly informative, Jet.
Thank you!
Thanks for sharing Randall, also, you’re welcome!
New to trading and these lessons have made what used to look so difficult now so easy.happy I found you guys .Good job
Great to hear that Ade!
Dear Rayner sir”
Write an artical on rising and falling wedge pattern please.
Thank you for the suggestion Zafar!
Thankyou for this new lesson
You are most welcome, Lodel!
Cheers!
Thank you God bless you for sharing this wonderful information .
You’re welcome, Tammy!
Rayner you have tried a lot for me and my trading journal. I love your articles. Thanks again
Glad to hear that, Nathaniel!
We wish you good luck and good trading!