
You’ve heard that chart patterns matter.
But why?
That’s because they reveal roadmaps for potential market movements…
Alert you to upcoming reversals…
Even forecast whether trends will continue up or down!
It’s all about learning how to find them – and that’s exactly what I’ll show you today.
In this guide, you’ll:
- Learn what makes up chart patterns and master how to identify them.
- Understand the differences between reversal patterns, signaling trend shifts, and continuation patterns, indicating ongoing trends.
- Absorb real-world examples showing how these patterns develop in actual markets.
- Collect proven tips and strategies to increase your trading success using patterns.
- Grasp the limitations and risks that come with pattern trading.
Are you excited?
Great!
Then let’s dive in!
Chart Patterns Cheat Sheet: What is it, and how does it work?
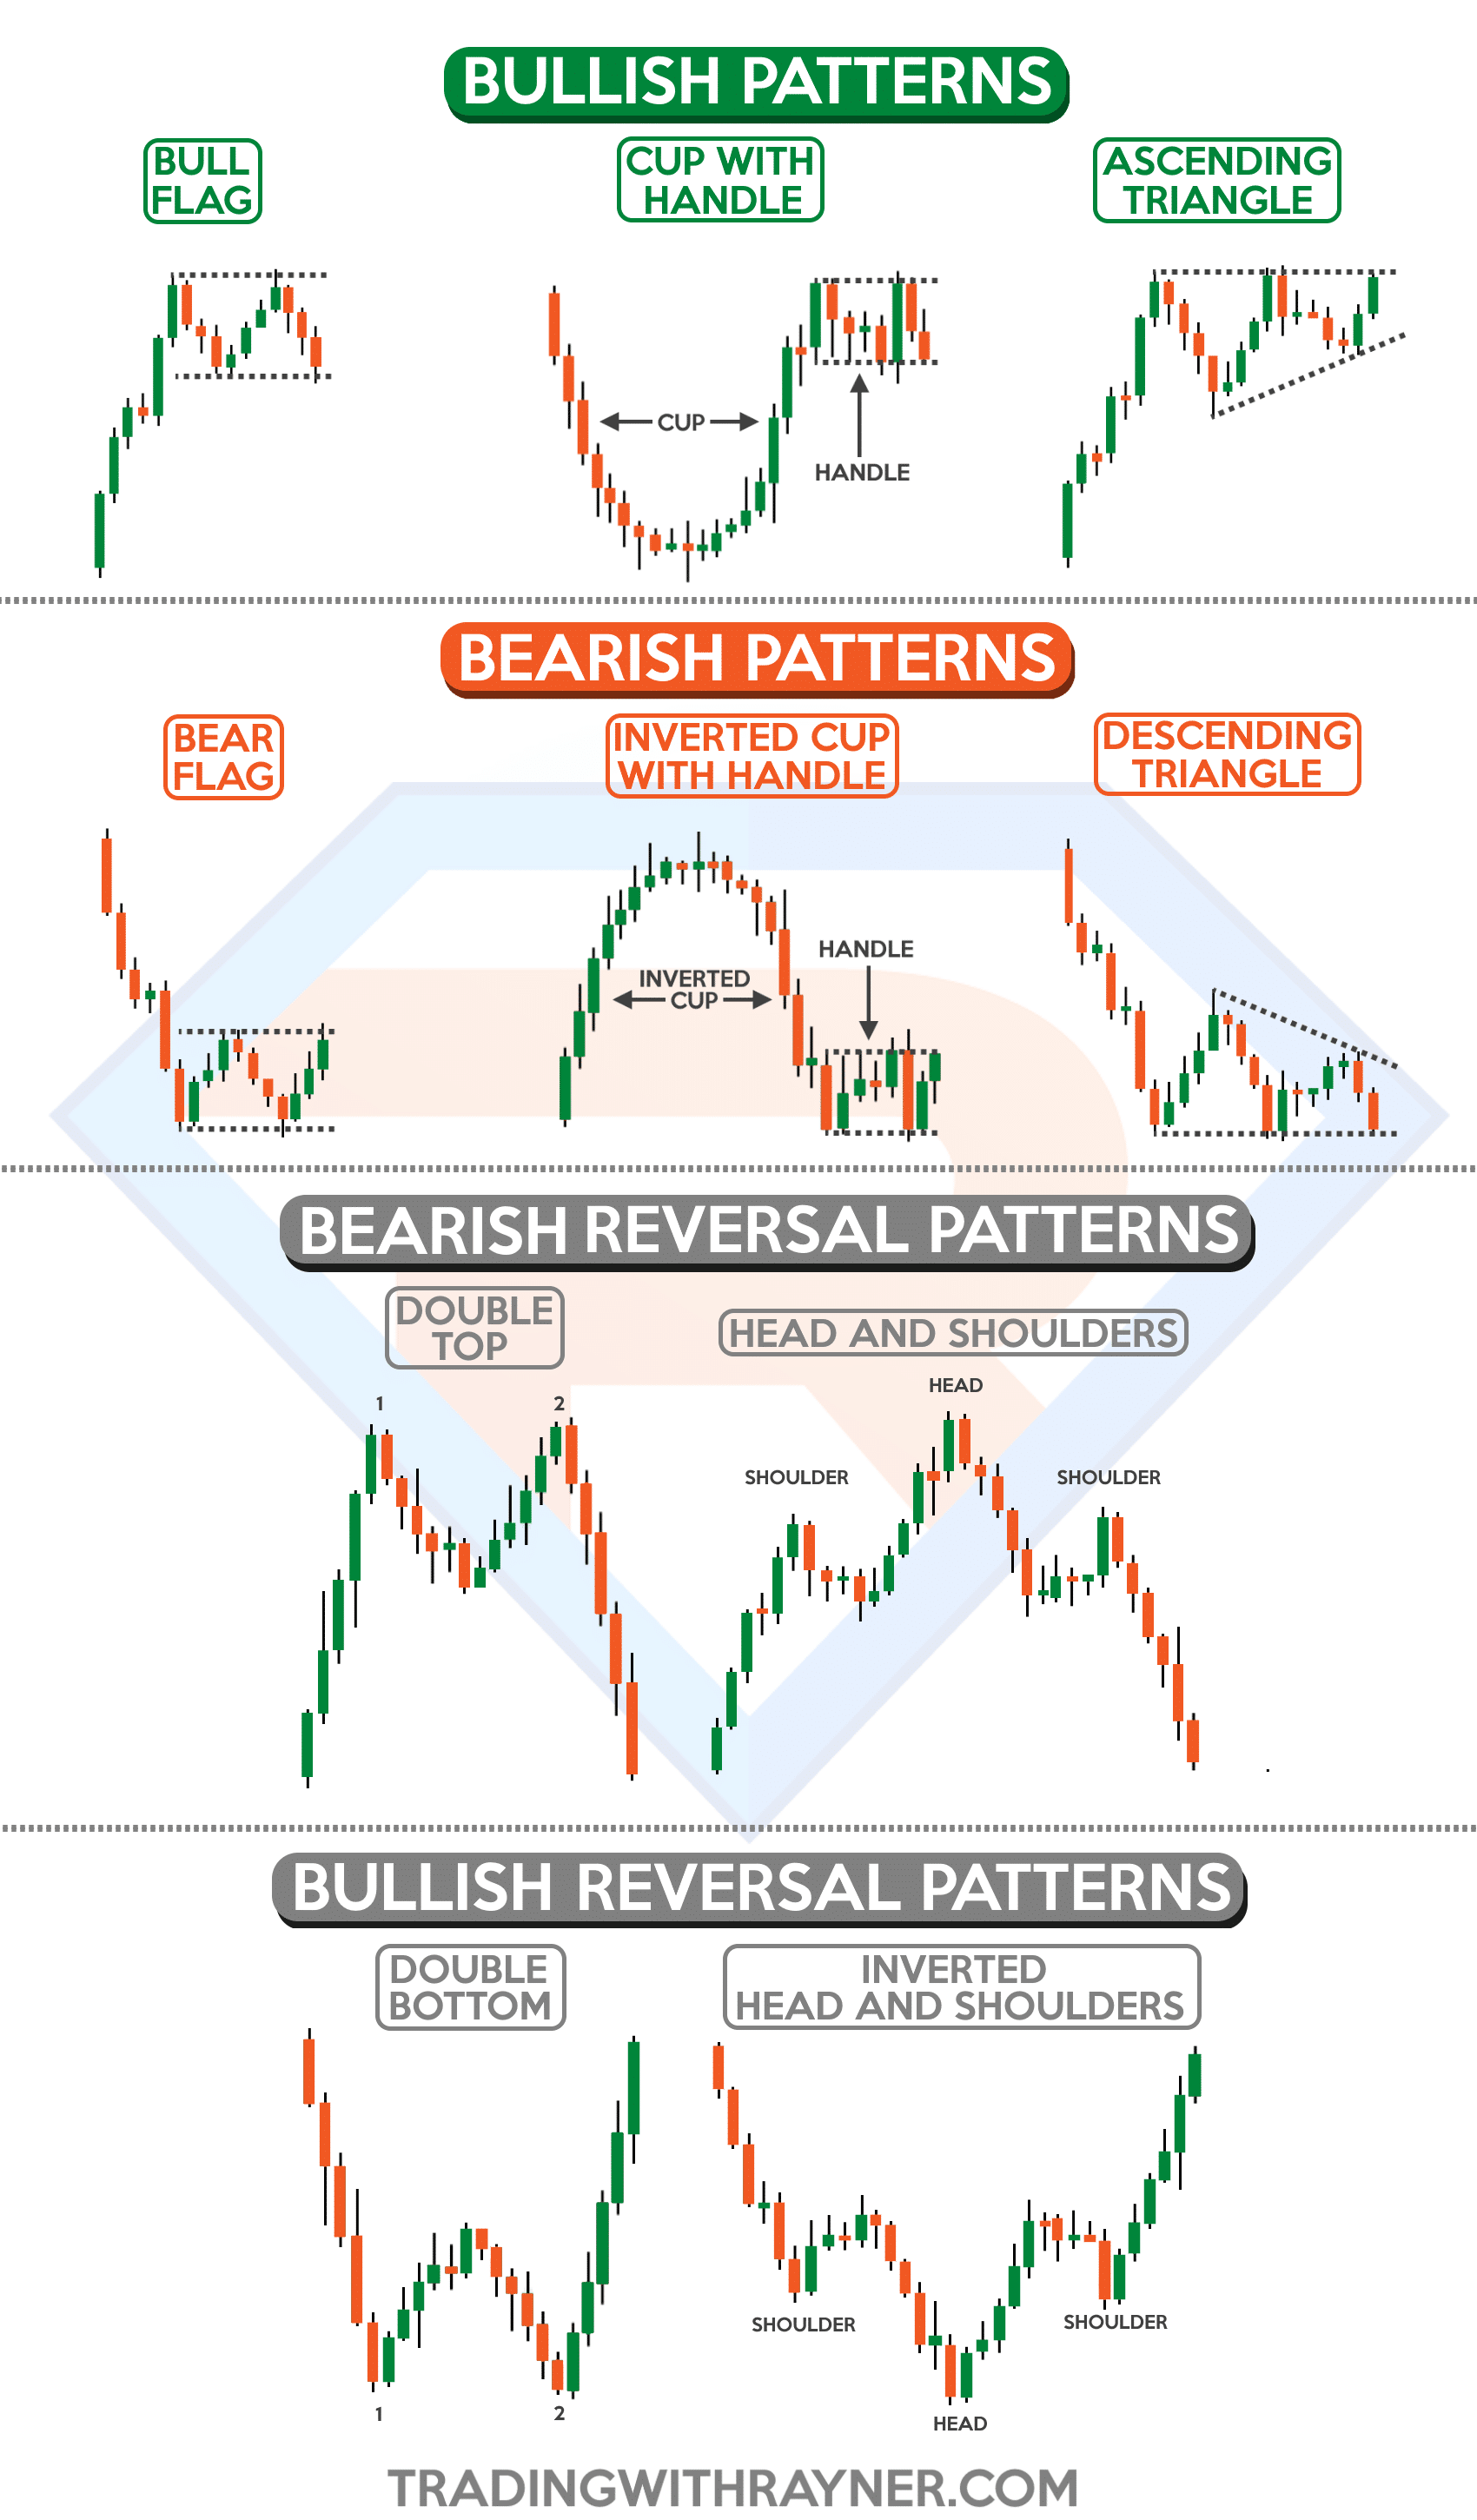
Chart patterns are a unique way for traders to understand price movements on their charts.
These patterns have been found throughout markets for years, often providing an uncanny ability to predict potential price movements.
And I get it… you’re probably asking…
‘But Rayner, surely the large financial institutions and corporations aren’t using these patterns to make trading decisions… are they??’
Well, it’s a good point!
These chart patterns don’t happen because traders are making them deliberately…
They have more to do with the underlying psychology of the market.
The patterns tend to occur at crucial points – price or otherwise – because they hold value for a lot of traders at the same time.
As a result, the patterns are naturally formed during shifts in the way the market is playing out.
These shifts could be a momentary pause in market prices following a strong breakout…
…and an uptrend to the emergence of a new trend – with a higher low formation.
Example of Strong Breakout vs Reversal and New Trend
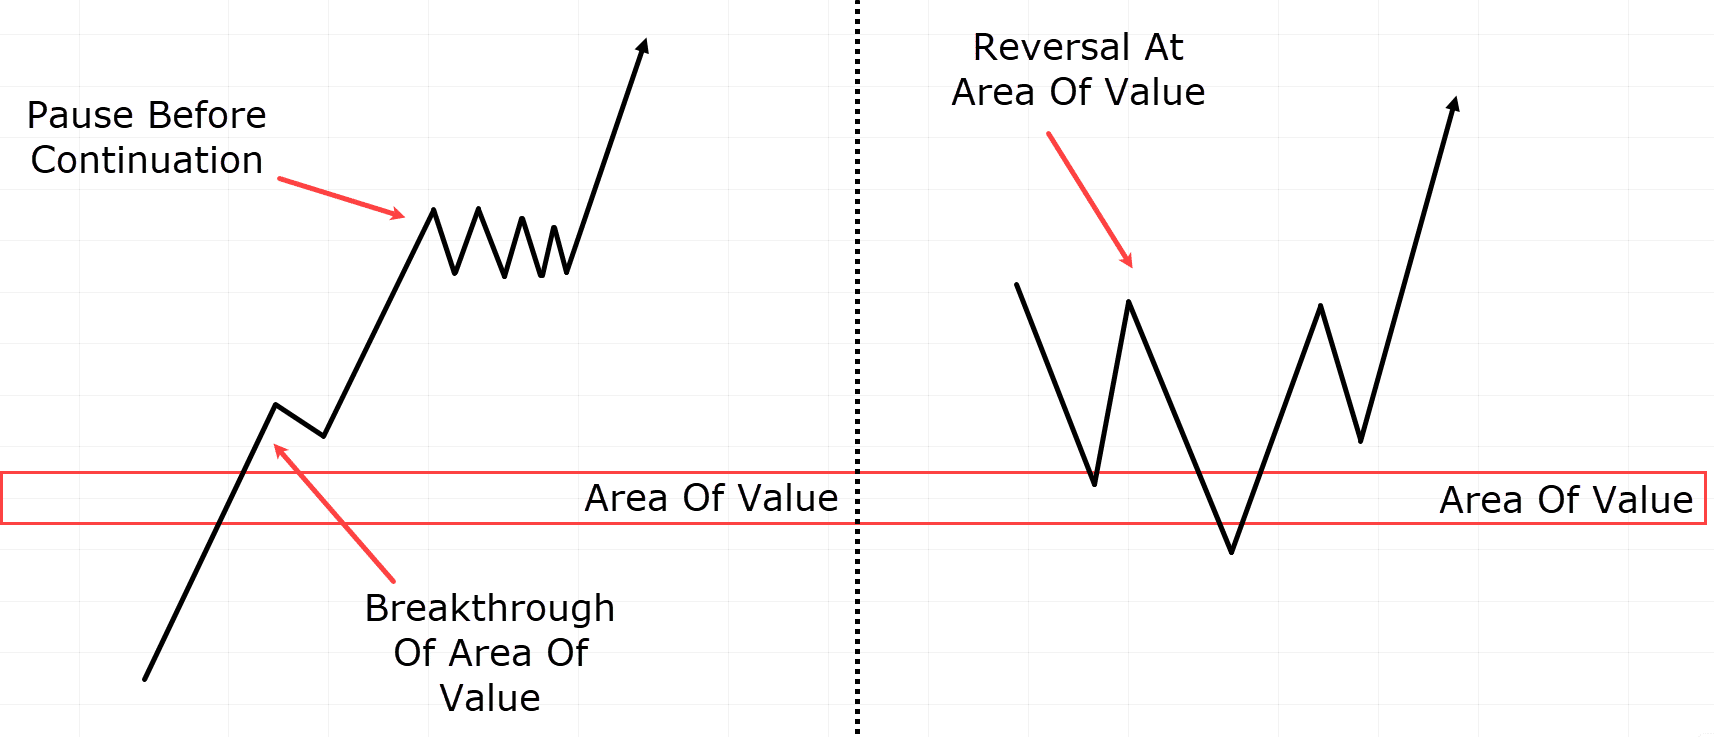
At the end of the day, they’re a visual aid to see changes in market conditions more easily.
…”So what?” I hear you cry!
Well, chart patterns offer guidance on something traders often overlook, even though it’s a crucial aspect of trading…
…I’m talking about entry and exits!
Imagine getting practical input on whether your trade is proving correct or incorrect!
Can you imagine the confidence boost it could give?
Patterns can provide clear take-profit and stop-loss areas, meaning you can plan your trades – even before entering them!
No more blindly entering the market… struggling, and worrying over the best exit points…
The precise layout of chart patterns means you can make better decisions, manage your risk better, and boost your overall trading success.
Types Of Chart Patterns Cheat Sheet
Let’s discuss two fundamental types of patterns: Continuation Patterns and Reversal Patterns.
Continuation Patterns:
Continuation Patterns emerge when the market is already trending a certain way.
So finding these patterns after a big upward or downward move lets you profit from a trend’s continuation.
They show whether the ongoing trend… is going to keep going!
You can usually find them when the market temporarily pauses – before it resumes again.
Reversal Patterns:
Reversal Patterns are more common and easier to find across various timeframes.
They indicate a potential reversal in the trend, showing a shift in market dynamics and the onset of a new trend.
You can often find them when…
…the market changes from consistent higher highs and higher lows to the first lower or lower high…
…or at robust support and resistance levels.
Reversal Patterns
I want to discuss three Reversal patterns that traders commonly use.
However, it’s important to understand that there are many more out there!
So, if you feel you need more of these tools, they’re always worth checking out!
Head and Shoulders Reversal Pattern
Head and Shoulders Example:
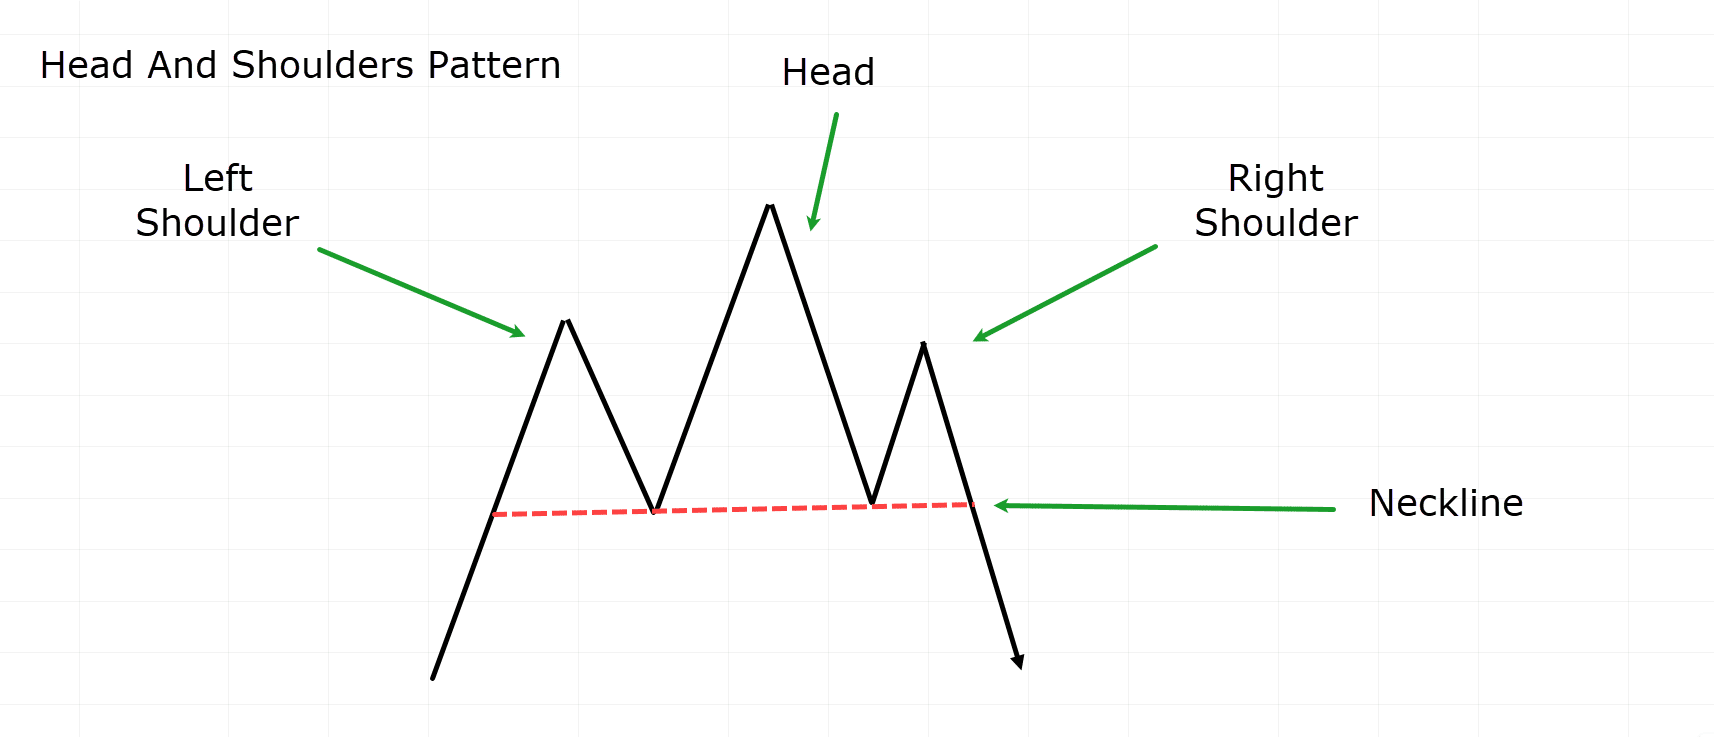
The head and shoulders pattern is a bearish reversal pattern you can sometimes find at the end of an uptrend.
What is the Head and Shoulders Pattern composed of?
- Left Shoulder – Formed when the price creates a new higher high during an uptrend.
- The Head – After the price makes a new higher low, it forms a higher high. The price must surpass the left shoulder.
- Right Shoulder – Generated when the price retraces and forms a new low, which could be a higher low, or lower low.
The crucial aspect is that the move to create a new high is lower than the head and preferably lower than the left shoulder – though not always necessary.
- Neckline – The point at which the two lows of the shoulders meet. Some traders position them where they function as support, while others prefer precision between these two points.
It’s important to remember that the inverse of this pattern is known as the inverse head and shoulders, often found at the bottom of downtrends as a bullish pattern.
Now that you have a blueprint, let’s examine a real-life trading example!…
EUR/AUD Daily Chart Uptrend:
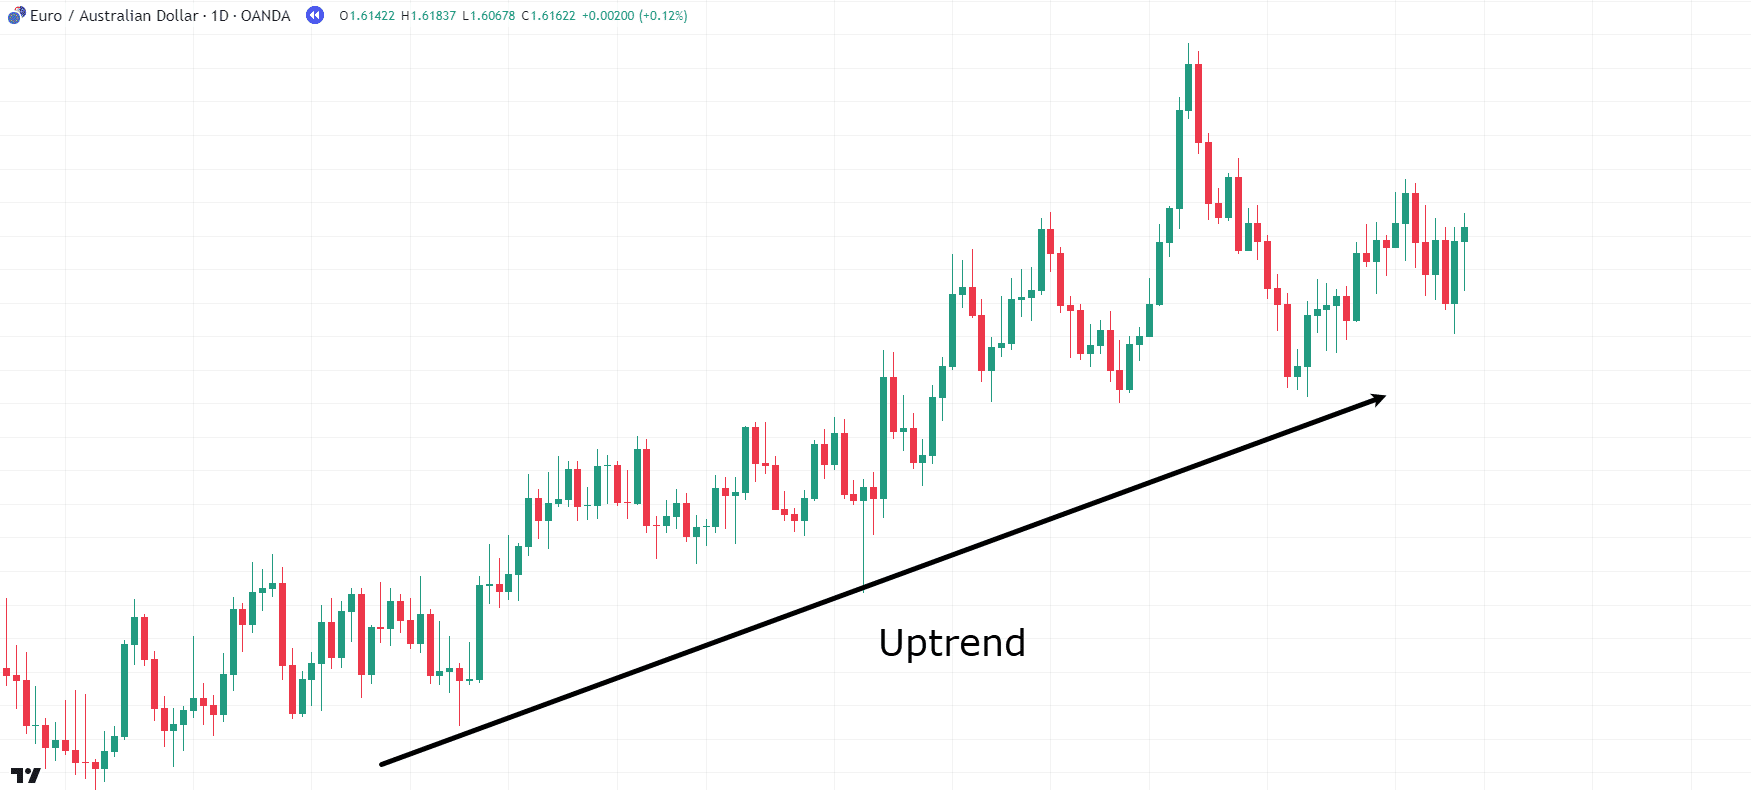
In this EUR/AUD daily chart, you can see a clear uptrend, right?
This uptrend is the first thing you need when finding the Head and Shoulder pattern…
EUR/AUD Daily Chart Head And Shoulders Formation:
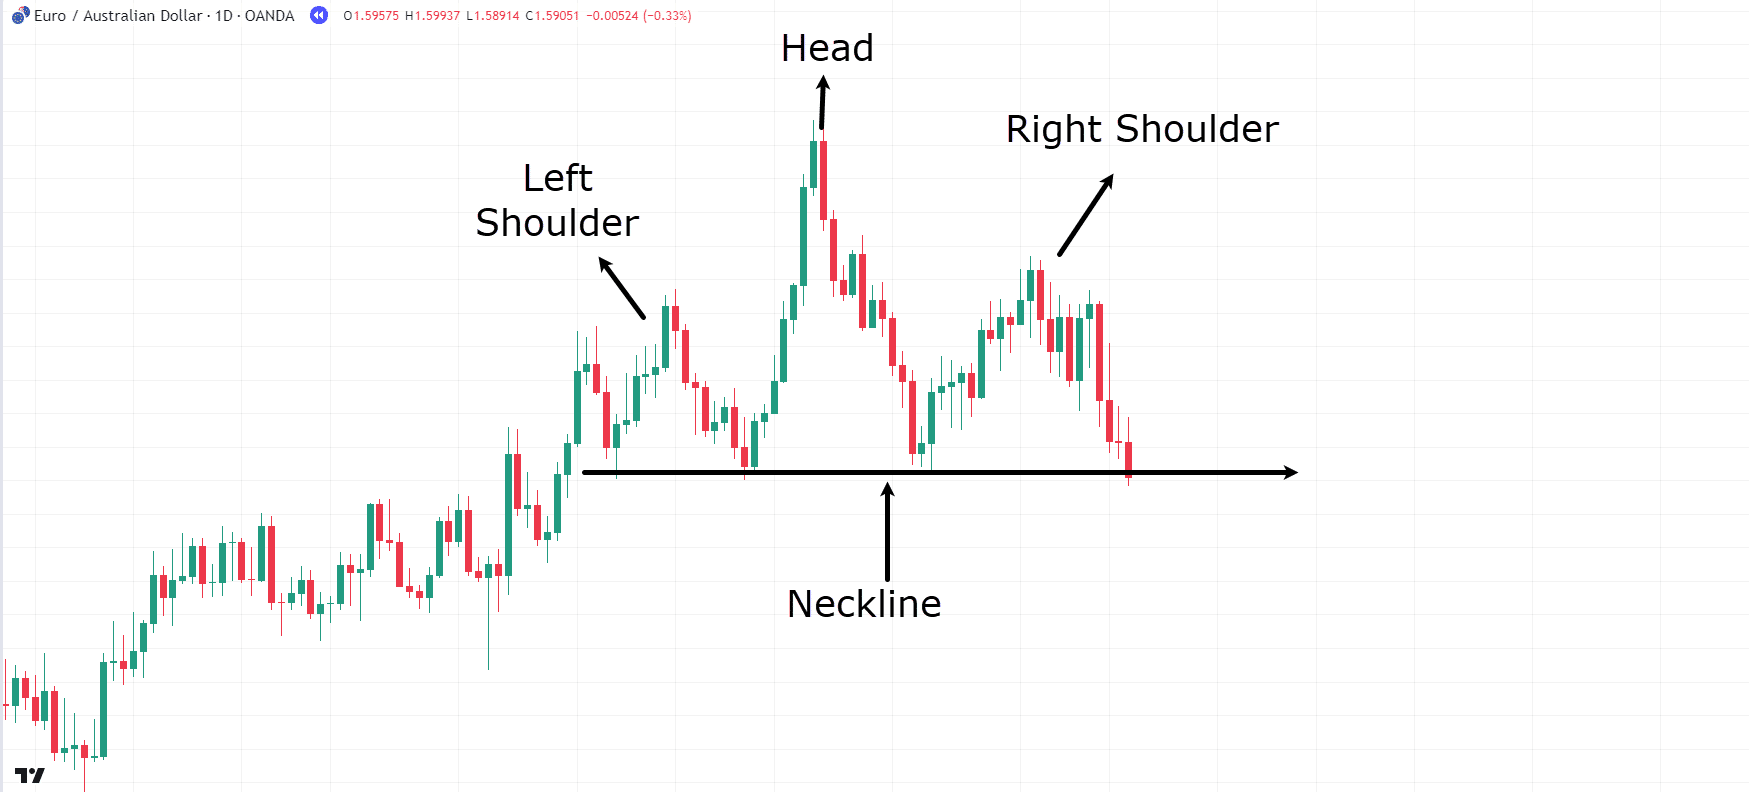
Taking a closer look, can you see the Head And Shoulders pattern within the uptrend?
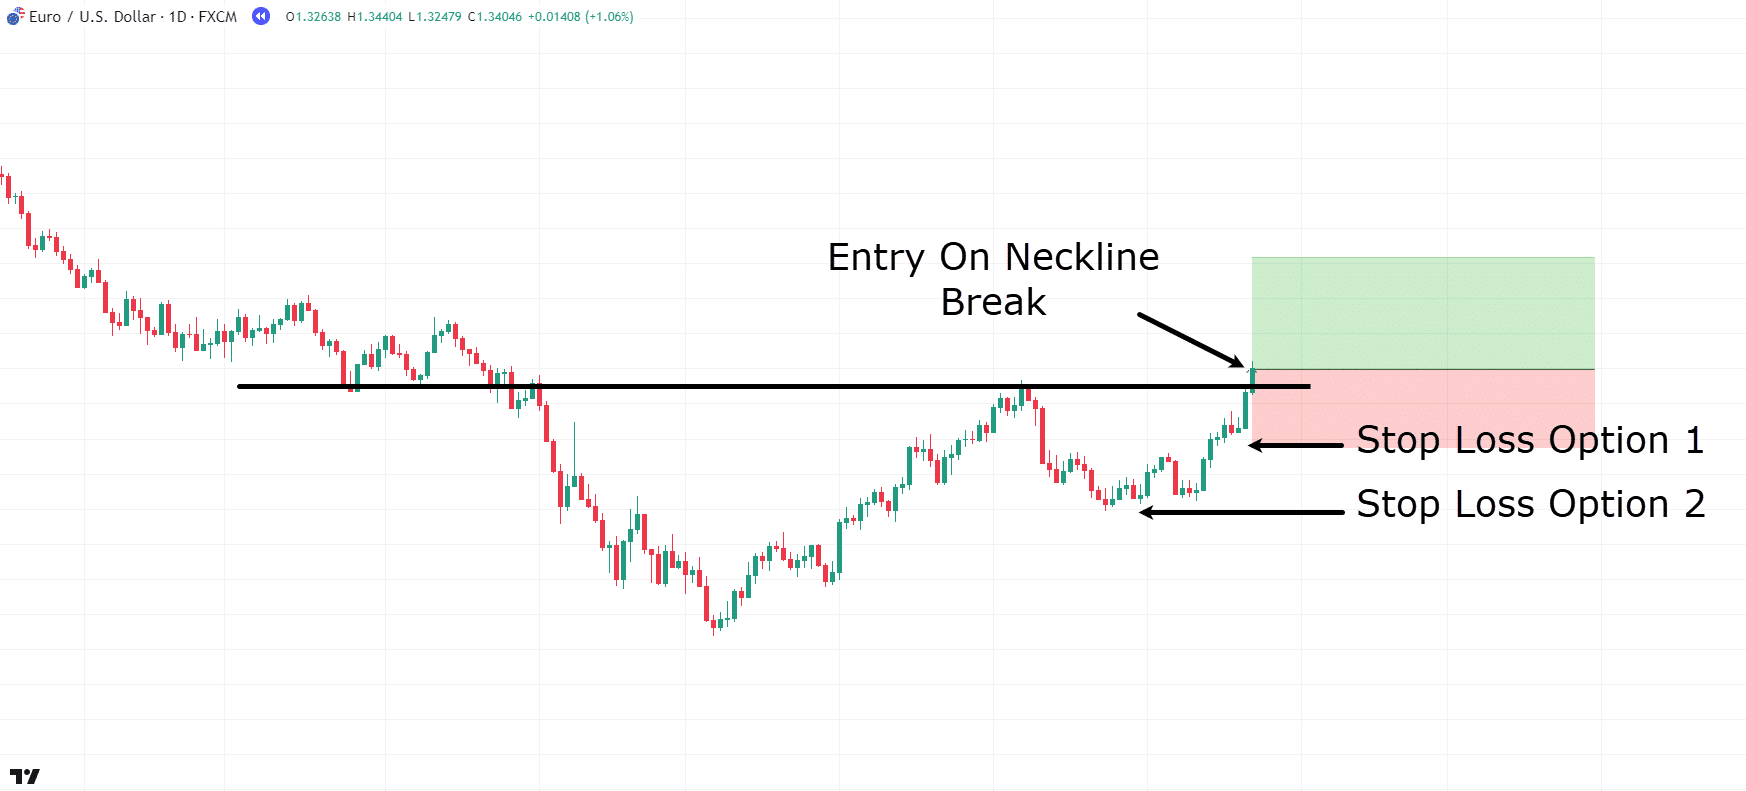
Well, traders often choose to enter a short position when the neckline of the pattern is breached.
Some traders may wait for a retest of the neckline before taking a short position, while others may enter as soon as a candle closes below it.
Certain patterns have something called a ‘measured move’…
EUR/AUD Daily Chart Head And Shoulders Measured Move:
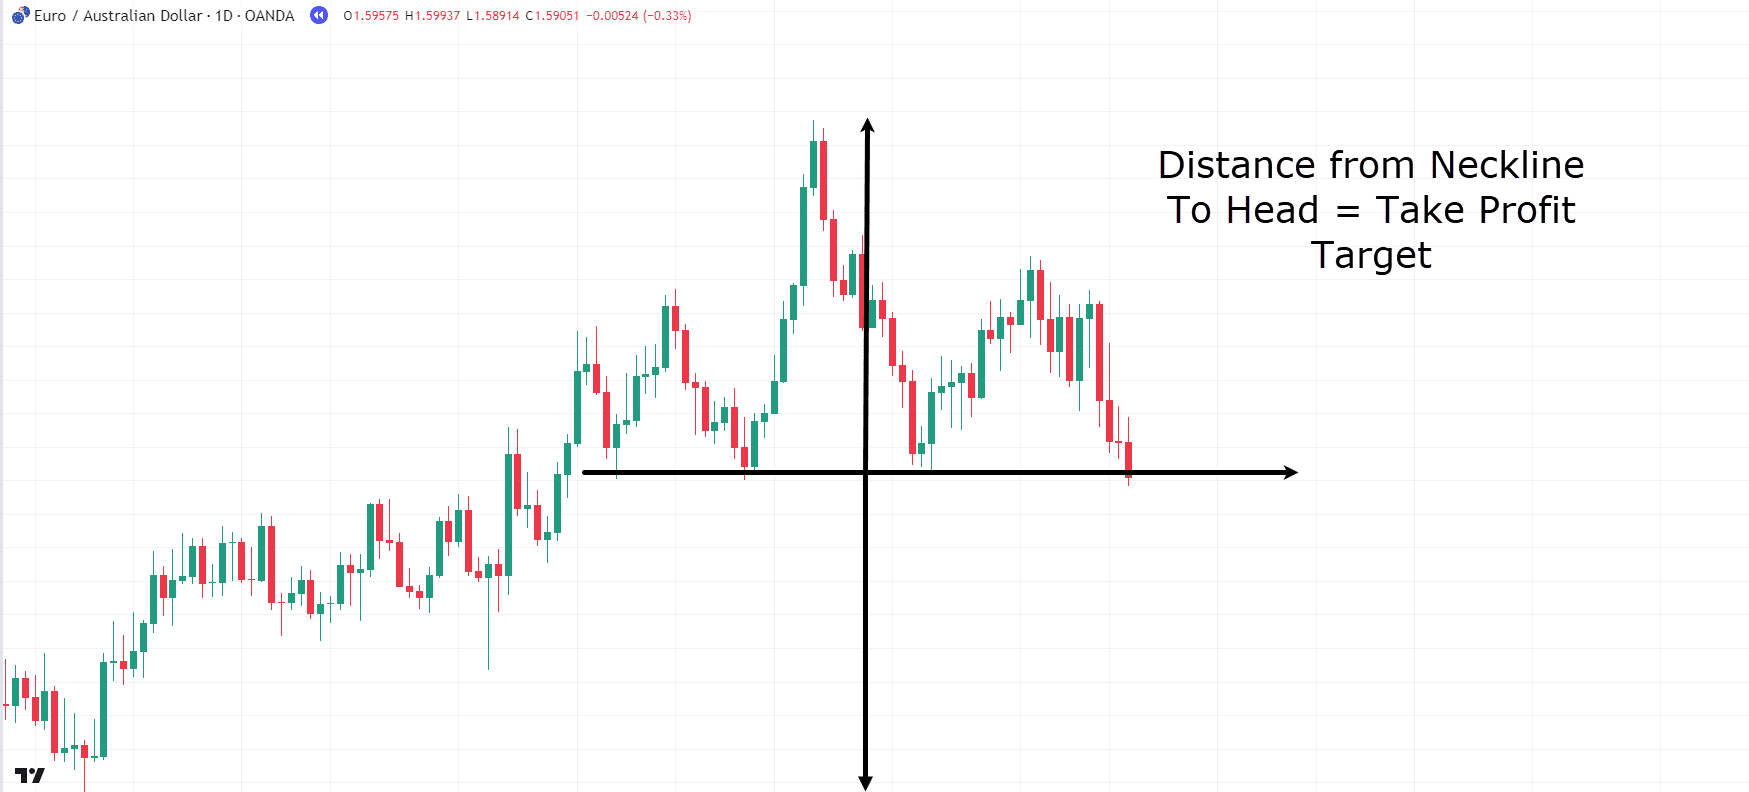
Measured moves show where the price may move after the pattern forms…
In this case, the head and shoulders measured move span from the neckline to the head.
As a trader, you’d estimate the price to decline by the same distance found from the top of the head to the neckline.
So, measured moves offer a helpful guide for working out potential profit-taking levels!
Let’s explore the outcome…
EUR/AUD Daily Chart Head And Shoulders Result:
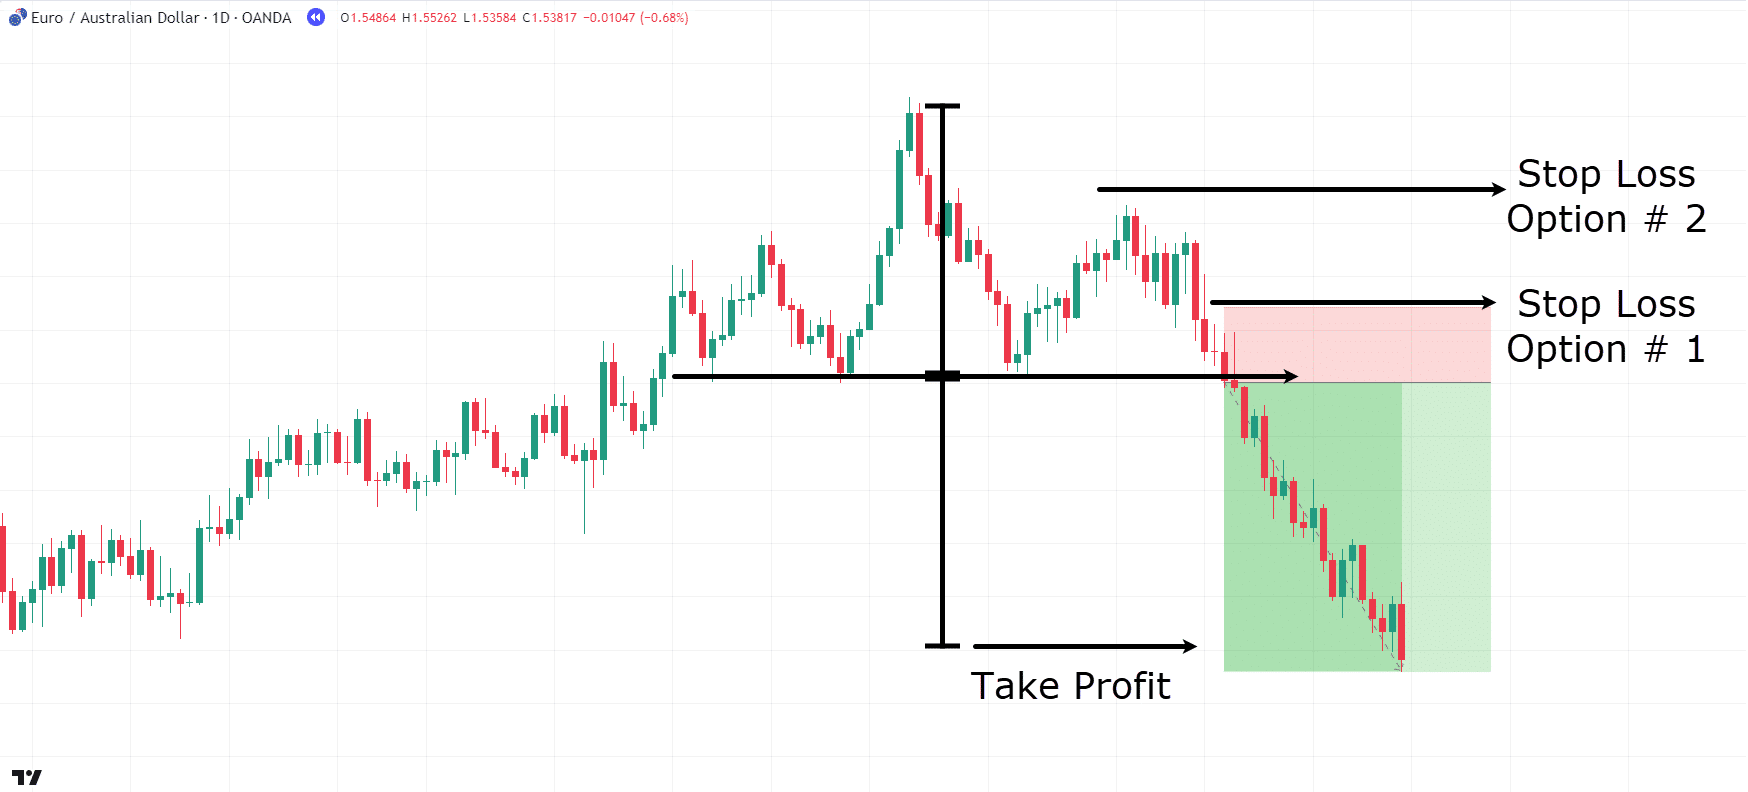
As shown, the price reached the target level pretty smoothly this time!
Now, as for stop loss placement, the head and shoulders pattern gives you a couple of options…
The first thing is to think about timeframes – and your strategy.
You could put your stop loss above the neckline for riskier setups…
…or above the right shoulder for less risky options.
It’s all about flexibility in support and resistance!
The head and shoulders pattern is deemed invalid if the price swiftly rebounds above the neckline.
Does it make sense?
Great! Let’s proceed to another reversal pattern.
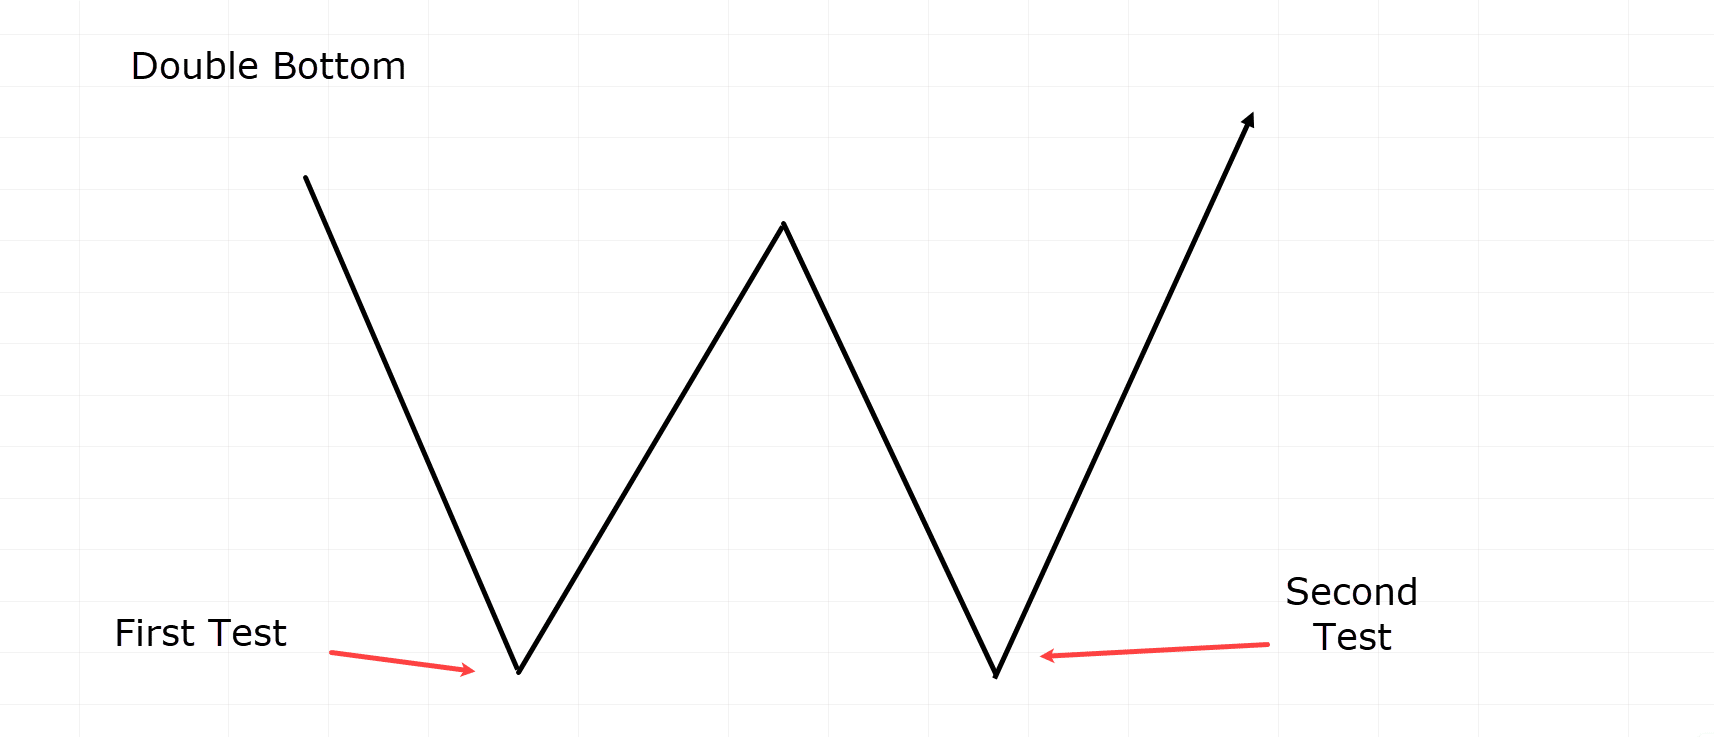
Double Bottom Reversal Pattern
Double Bottom Example:
The double-bottom pattern is pretty common across all markets, and you’ll usually find it at the bottom of downtrends.
While it may look simple, it is one of the most frequently used patterns!
But why is it so popular, you might wonder?
The reason lies in its ability to show a new support zone effectively – invaluable, right?!
What constitutes the Double Bottom Pattern?
- First Test – The initial test represents the point where the price bounced for the first time.
- Second Test – The next test occurs when the price revisits the same level and bounces again. This marks the second time the area has been tested.
Now, there must be some time and price movement between the bounces during the first and second tests.
Remember, the inverse of this pattern is called the Double Top and is found at the end of uptrends.
Let’s examine a trading example of the Double Bottom…
AUD/USD Hourly Chart Double Bottom:
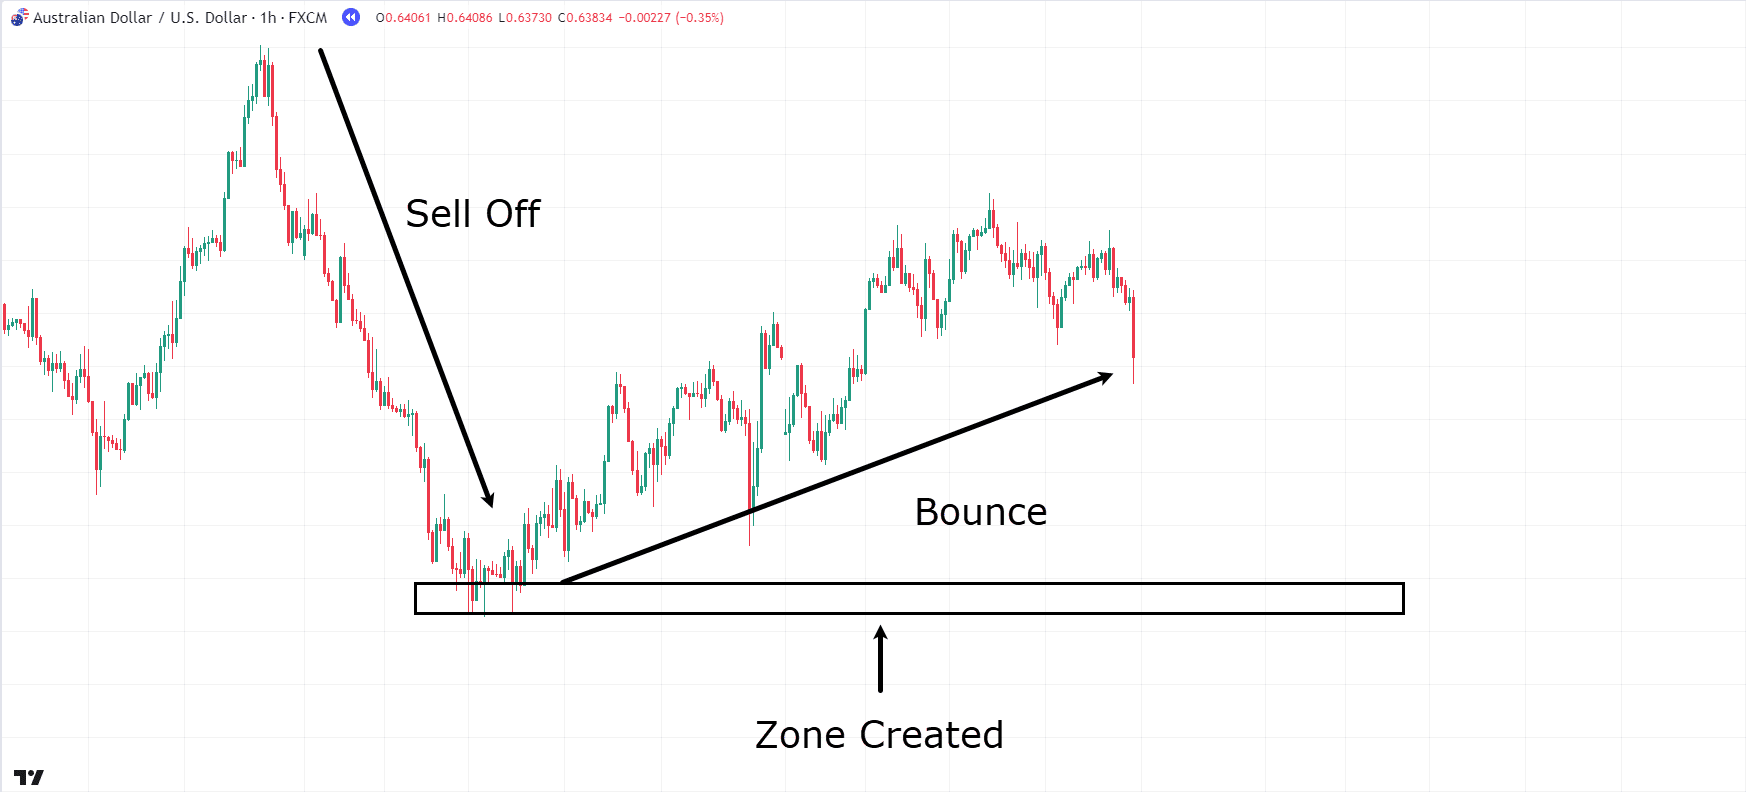
The AUD/USD hourly chart shows a significant sell-off followed by a bounce and a move upward…
AUD/USD Hourly Chart Double Bottom Bounce:
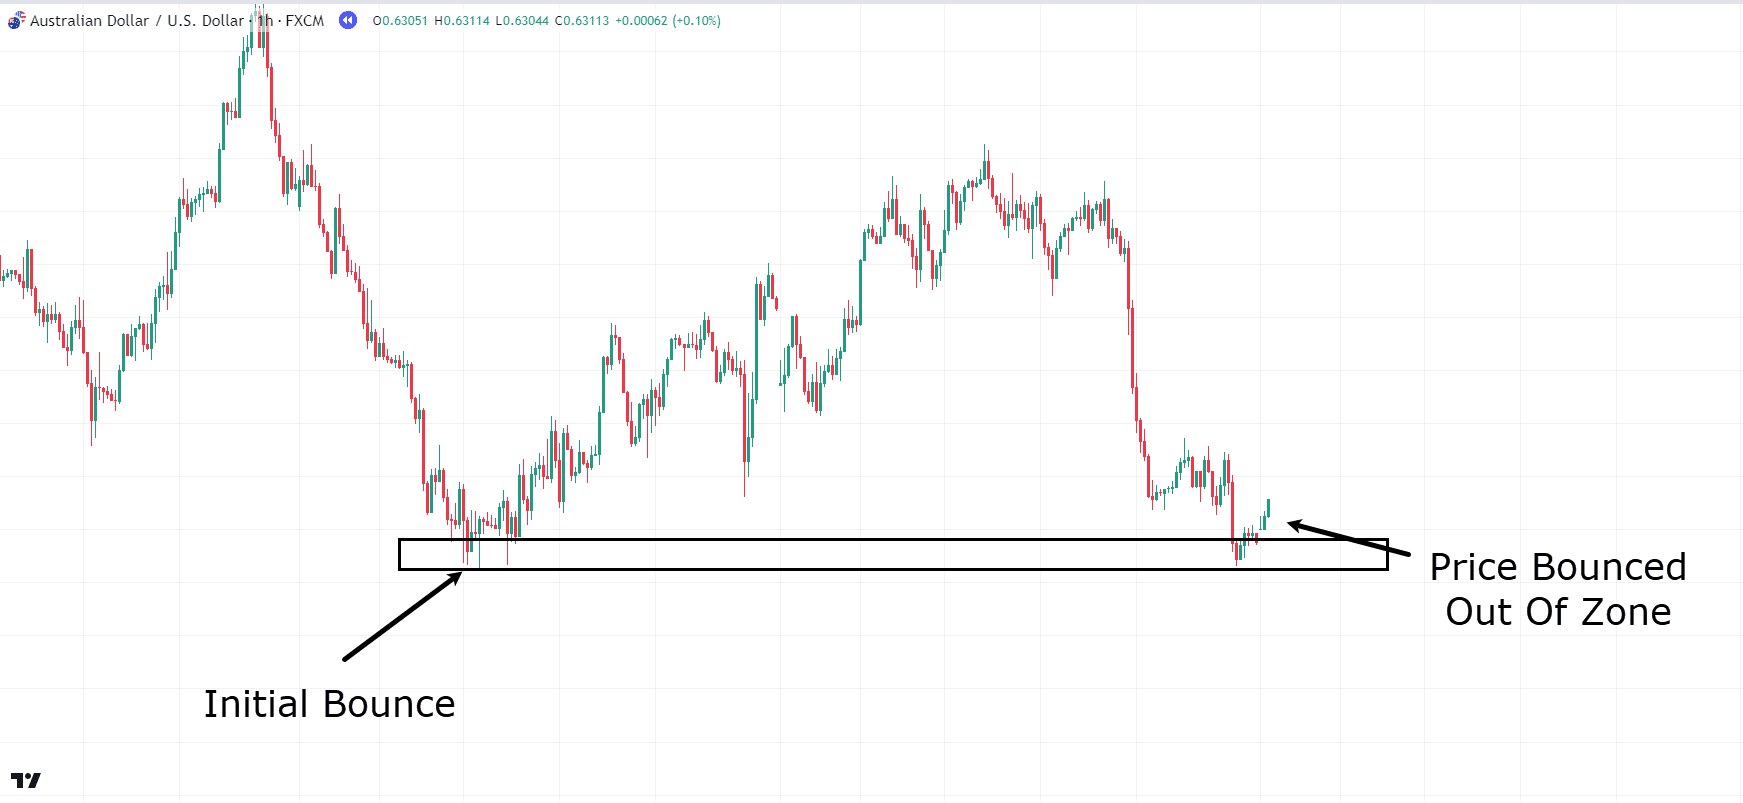
There’s a pretty big amount of time between the bounces. Also, look at how the price has exited the zone and bounced again…
This suggests that this area on the price chart could potentially be a zone of rejection and signal a price reversal, with price rejecting the same zone.
Let’s take a look at what an entry might look like…
AUD/USD Hourly Chart Entry:
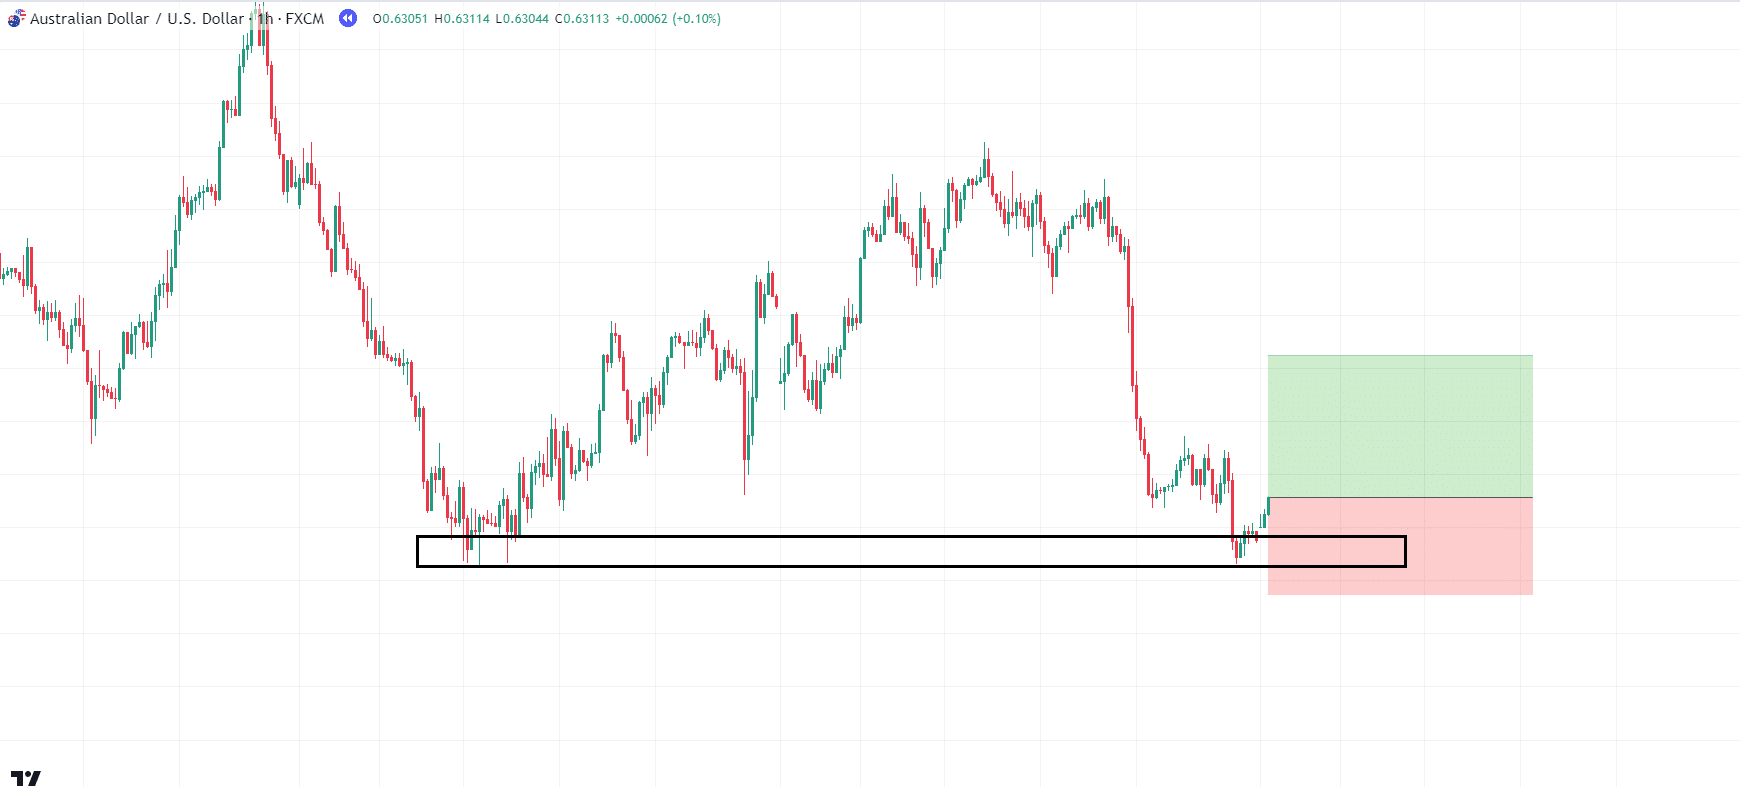
As shown, the stop loss can be positioned below the zone.
If the price falls below the zone, the double bottom pattern becomes invalid as the price has begun to form a lower low.
Unlike the head and shoulders pattern, the double bottom doesn’t offer a clear-cut measured move target, though.
So for this example, let’s aim for a reasonable 2:1 risk-to-reward ratio.
Check it out…
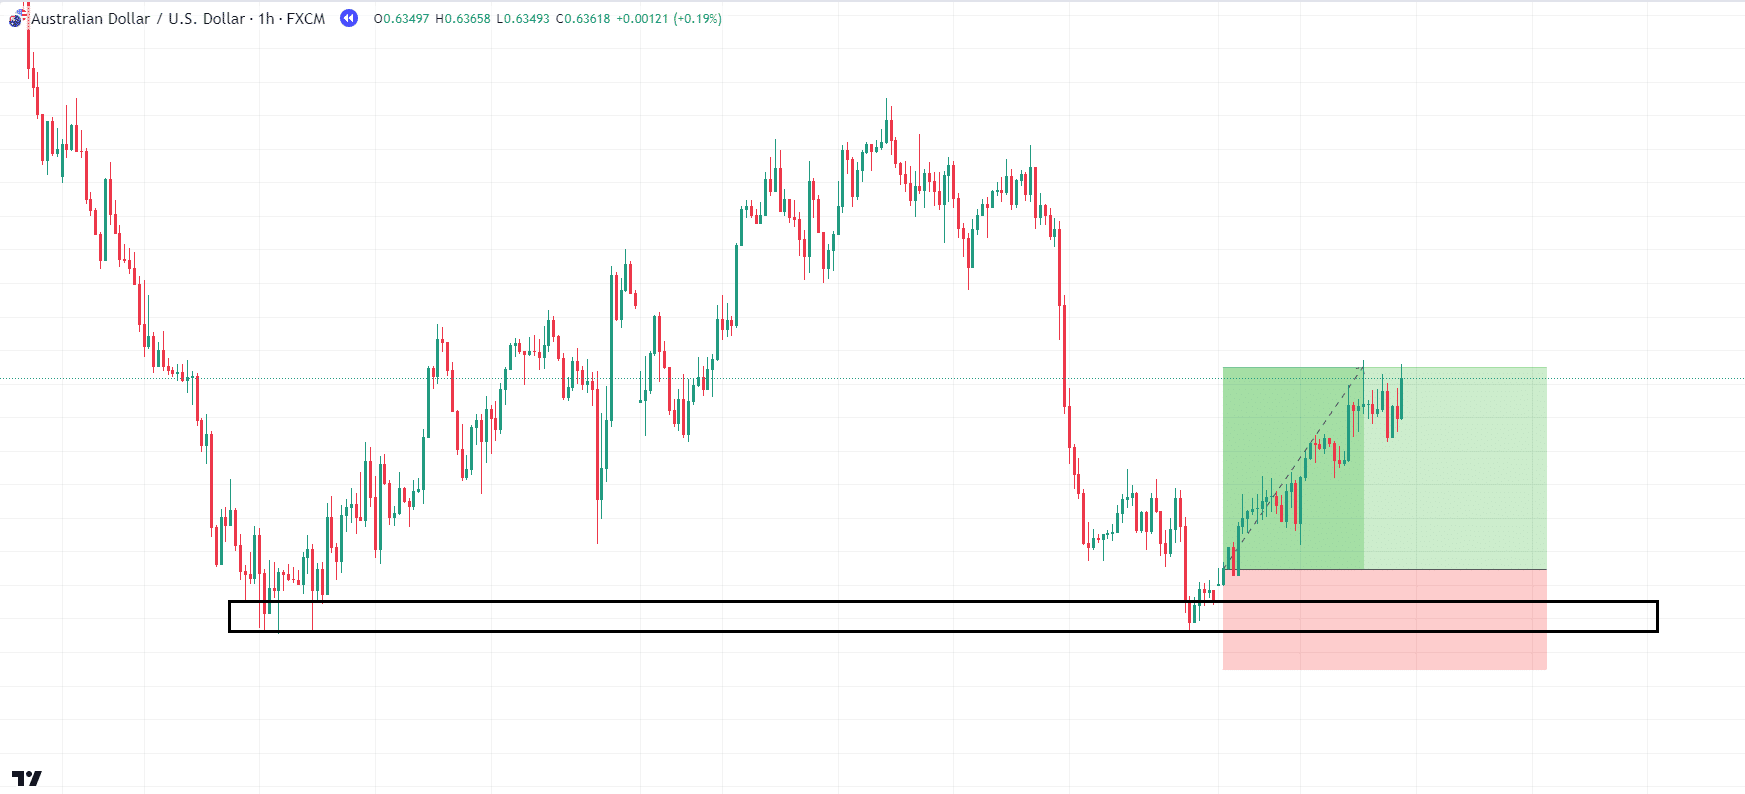
AUD/USD Hourly Chart Exit:
Nice work!
Congratulations!
You effectively entered a 2:1 trade, capturing substantial profits from a simple bounce at support using the double bottom pattern!
Note: The triple bottom pattern mirrors the double bottom pattern but features three bounces instead of just two.
Both patterns serve as visualizations of support levels… and they make life a lot easier!
Chart Patterns Cheat Sheet: Cup and Handle Reversal Pattern
The Cup and Handle pattern is a type of rounded bottom formation, although its shape and size can vary.
The key feature is the noticeably rounded bottom that resembles… you guessed it… a cup!
Below is a diagram illustrating this pattern…
Cup And Handle Example:
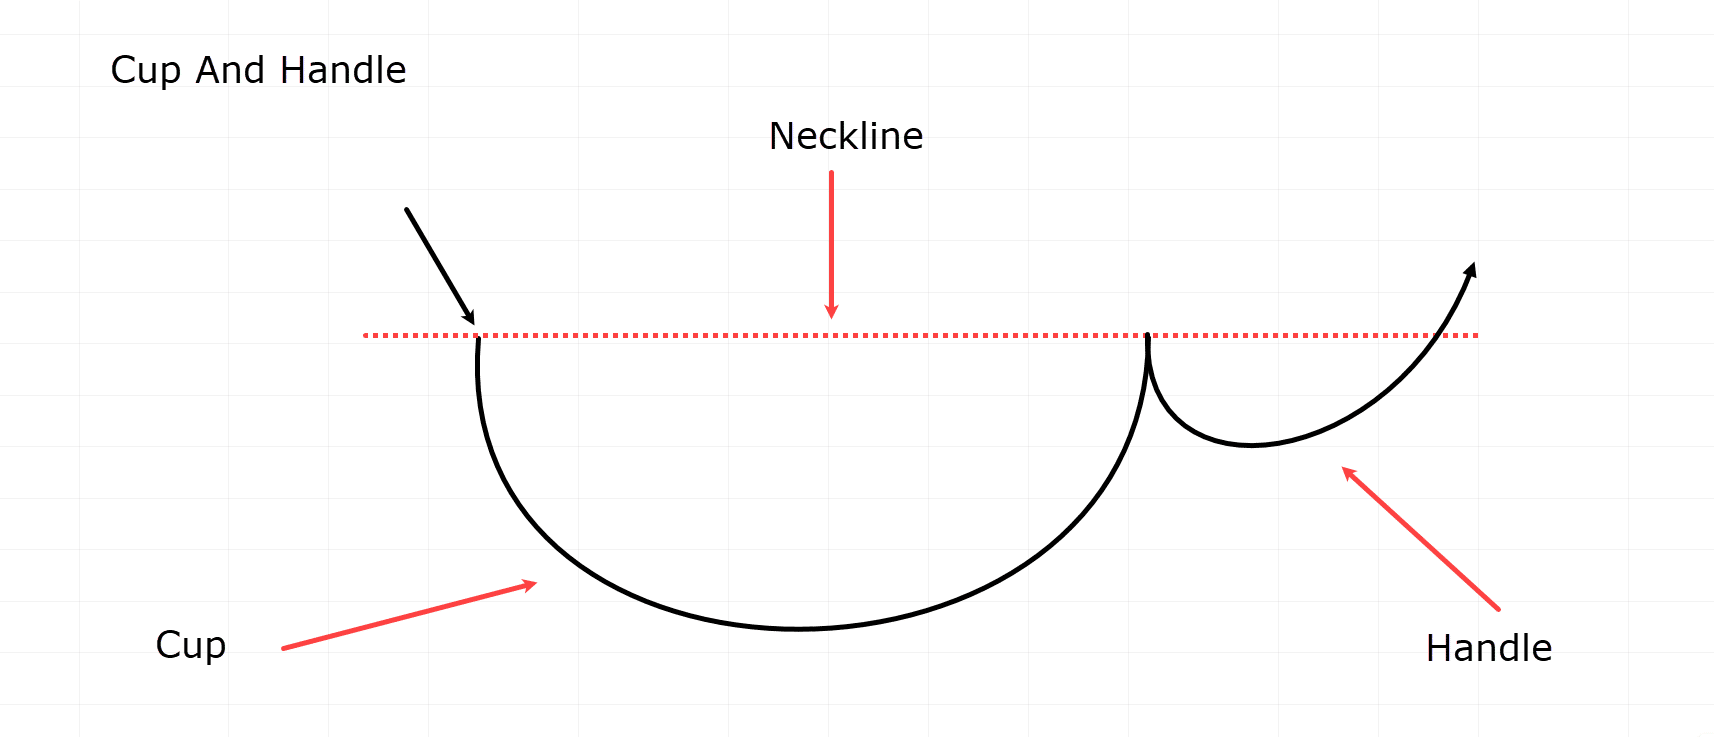
The main features of the Cup and Handle pattern include a rounded bottom that moves up to the neckline.
Following the neckline, the price may retrace, forming a handle-like shape.
Sometimes, this handle formation is also rounded, but it is not a requirement…
Entry triggers can be found during the handle formation – or upon the breakout of the neckline.
Let’s examine an example of the Cup and Handle pattern in action!…
EUR/USD Daily Chart Downtrend:
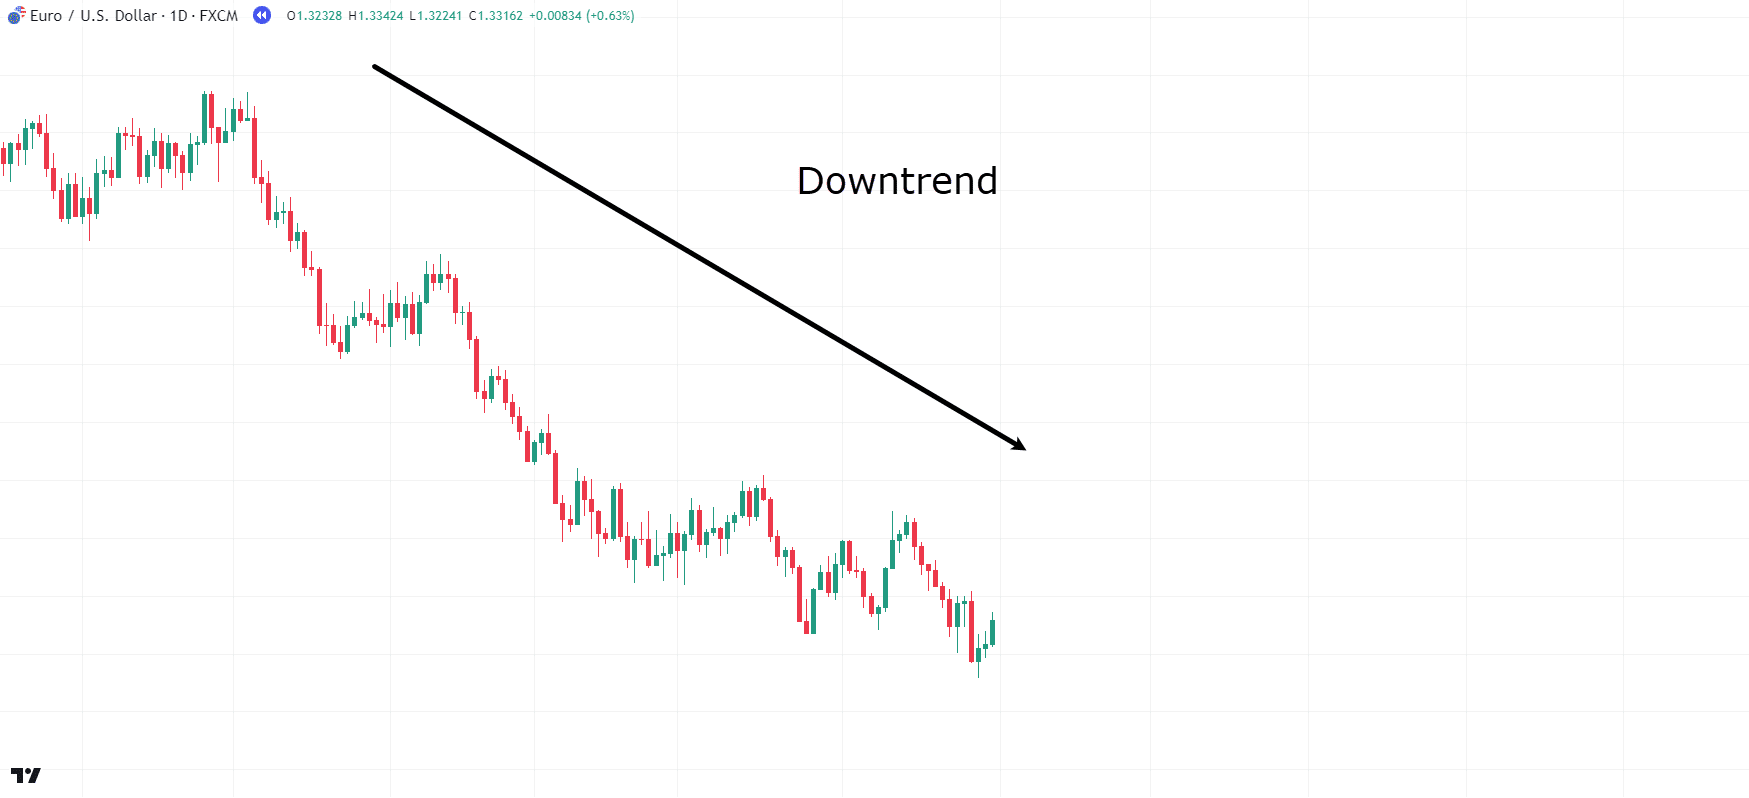
In this chart, it’s clear that the price is in a daily downtrend…
…which is the first thing you need when identifying the cup and handle pattern!…
EUR/USD Daily Chart Cup Formation:
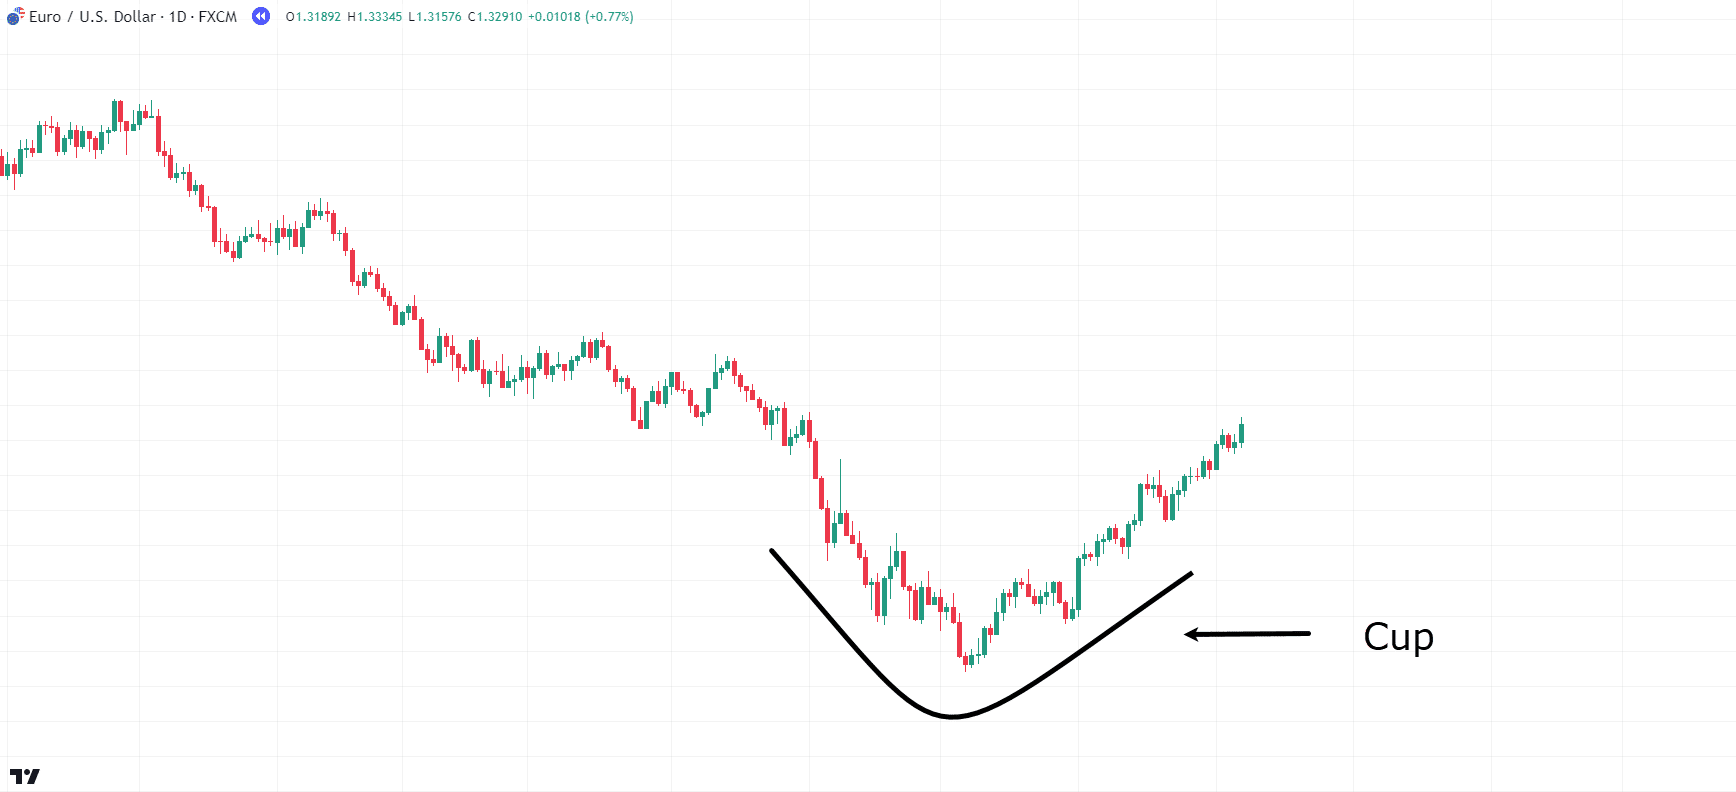
As the price retraces, a somewhat rounded bottom begins to form – see it?
Although the cup formation does not have to be perfectly round, it is good to see a steady build-in price for it…
EUR/USD Daily Chart Cup And Handle Formation:
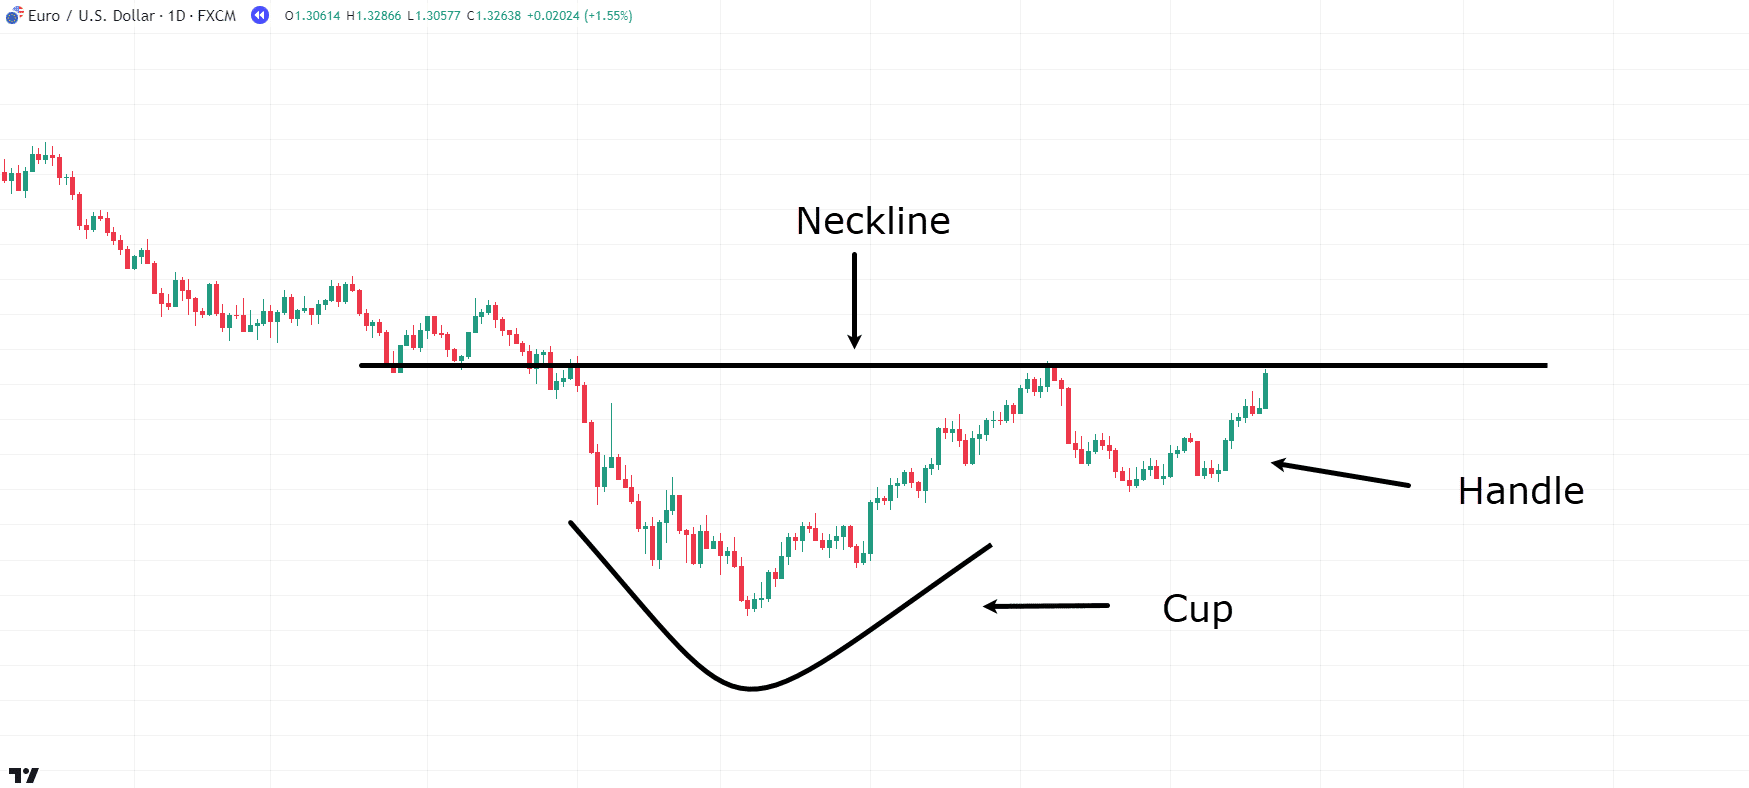
Now, the price has also formed the handle.
The neckline lines up with the previous support, which is a good sign for the future…
With both the cup and the handle formation complete, you can start considering taking a trade!
This might involve a break and retest of the neckline or simply the breakout of the neckline.
Let’s explore what this setup could look like…
EUR/USD Daily Chart Cup And Handle Entry:
Now, if you prefer a more aggressive stop loss, you could place it under the bullish candle where the price originally broke out of the neckline…
If the price falls back below the neckline, it’s time to exit the trade.
Alternatively, you could use the second option for your stop loss if you’re targeting a longer-term trend…
…it all depends on your personal preference and risk tolerance!
Now that you know how to identify three major reversal patterns, let’s delve into two major continuation patterns!
Chart Patterns Cheat Sheet: Continuation Patterns
Continuation patterns often show up as flags or triangles.
While I’ve got examples of two variations here, they’re not the only ones
You’ll also hear about wedges and symmetrical triangles out there – with rules similar to those I’ll cover today.
Bull Flag
First up is the famous Bull Flag, with its bearish counterpart being the Bear Flag.
The Bull Flag is usually found in uptrends and is best described as a brief pause in price before the next move upward.
You can visualize it as the bulls regaining stamina for the next upward push!…
Bull Flag Example:
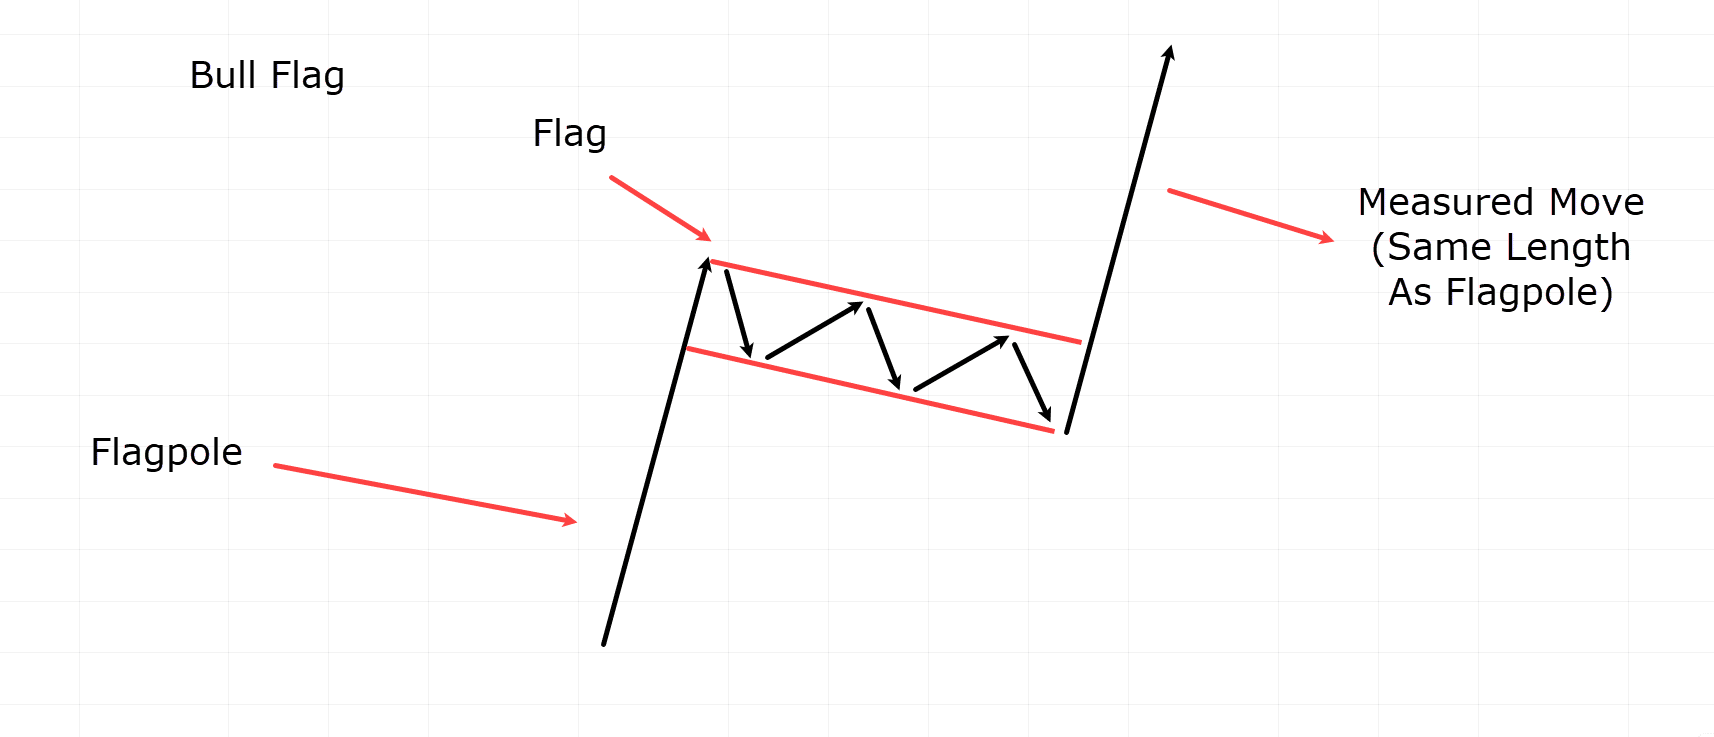
Its measured move is the length of the flagpole, meaning you can expect the price to move at least from the bottom of the flag to the length of the original move up (the distance of the flagpole).
I often find these continuation patterns on the Bitcoin chart, so let’s take a look at an example…
BTC/USD 4hr Chart Bull Flag:
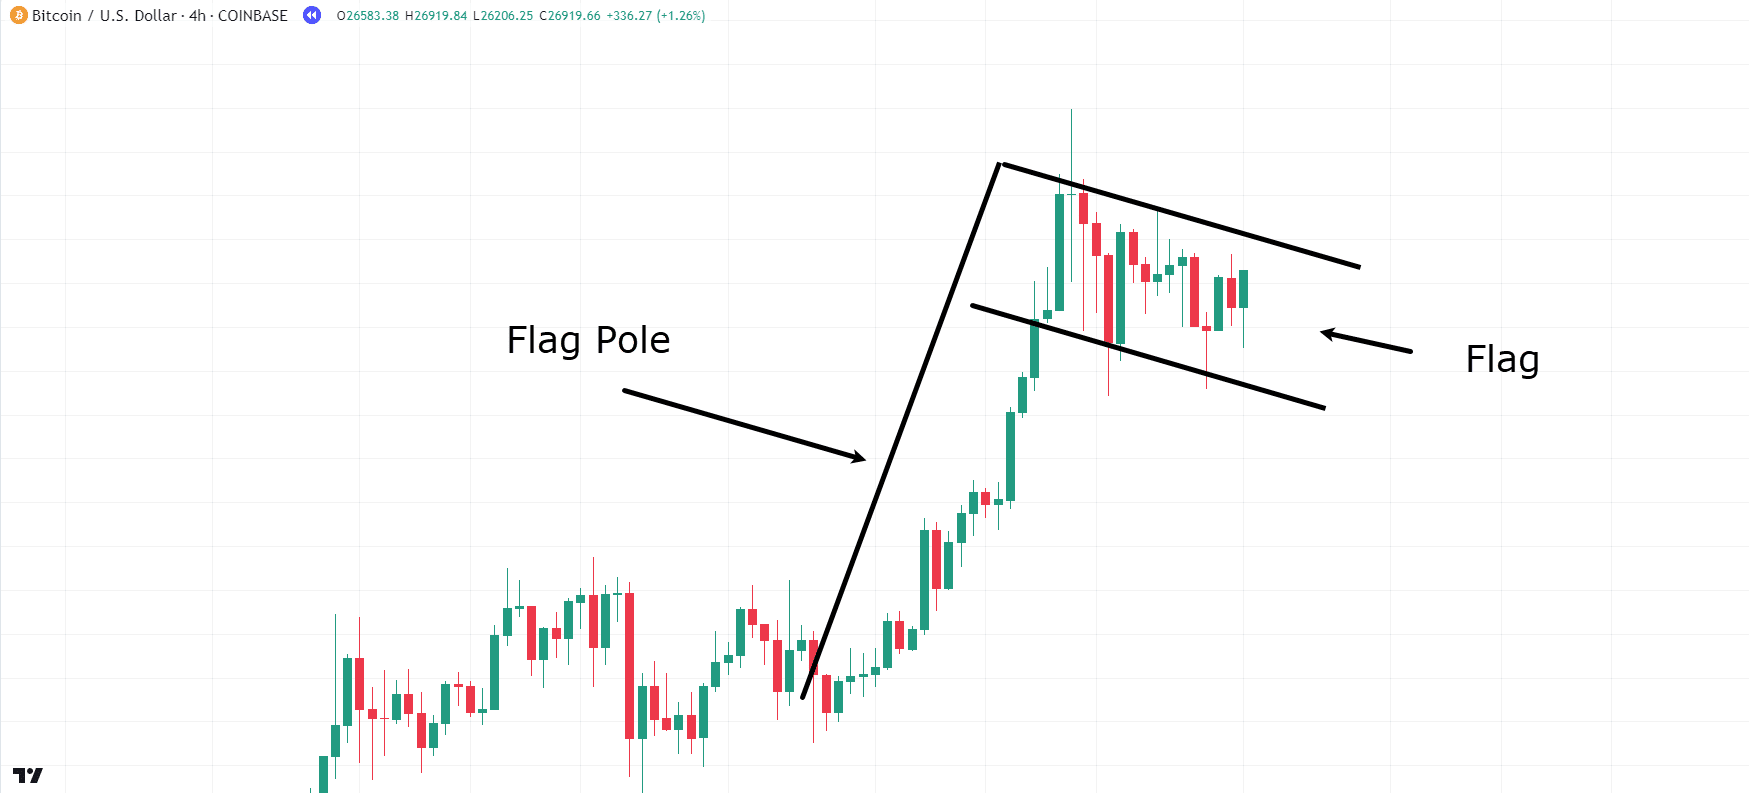
On the 4-hour chart, you can see that the price went through a strong bullish surge before consolidating.
The flag formation may be showing a downward or sideways trend; as long as the price remains within a relatively tight range, it can be identified as a flag pattern…
BTC/USD 4hr Chart Bull Flag Entry:
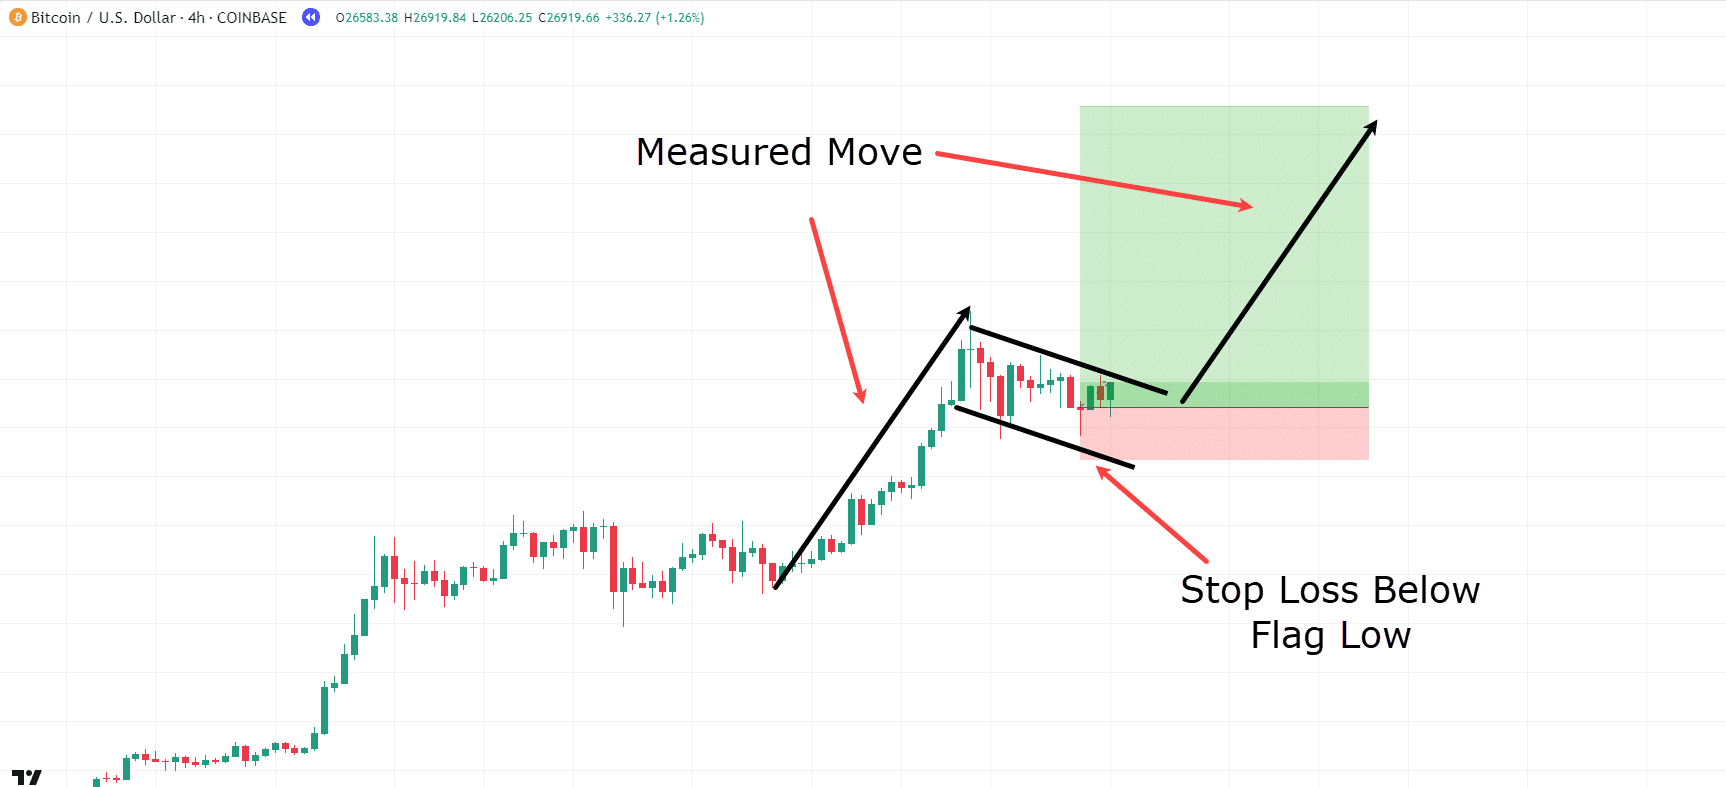
You can consider placing an entry anywhere within the flag formation.
A quick point to remember though…
It’s recommended to wait for the price to touch the support level of the flag or the bottom of the range, and see a rejection before basing your entry on the rebound from the range low.
Flags can persist for days or even weeks, so entering at the range low allows for a wider stop loss.
Now, for this example, let’s assume you placed a stop loss very close to the range low…
For your target, you have used the measured move from the initial impulse up…
Note that bull flags may not always reach their measured move, so analyze price action often and make decisions based on your trading strategy and goals…
BTC/USD 4hr Chart Bull Flag Exit:
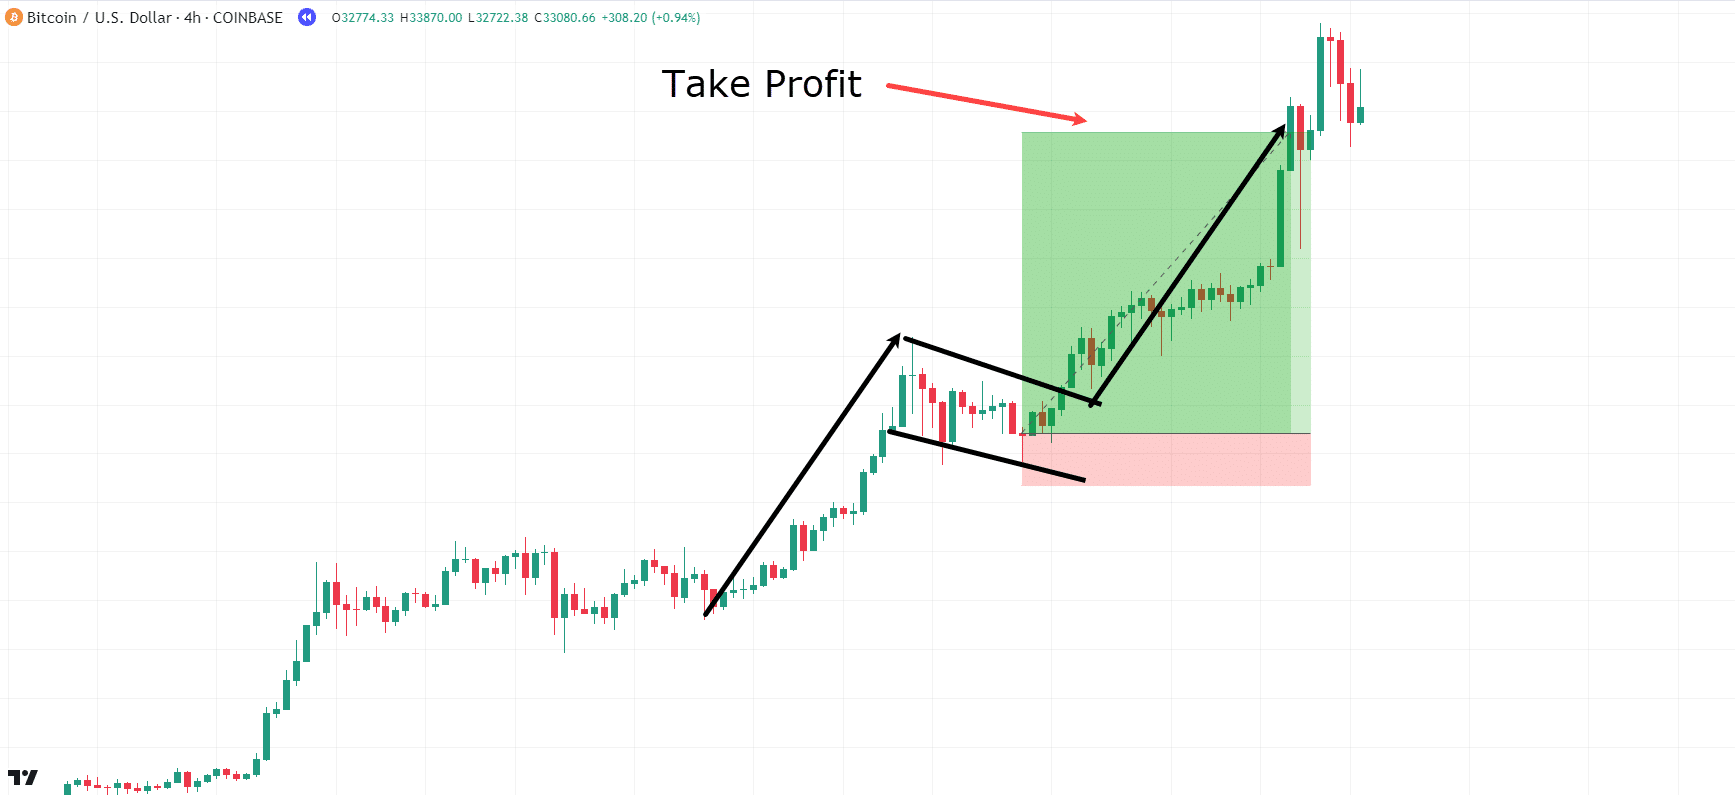
Congratulations on a successful Bull Flag trade!
This pattern tends to perform well in highly volatile markets, such as the cryptocurrency market.
Now, let’s explore the final pattern, which is similar to the Bull Flag: the ascending triangle!
Ascending Triangle
The ascending triangle is another continuation pattern that shows a solid upward trend followed by a short-term stop in price as it forms a series of higher lows and equal highs.
After that, the price stays put until it reaches the equal highs of the triangle and then breaks out in continuation…
Ascending Triangle Example:
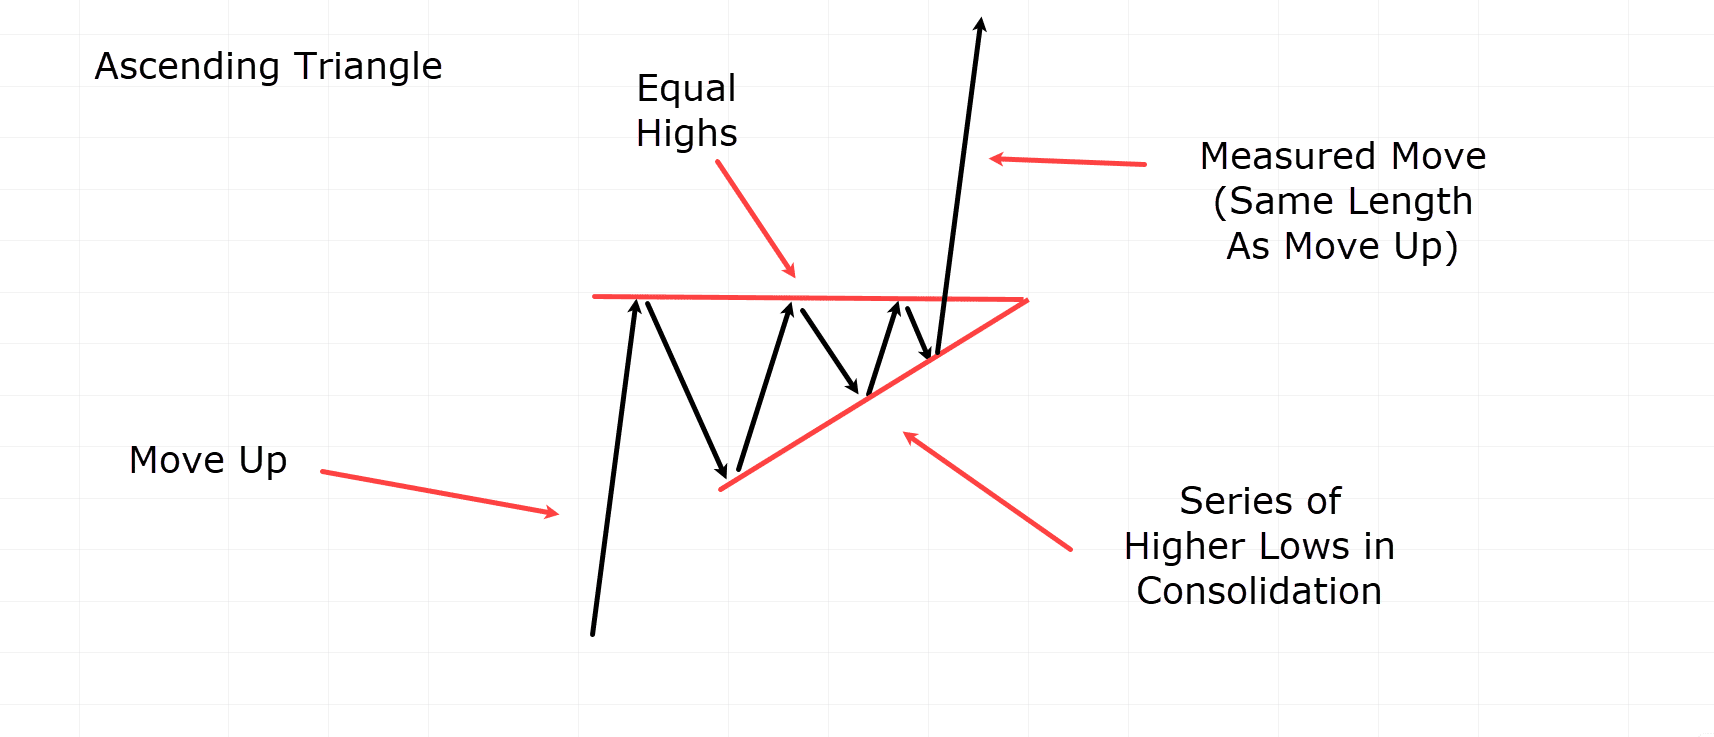
Similar to the Bull Flag, the measured move of the ascending triangle matches up with the initial price move up to consolidation.
Let’s explore another example, this time using Bitcoin after a significant bullish surge…
BTC/USD Uptrend Example:
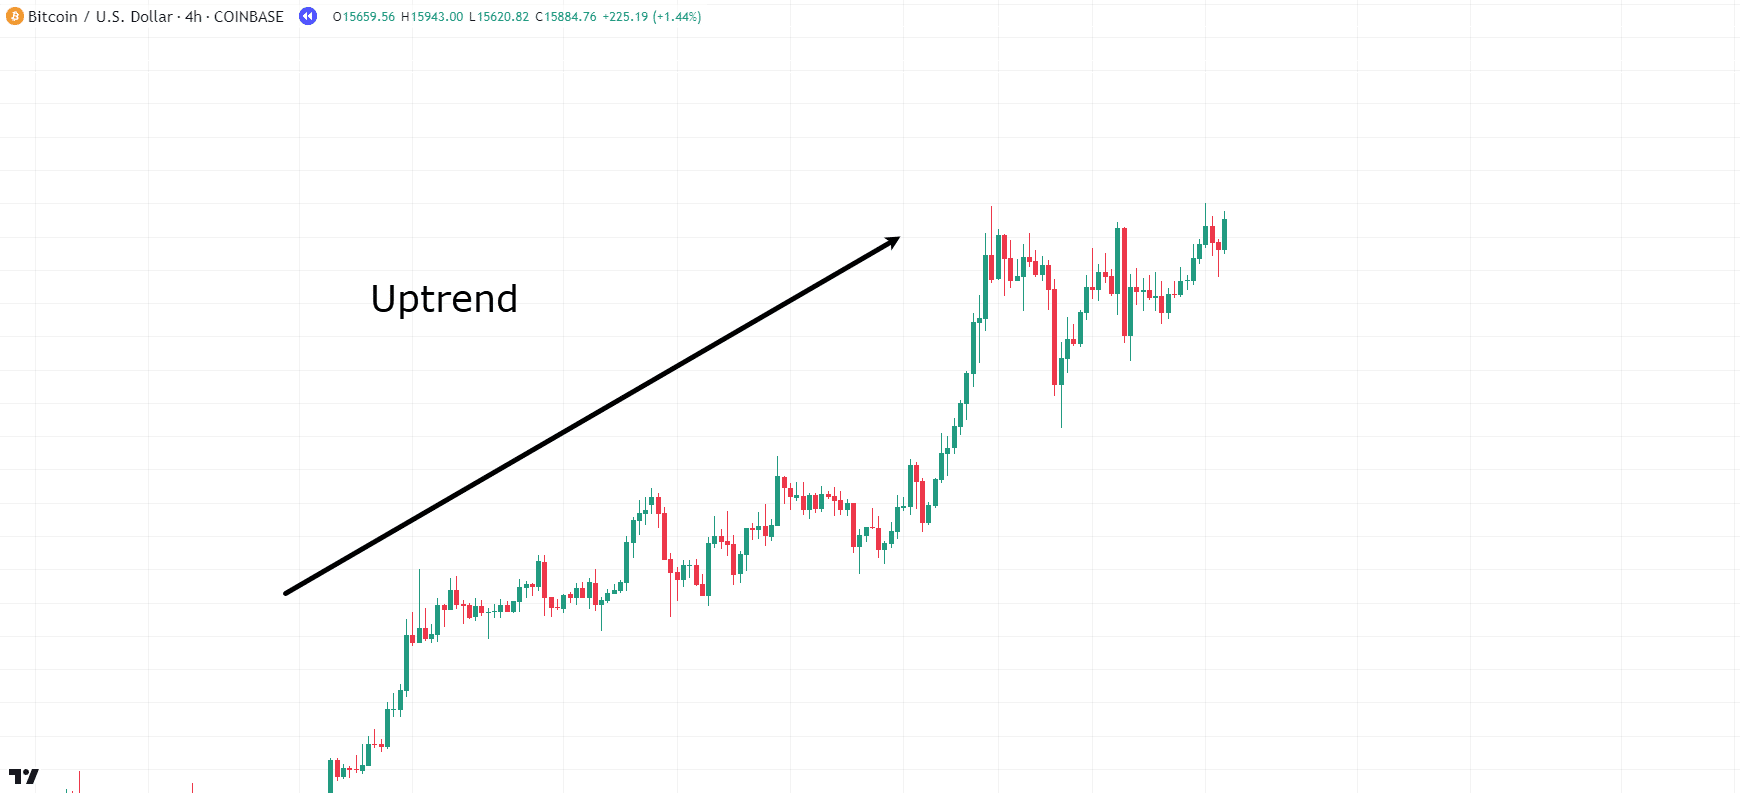
For an Ascending Triangle continuation pattern to form, a strong bullish uptrend is necessary…
BTC/USD Ascending Triangle Example:
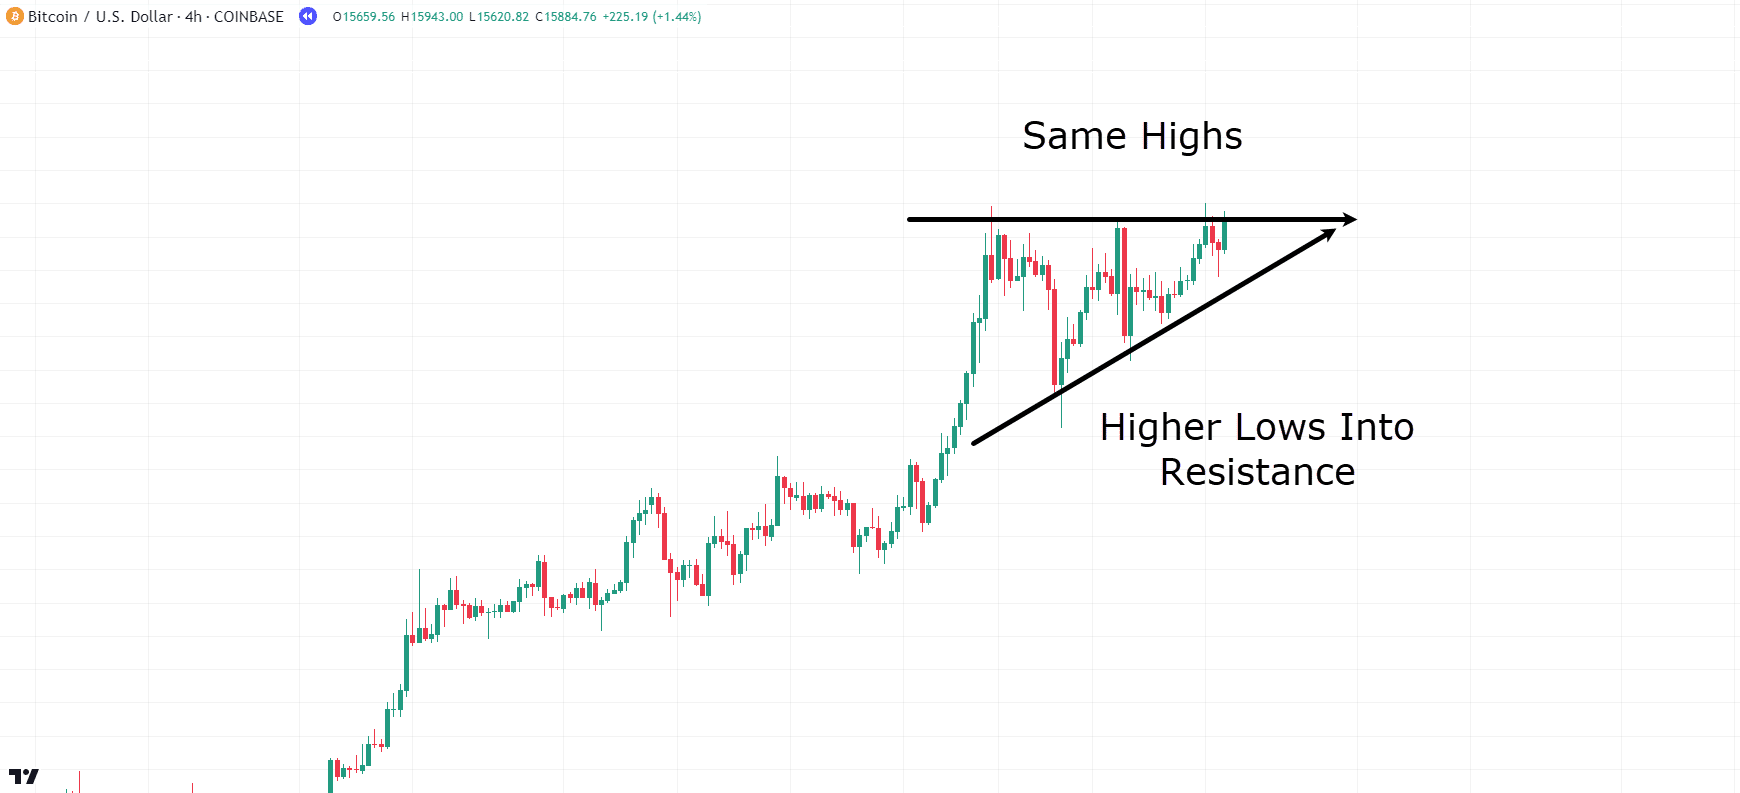
As the diagram shows, price forms higher lows while coming across the same highs…
This pattern shows how the price doesn’t form a lower low and gradually tightens towards the resistance level.
Ultimately, as the price continues to squeeze tighter, the resistance eventually gives way!
Let’s explore potential entry points…
BTC/USD Ascending Triangle Entry Options:
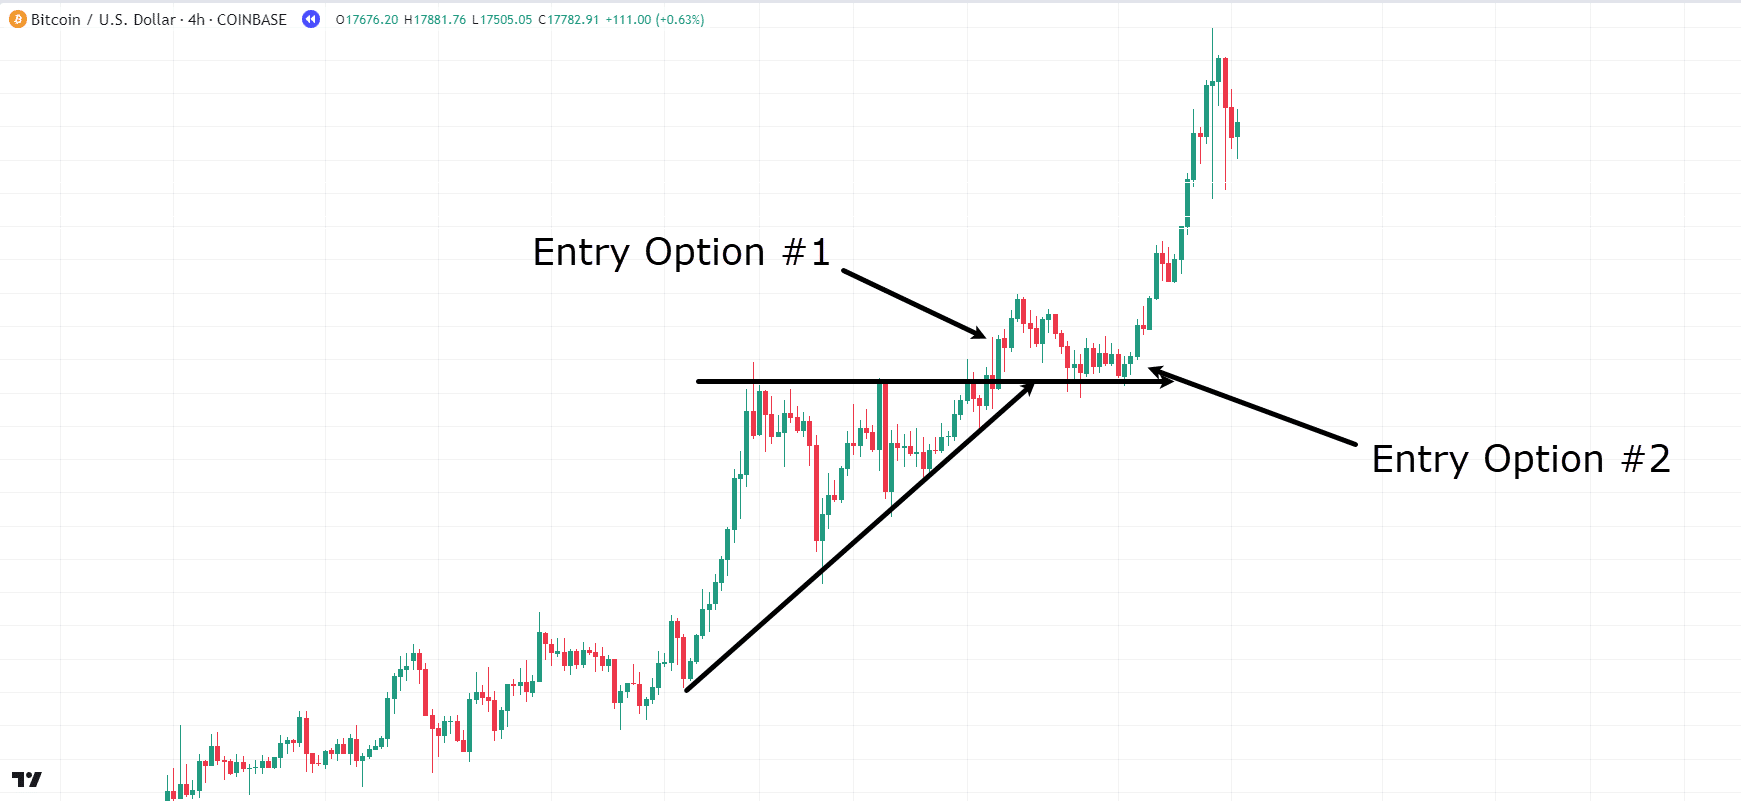
In the chart, there are several entry options available:
- Entry Option #1: Enter as the breakout above the top of the triangle occurs.
- Entry Option #2: Wait for a retest of the resistance-turned-support line.
Going for the second entry option gives stronger confidence in the breakout, but there’s a risk of missing the trade if a retest doesn’t happen…
So did this trade reach its measured move?
Let’s take a look!…
BTC/USD Ascending Triangle Measured Move:
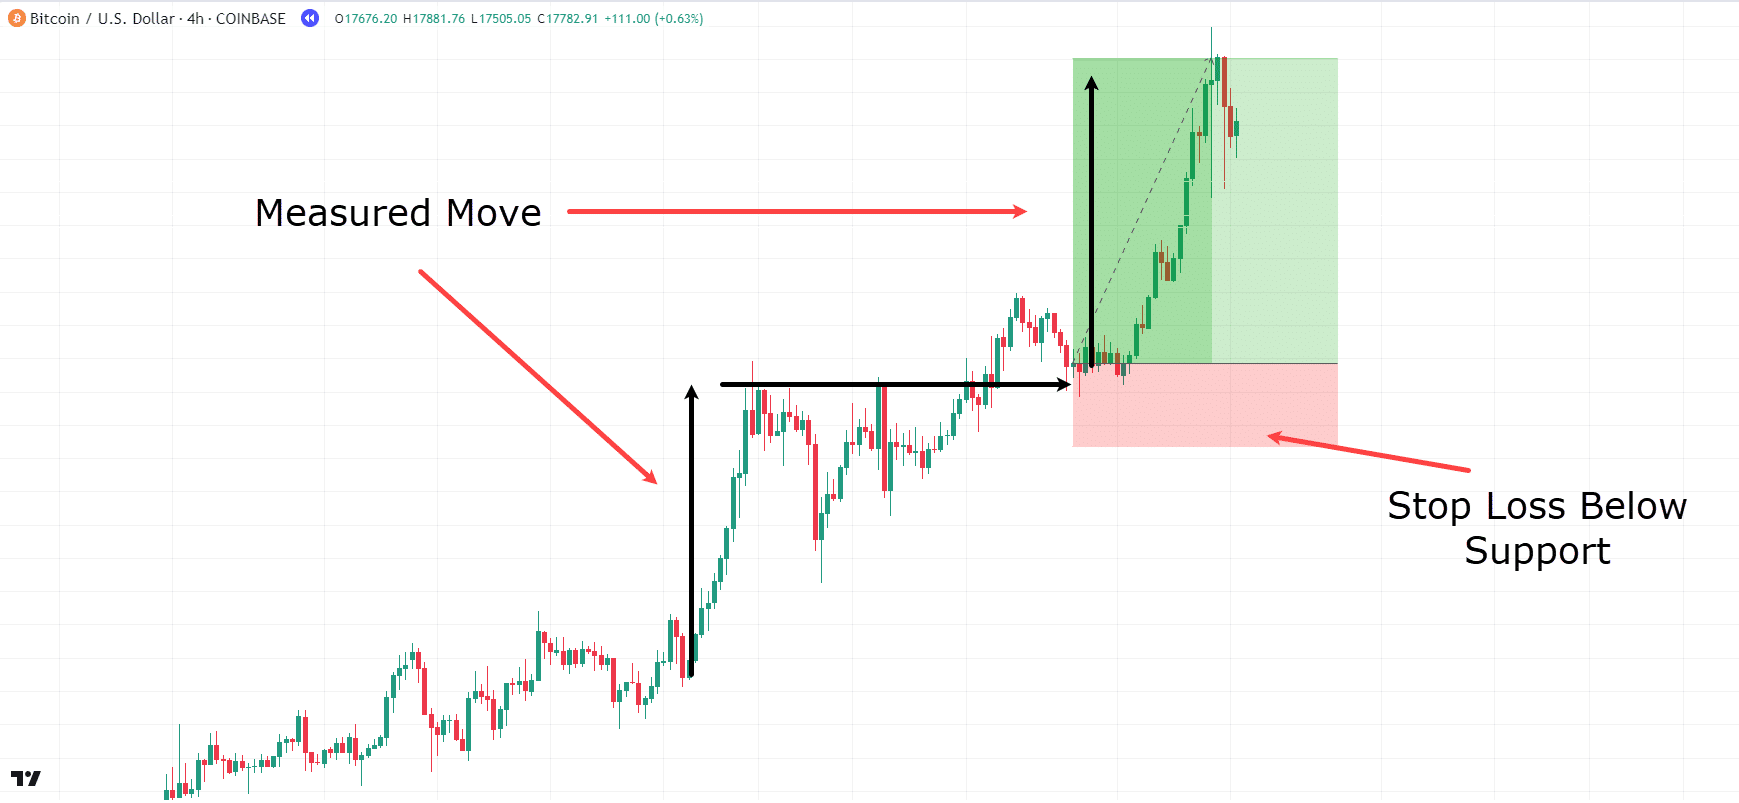
Well, how about that – the price reached the measured move distance as shown!
The stop loss for this example was placed safely under the resistance or triangle top, and the trade was entered on the retest rather than the breakout this time.
So… Congratulations!
You now can master the core continuation and reversal patterns!
You’re already well on your way to trading a variety of market conditions much more effectively!
Now let’s get a few more hints in there…
Tips when Trading The Chart Patterns Cheat Sheet
Flexibility
Understand that trading patterns require flexibility.
Patterns come in various forms, and slight variations in their structure don’t necessarily make them void!
Rather than being super strict about rules, view patterns as an art form that adapts to market conditions and nuances.
Profit Taking
While patterns like the Head and Shoulders do offer measured move targets, you need to look at the broader context of the trend.
Sometimes, it’s much better to ride the entire trend rather than just exiting at the pattern’s target.
Take a good look at your trading goals and the overall market trend to work out the best profit-taking strategy.
Use with other trading tools!
Patterns can show you valuable entry and exit signals, but they shouldn’t be used just by themselves.
Combine them with other technical indicators like candlestick patterns, support and resistance levels, and moving averages to round out your trading decisions.
Extra layers of analysis can provide confirmation and strengthen your trade setups.
Patterns are Fractal
Understanding that patterns are fractal in nature is crucial for traders.
Ok, I hear you…
“What do fractals have to do with it?”
Essentially, it means that patterns can appear across any time frame, from the smallest to the largest.
Let me show you what I mean…
Fractal Example Head And Shoulders Pattern:
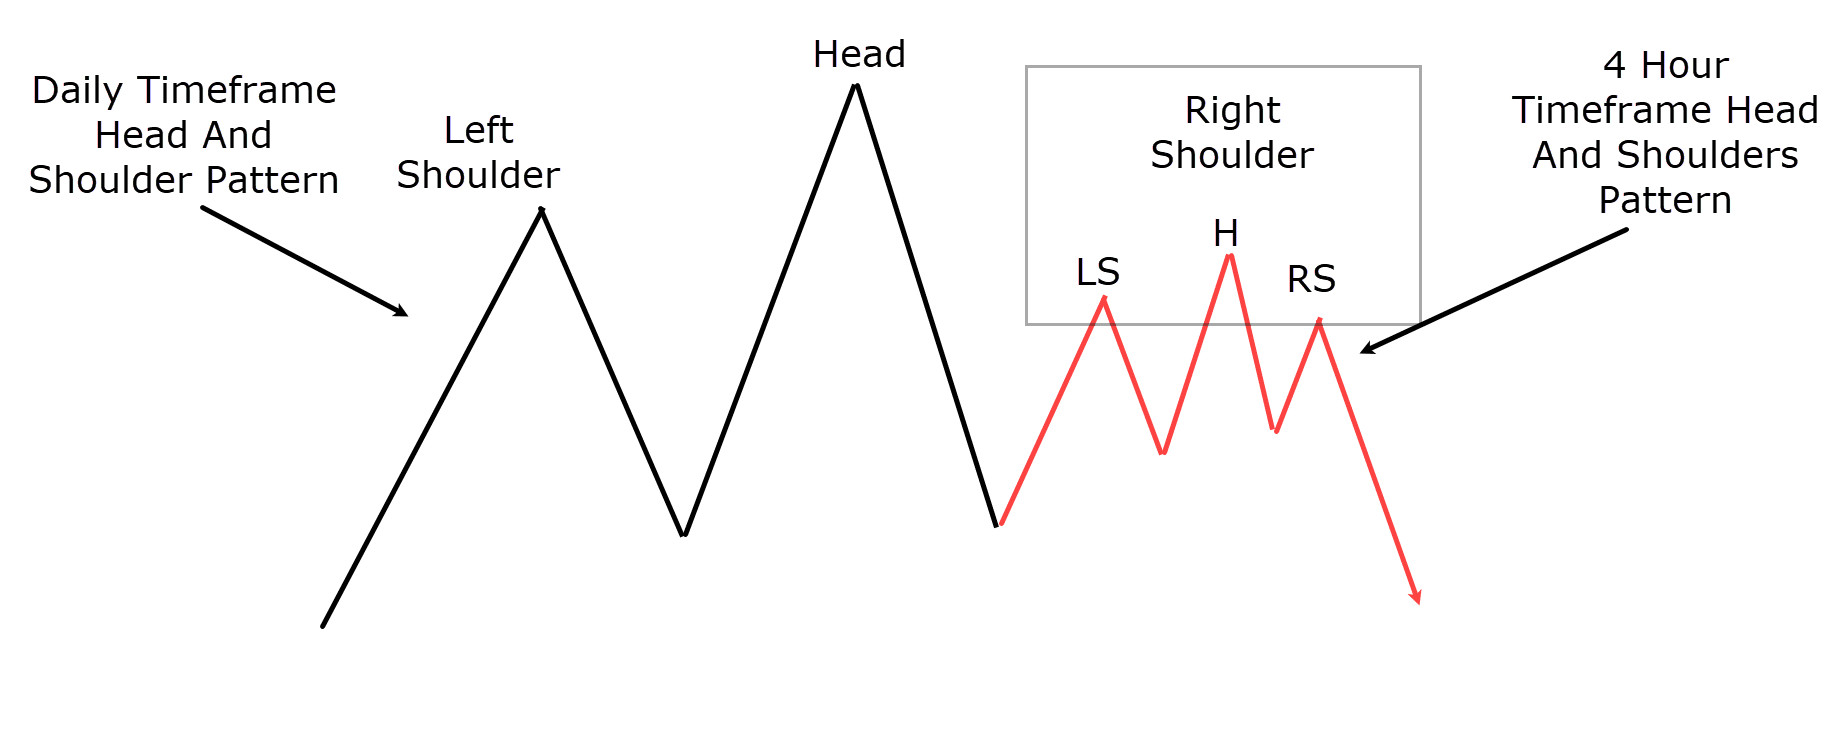
In this example, the chart actually displays two instances of the Head and Shoulders pattern.
On the daily timeframe, you can see the primary Head and Shoulders pattern unfolding…
But if you zoom in a bit, you can also see the right shoulder of the pattern forms a Head and Shoulders pattern on a lower timeframe.
This is all well and good, but – how could it affect your decision-making?
Well, firstly, it boosts the strength of the sell signal.
With two bearish patterns forming, and the second one matching up with the end of the higher timeframe pattern, you can have more trust in your analysis.
Secondly, it means you get a more precise entry point!
Instead of using the daily head as the stop-loss level, you could potentially use the lower timeframe head as the stop-loss zone…
This change creates a tighter stop-loss, giving a better risk-to-reward ratio for the trade.
Now, it’s important to recognize that, akin to candlestick patterns, the higher timeframe patterns carry more significance than those on lower timeframes.
But at the end of the day, it really shows that patterns can be pretty fractal, right?
Limitations Of Using The Chart Patterns Cheat Sheet
While patterns can be powerful tools in trading, you do need to understand their limitations.
Patterns don’t always work
Like all aspects of trading, patterns aren’t foolproof and may not always produce what you’d expect!
Lots of things influence market movements, making it impossible to guarantee the success of any one trade.
When a pattern fails to materialize as expected, it’s crucial to remain calm and analyze the situation.
Instead of becoming frustrated, think about why the pattern failed and open up to changing your viewpoint based on what the market is showing you.
For example, if a head and shoulders pattern fails, it might signal that the market is taking the neckline as a support level, which means it’s time to change up your trading strategy in that case.
Patterns aren’t Identical
One challenge traders face when dealing with patterns is their variability in shape and size.
It’s common for patterns to have slight deviations from textbook examples… which can often lead to analysis paralysis!
Traders may hesitate to execute trades, maybe due to minor differences in the way a pattern looks.
So, it’s important to recognize that no pattern will look identical in every case.
Overcoming this hurdle requires focusing on the core principles of the pattern – and not worrying so much about minor details.
Conclusion
So, in conclusion, I hope you can see how chart patterns are vital assistants for your trading!
Whether revealing potential reversals, or continuations in the market, they offer valuable insights into market dynamics and help uncover great opportunities.
By finding big changes in market structure and flow, reversal patterns show you when a trend might change and when it is time to get in at the start of a new trend.
On the other hand, continuation patterns show times of consolidation and short breaks before main trends resume, giving you chances to enter positions that are going with the trend.
Armed with this understanding, you can begin navigating the markets with more confidence, making better trading decisions based on these patterns!
To summarize, in this article, you’ve:
- Gained crucial knowledge about the value of chart patterns and their role in market analysis.
- Explored various types of patterns, including reversal and continuation patterns.
- Learned about five specific patterns through real-world examples, enabling you to master their application in your trading.
- Discovered valuable tips to enhance your pattern trading strategies and gain a competitive edge in the market.
- Recognized the limitations and risks associated with trading patterns, highlighting the importance of risk management.
So – congratulations on adding these powerful tools to your trading arsenal!
A solid understanding of chart patterns will increase your chances of finding solid trading opportunities.
Now – I’m eager to hear your thoughts on chart patterns too!
Have you used chart patterns before?
I know there are plenty out there, so let me know if you have a favorite that isn’t listed in the article!
Share your insights in the comments below!
I’m use chart patterns in multiple time frames for analysis market, chart patterns is very useful for analysis trend in all charts.
Yes it is, Milad!
Glad it helps!
thanks rayner, it was an indepth analyses of patterns determining trends and therefore guide us in trading.
You are most welcome, Zaldy!
Bullish and bearish penant
Thanks, Okamma!
Bravo
Excellent explanations and illustrations of chart paterns with actual chart examples, exactly what I was looking for. Copilot guided me to this page. Thank you!
Hey there, Walt!
Glad to hear it helps you!
Cheers!
Thank you so much, this is a master piece.
You are most welcome, Selorm!