
This post is written by Jet Toyco, a trader and trading coach.
If you’re a beginner trader, you’d probably learn things like support and resistance, moving average, etc.
Not surprisingly, the trend line is often overlooked.
That’s a shame because the trend line is like a swiss army knife—you can use it for multiple purposes.
So in this post, you’ll discover:
- What is a trend line and how to identify it
- Why aren’t all trends created equal and what you can do about it
- 3 different types of trend lines every trader must know
- How to trade and profit from the trend lines shown in different types of trends
Sounds good?
Then let’s get started!
What is a trend line and how to identify it
Let’s go back to the basics…
Shall we?
So, a trend line is a technical trading tool that helps you look for areas of value on a trend.
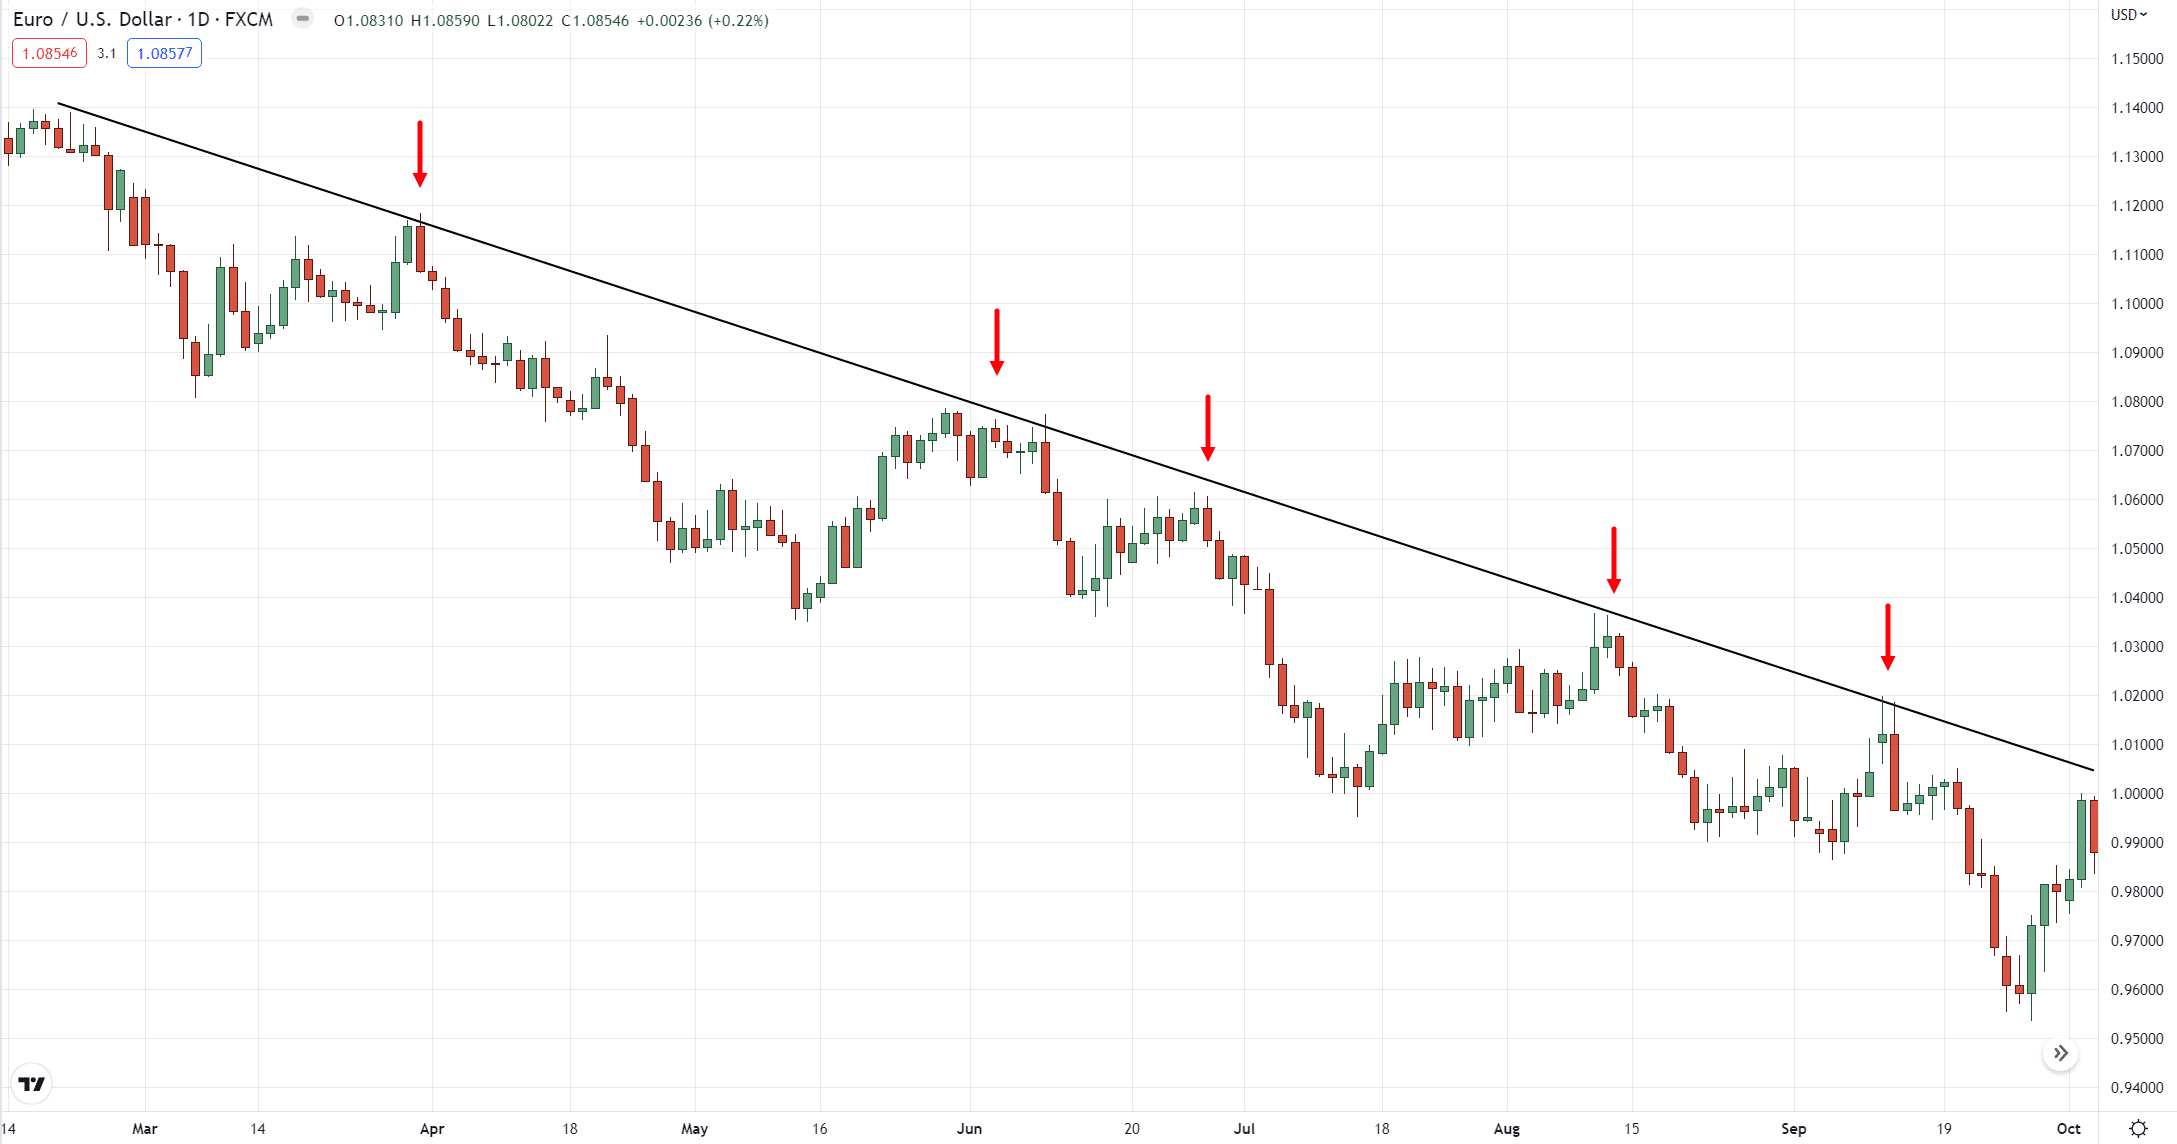
If the price has respected that area of trend line a couple of times, then there’s a probability that the price will bounce off the trend line’s area of resistance once again.
Wait…
Did I say area?
That’s right, it’s an area of value and not a single line!
So, why should you plot your trend line as an area instead of a line?
Simple!
It fixes one common issue traders usually face when using trend lines.
Here’s an example…
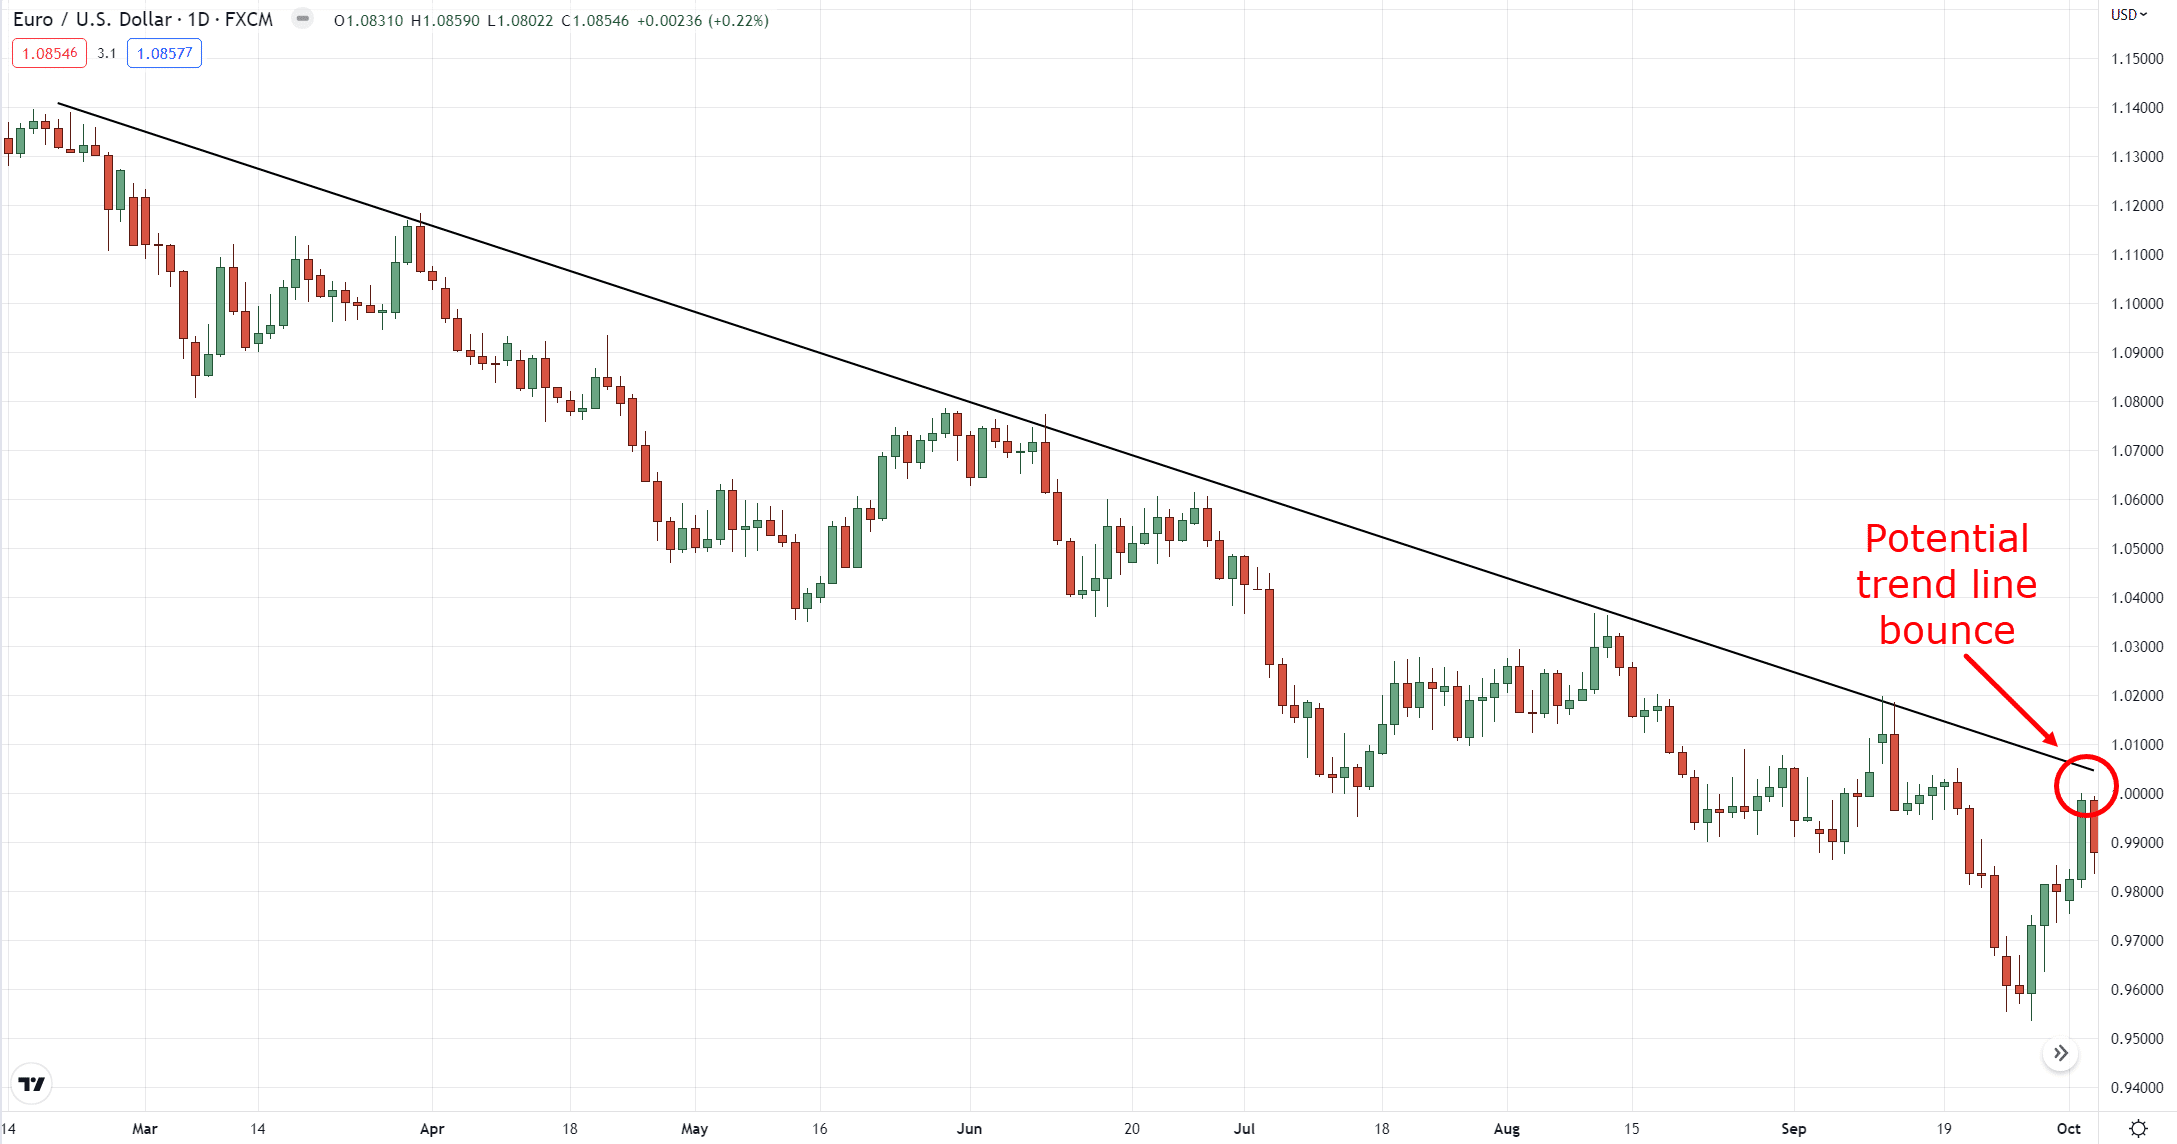
Should you plot your trend lines like this?
Hmm, doesn’t seem right…
How about this?
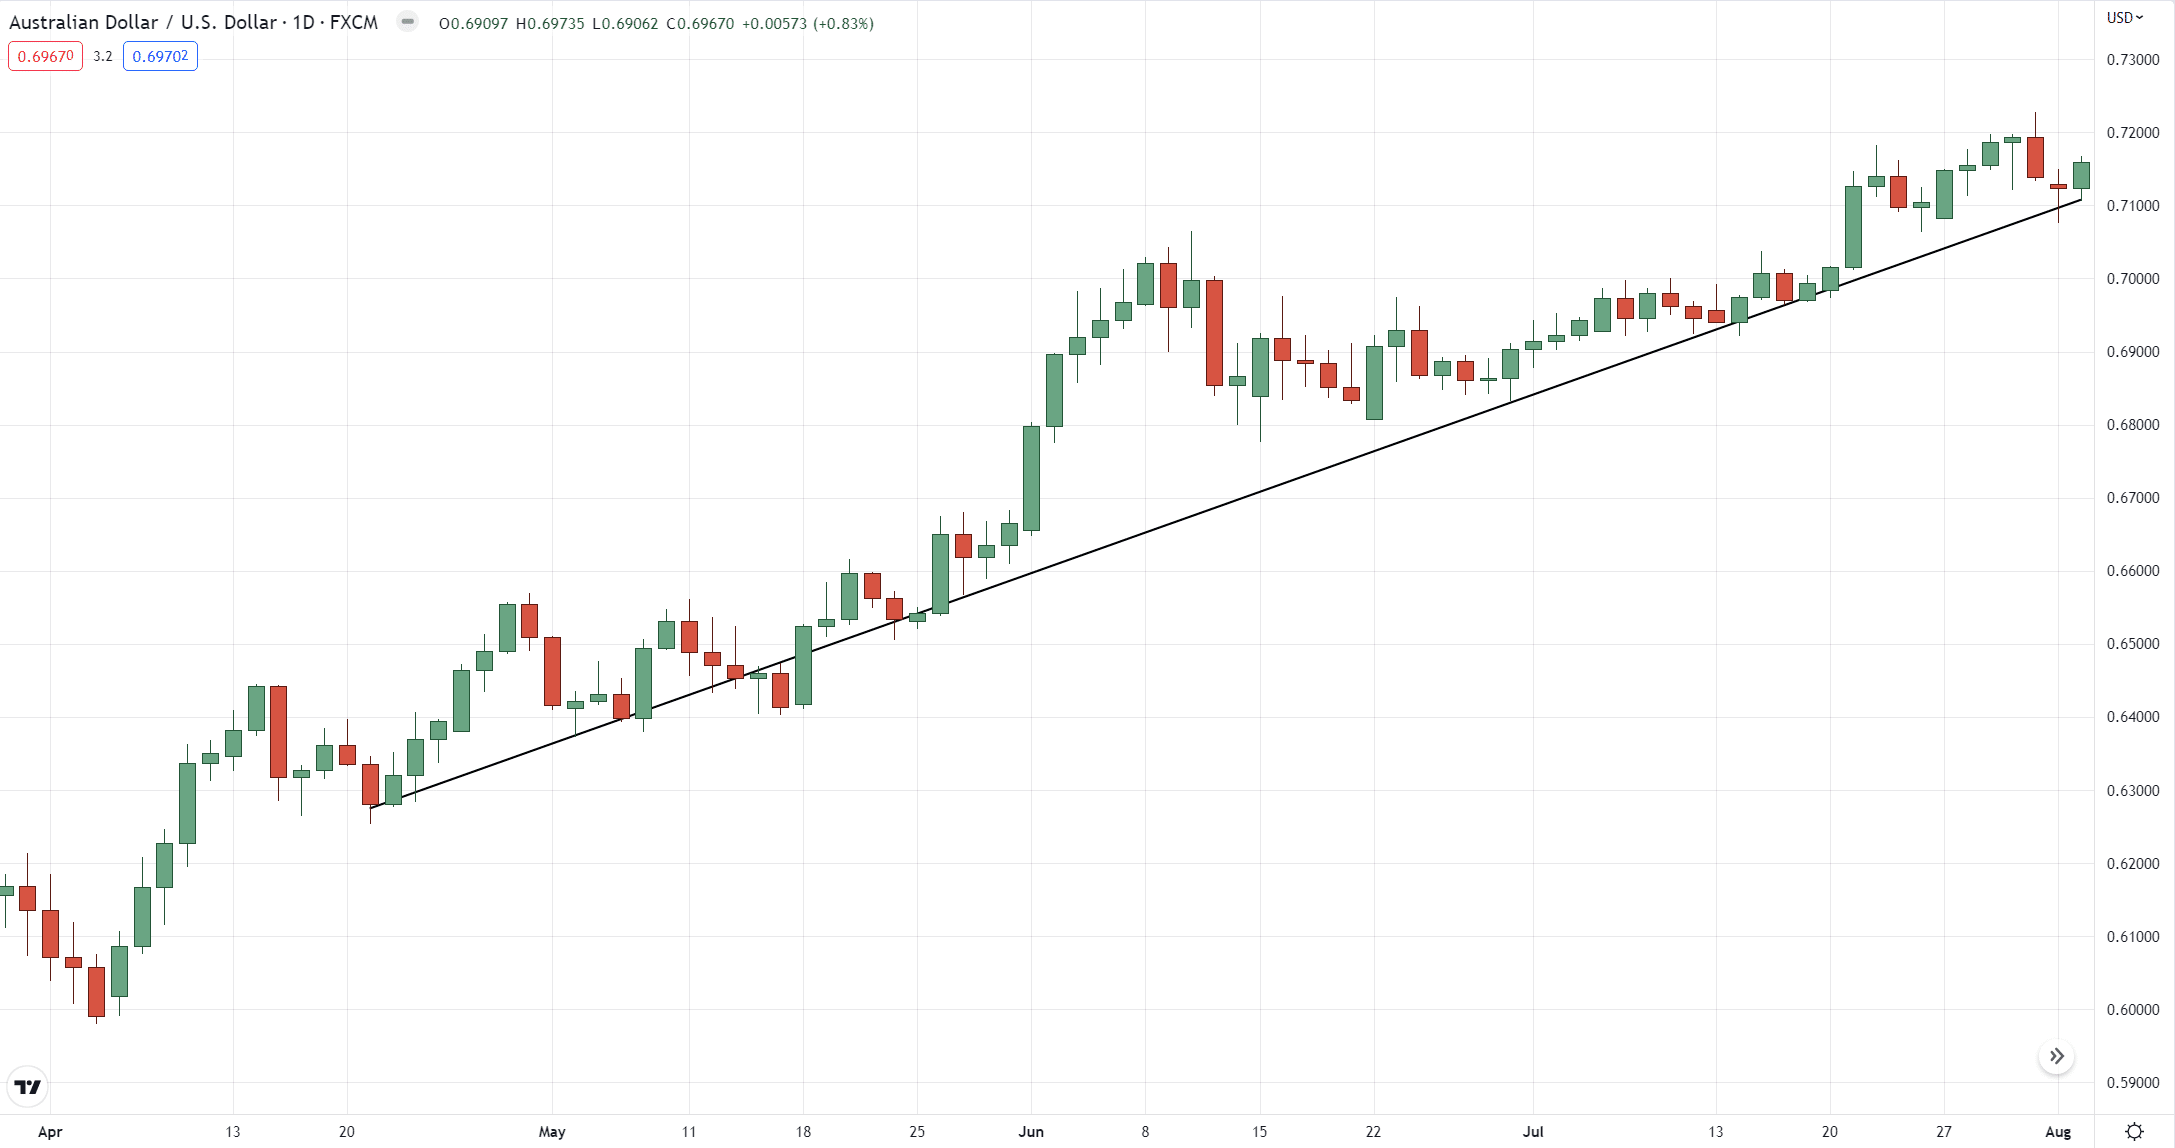
Nah, still doesn’t look right…
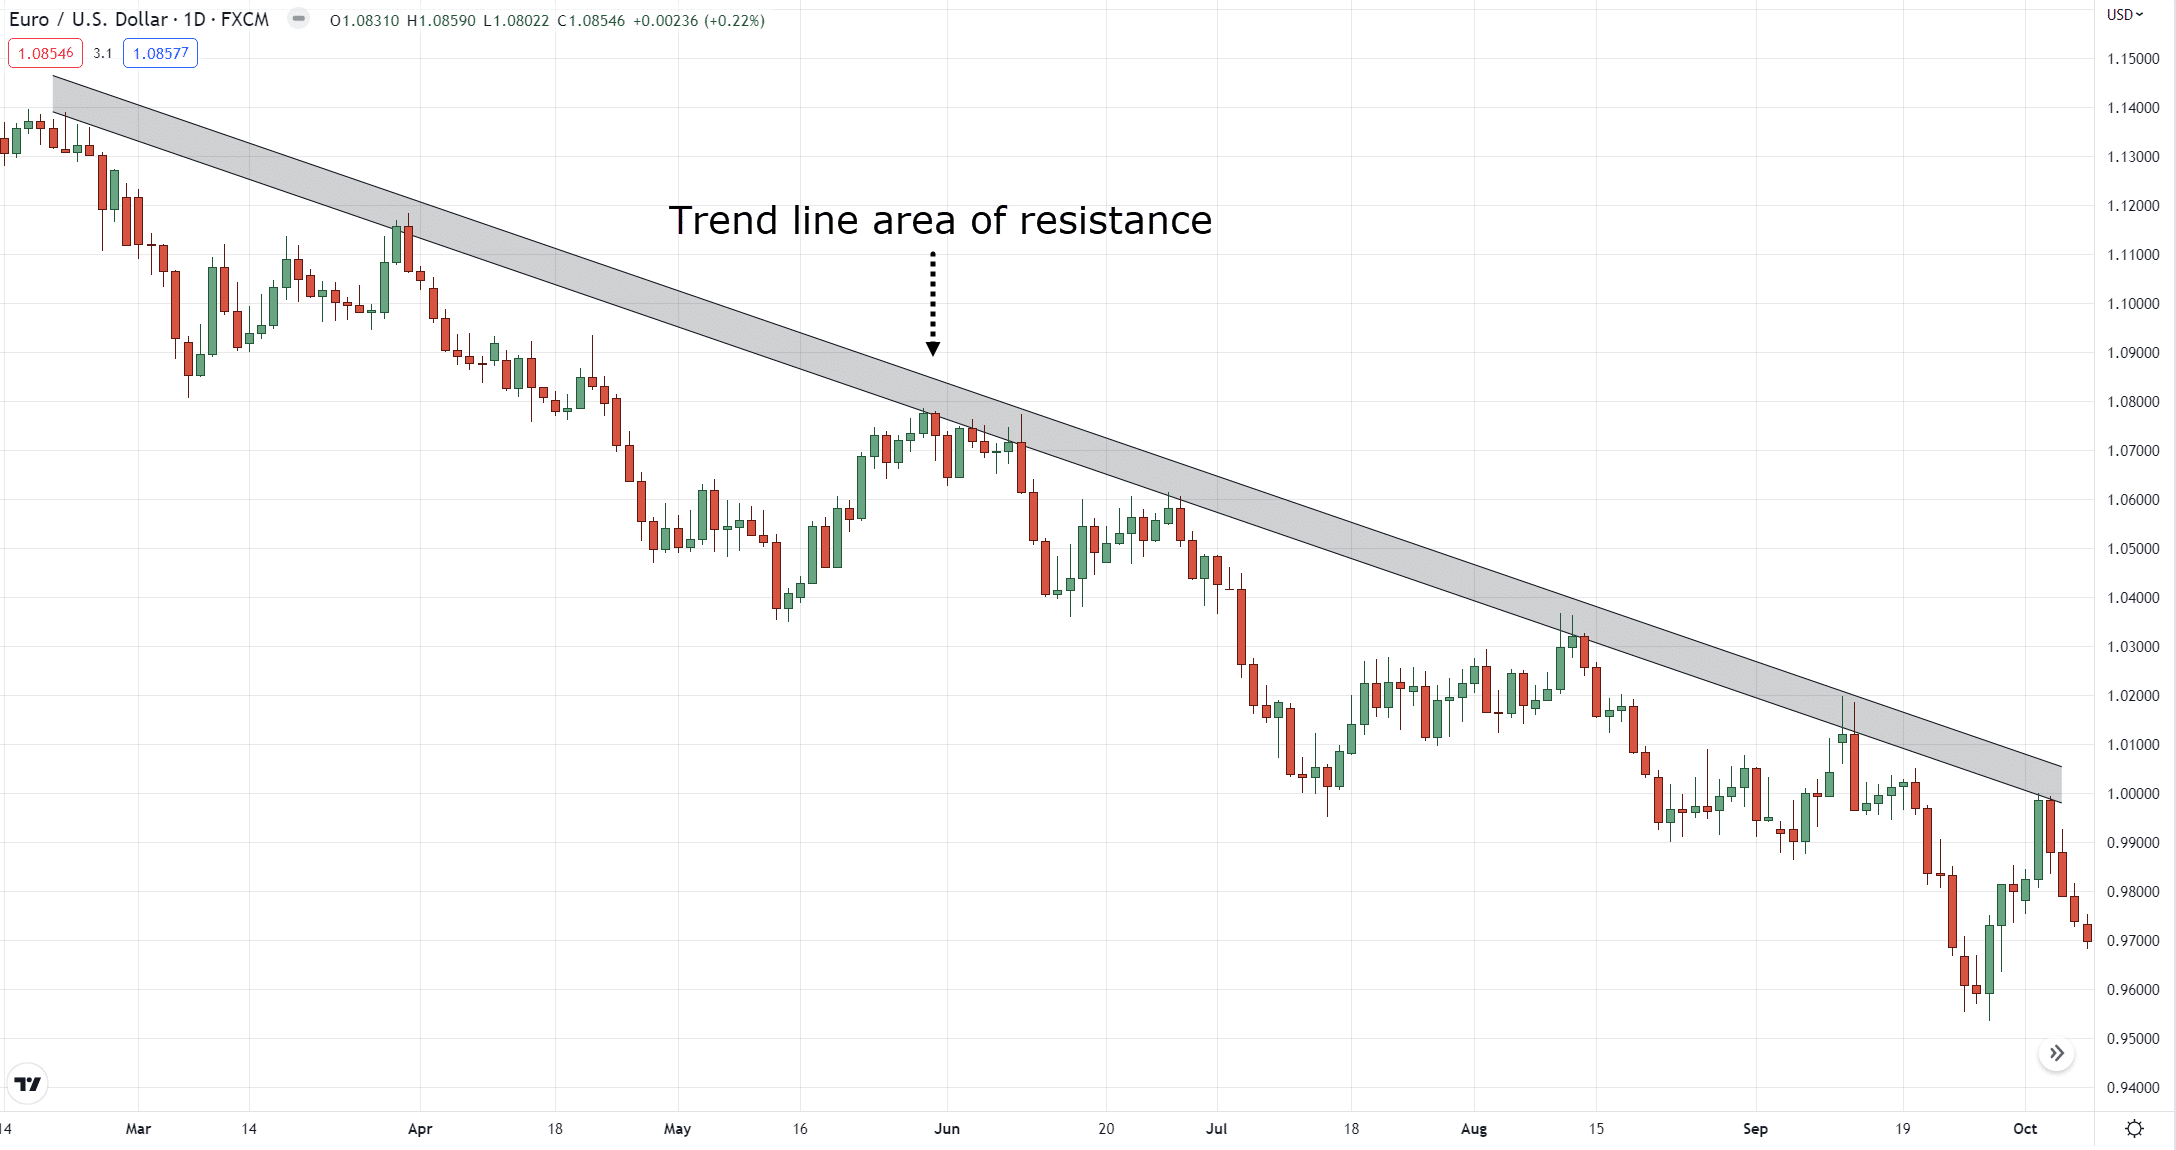
Now let’s try plotting it as an area.
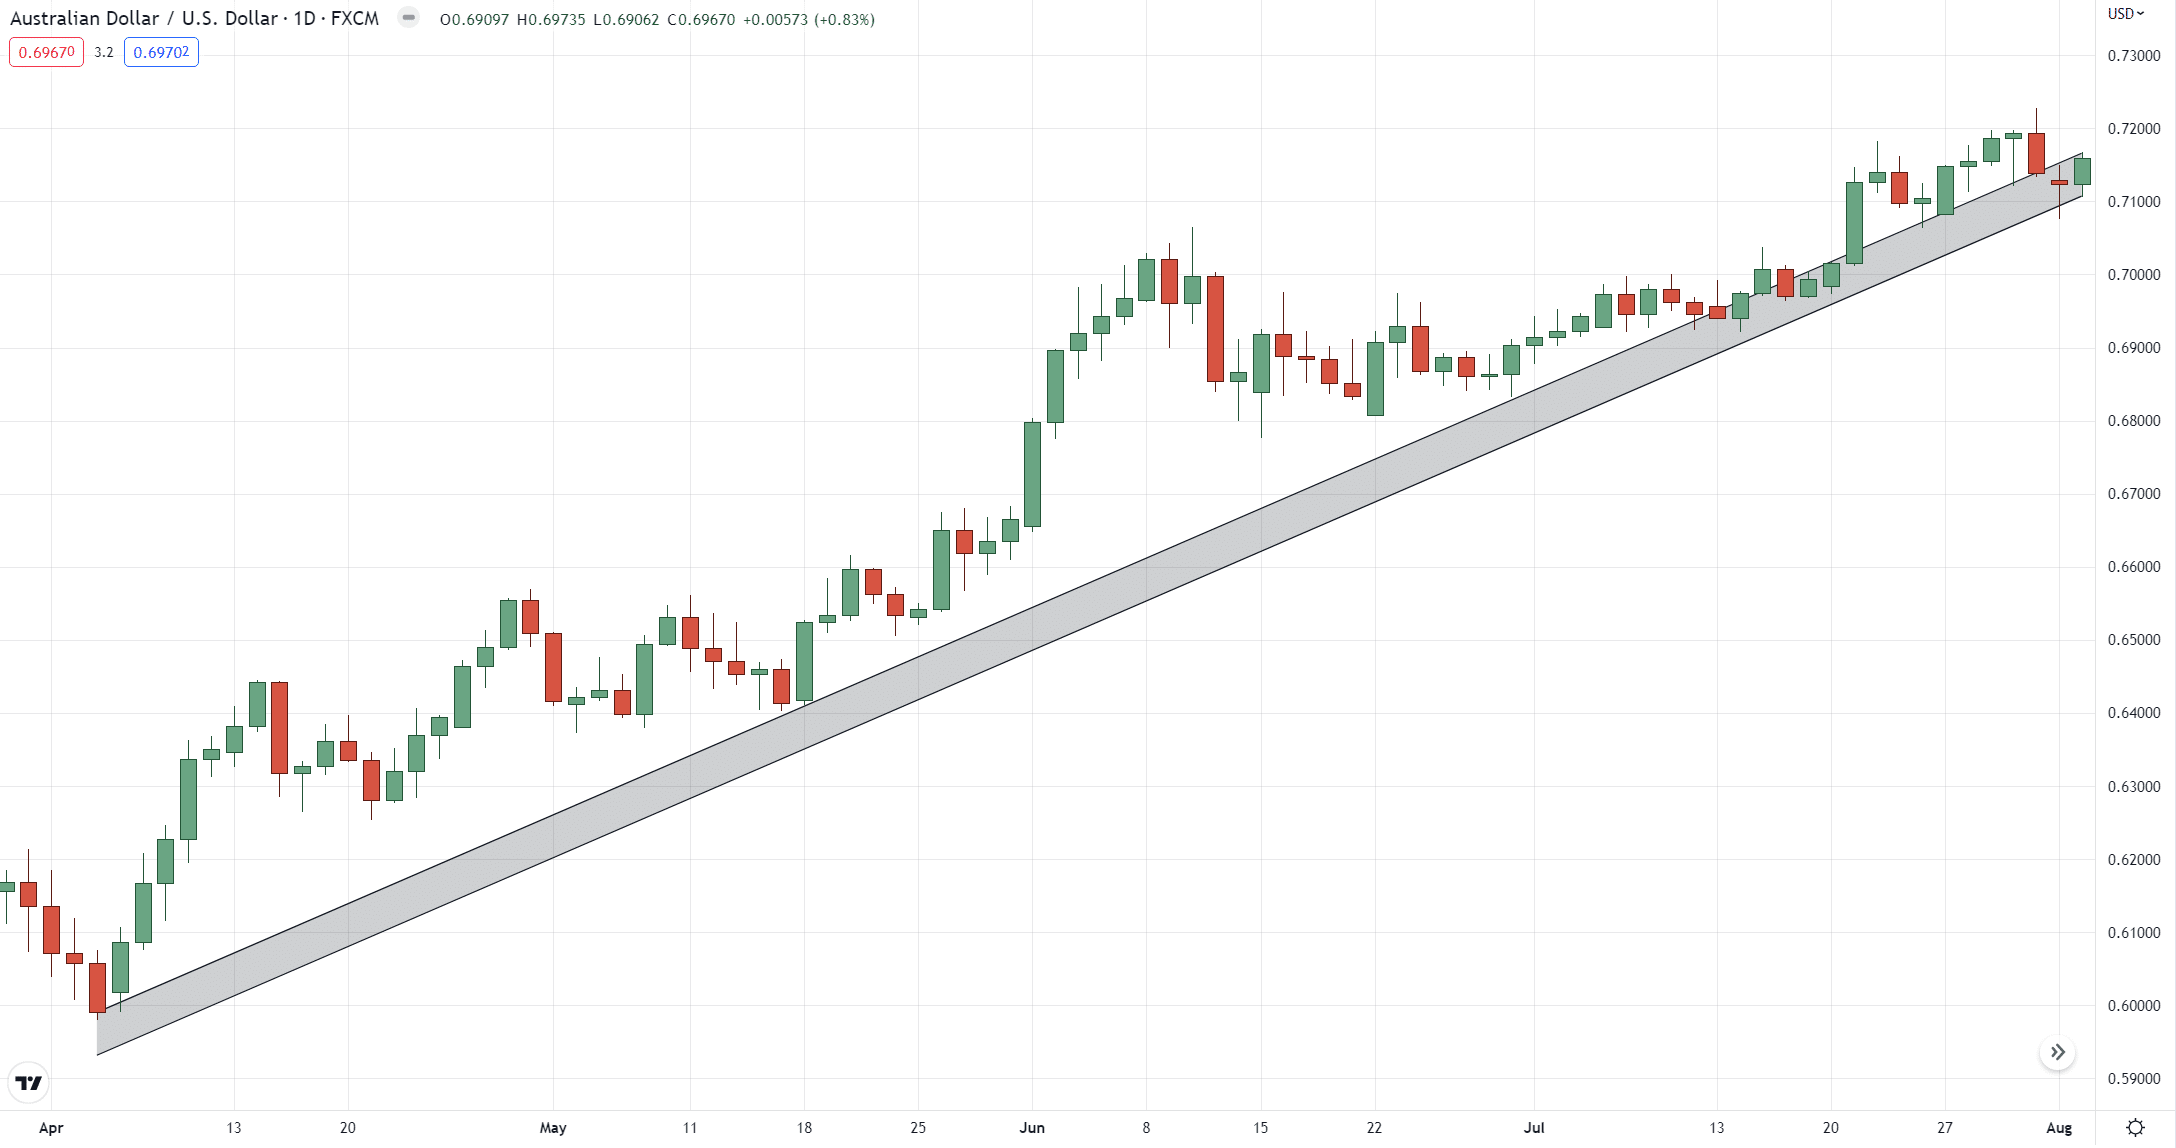
Boom!
So, you see…
Plotting your trend lines as an area takes into account all previous data and volatility in the markets!
Not only that, it gives you more accurate information on “when” to capture trends when they make a pullback…
Makes sense?
Now that your mind has been refreshed on what a trend line is and how it’s meant to be plotted…
How do you use it?
It doesn’t make sense to know how to analyze it if you don’t know how to use it to make money in the markets.
Before we do so!
It pays to talk about the very backbone of why we use trend lines and also why we would need to use different types of trend lines.
Ready?
Then read on…
The different types of trends nobody tells you
As you know, not all trends are equal.
So, what happens if not all trends are equal?
It means that plotting different types of trend lines isn’t equal as well!
That’s why you must know these three types of trends:
- Strong trend
- Healthy trend
- Weak trend
Let me explain…
Strong trend
Before anything else here’s what I want you to know:
Strong trends don’t last for too long.
That’s right.
These types of trends are double-edged swords where money can be lost as fast as you’ve made them!
There are many tools and indicators on how to define these types of trends.
But they all have one thing in common:
A strong increase in price in a short amount of time with sloping higher lows on your chart…
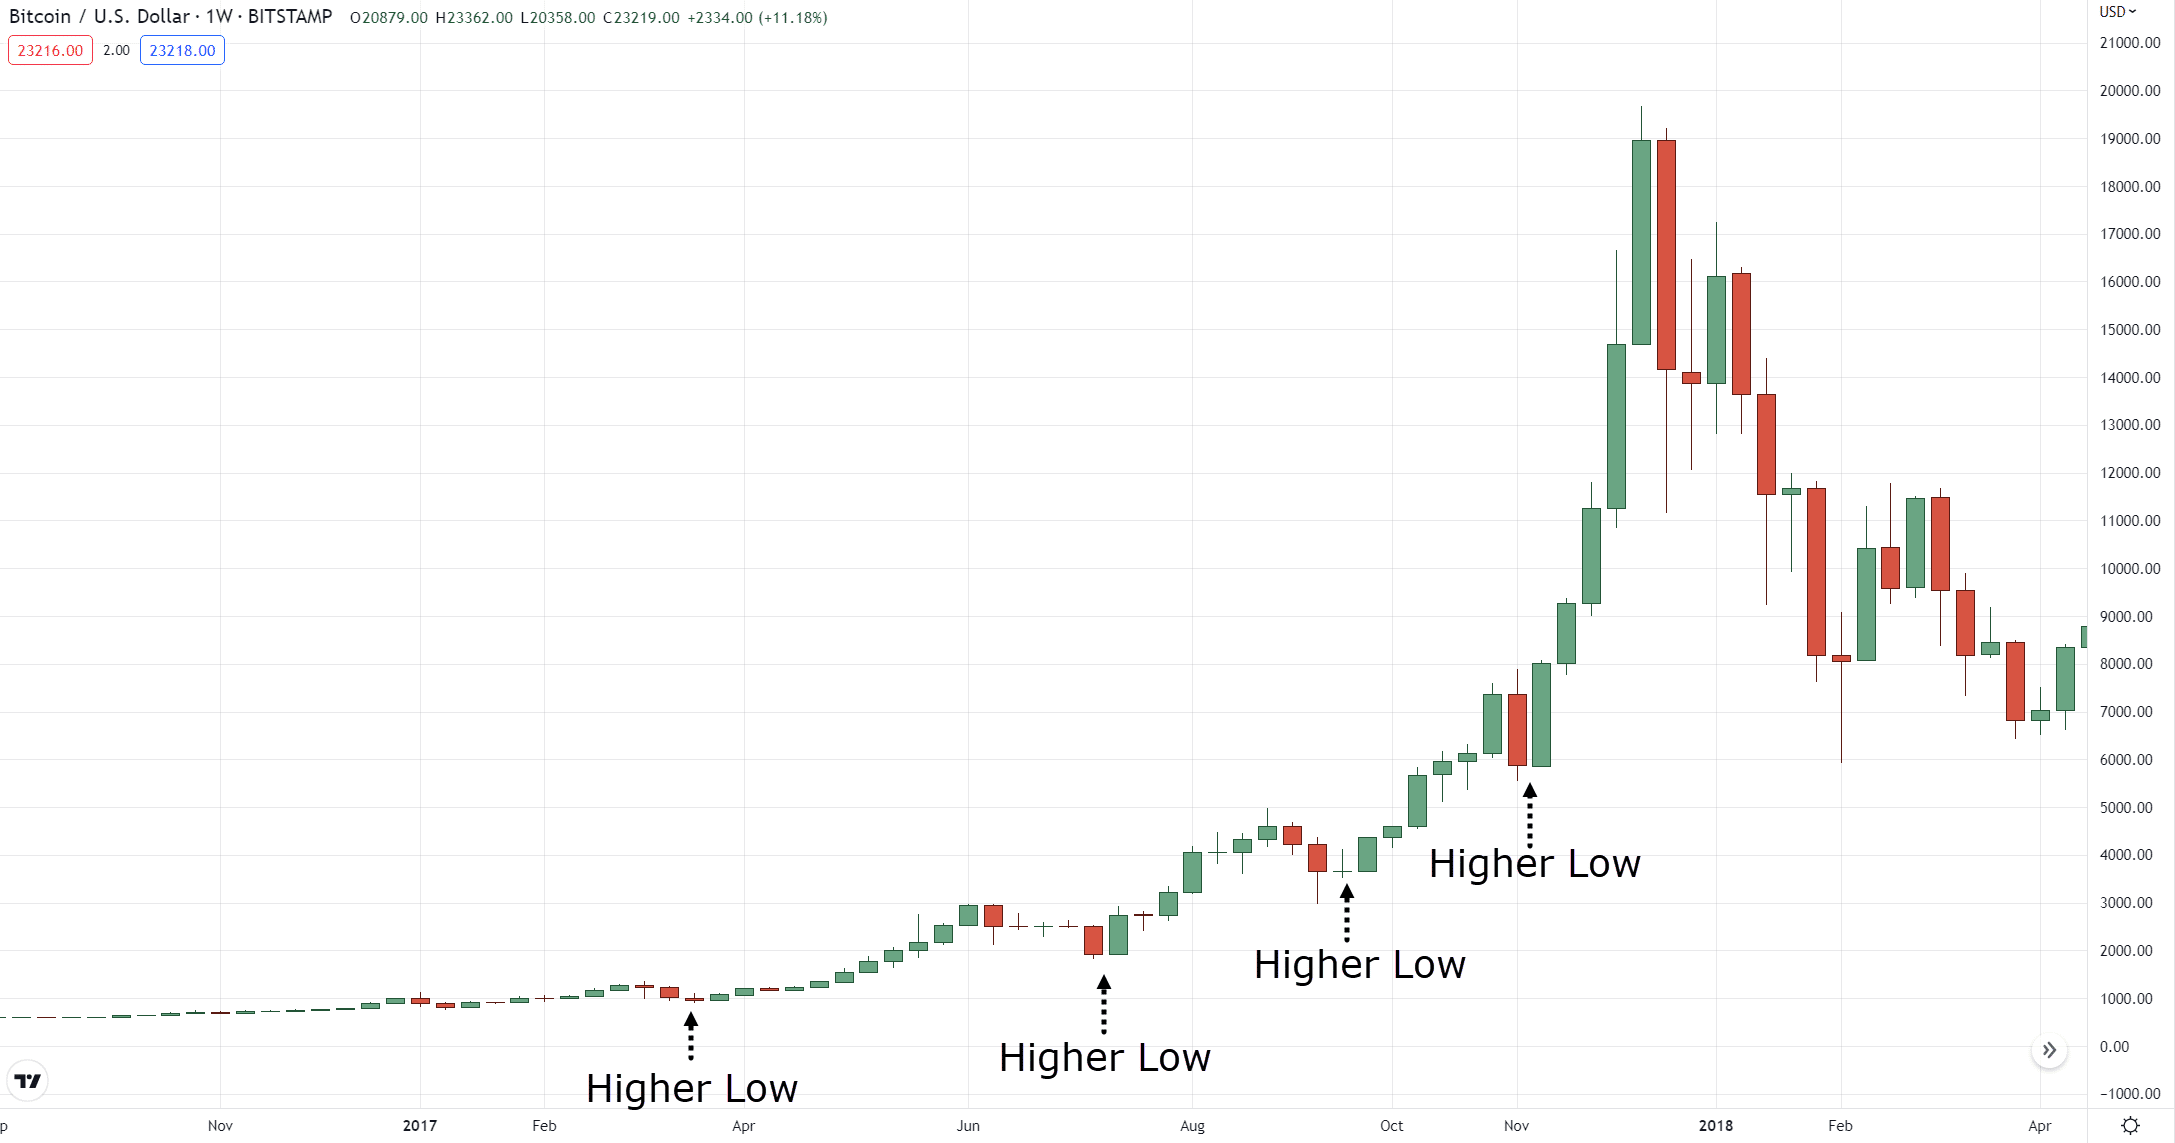
In short, strong trends are like sprinters.
They try to reach the finish line as fast as they can!
The drawback?
They get tired fast and must rest, which is the same thing for strong trends.
Now, how about healthy trends?
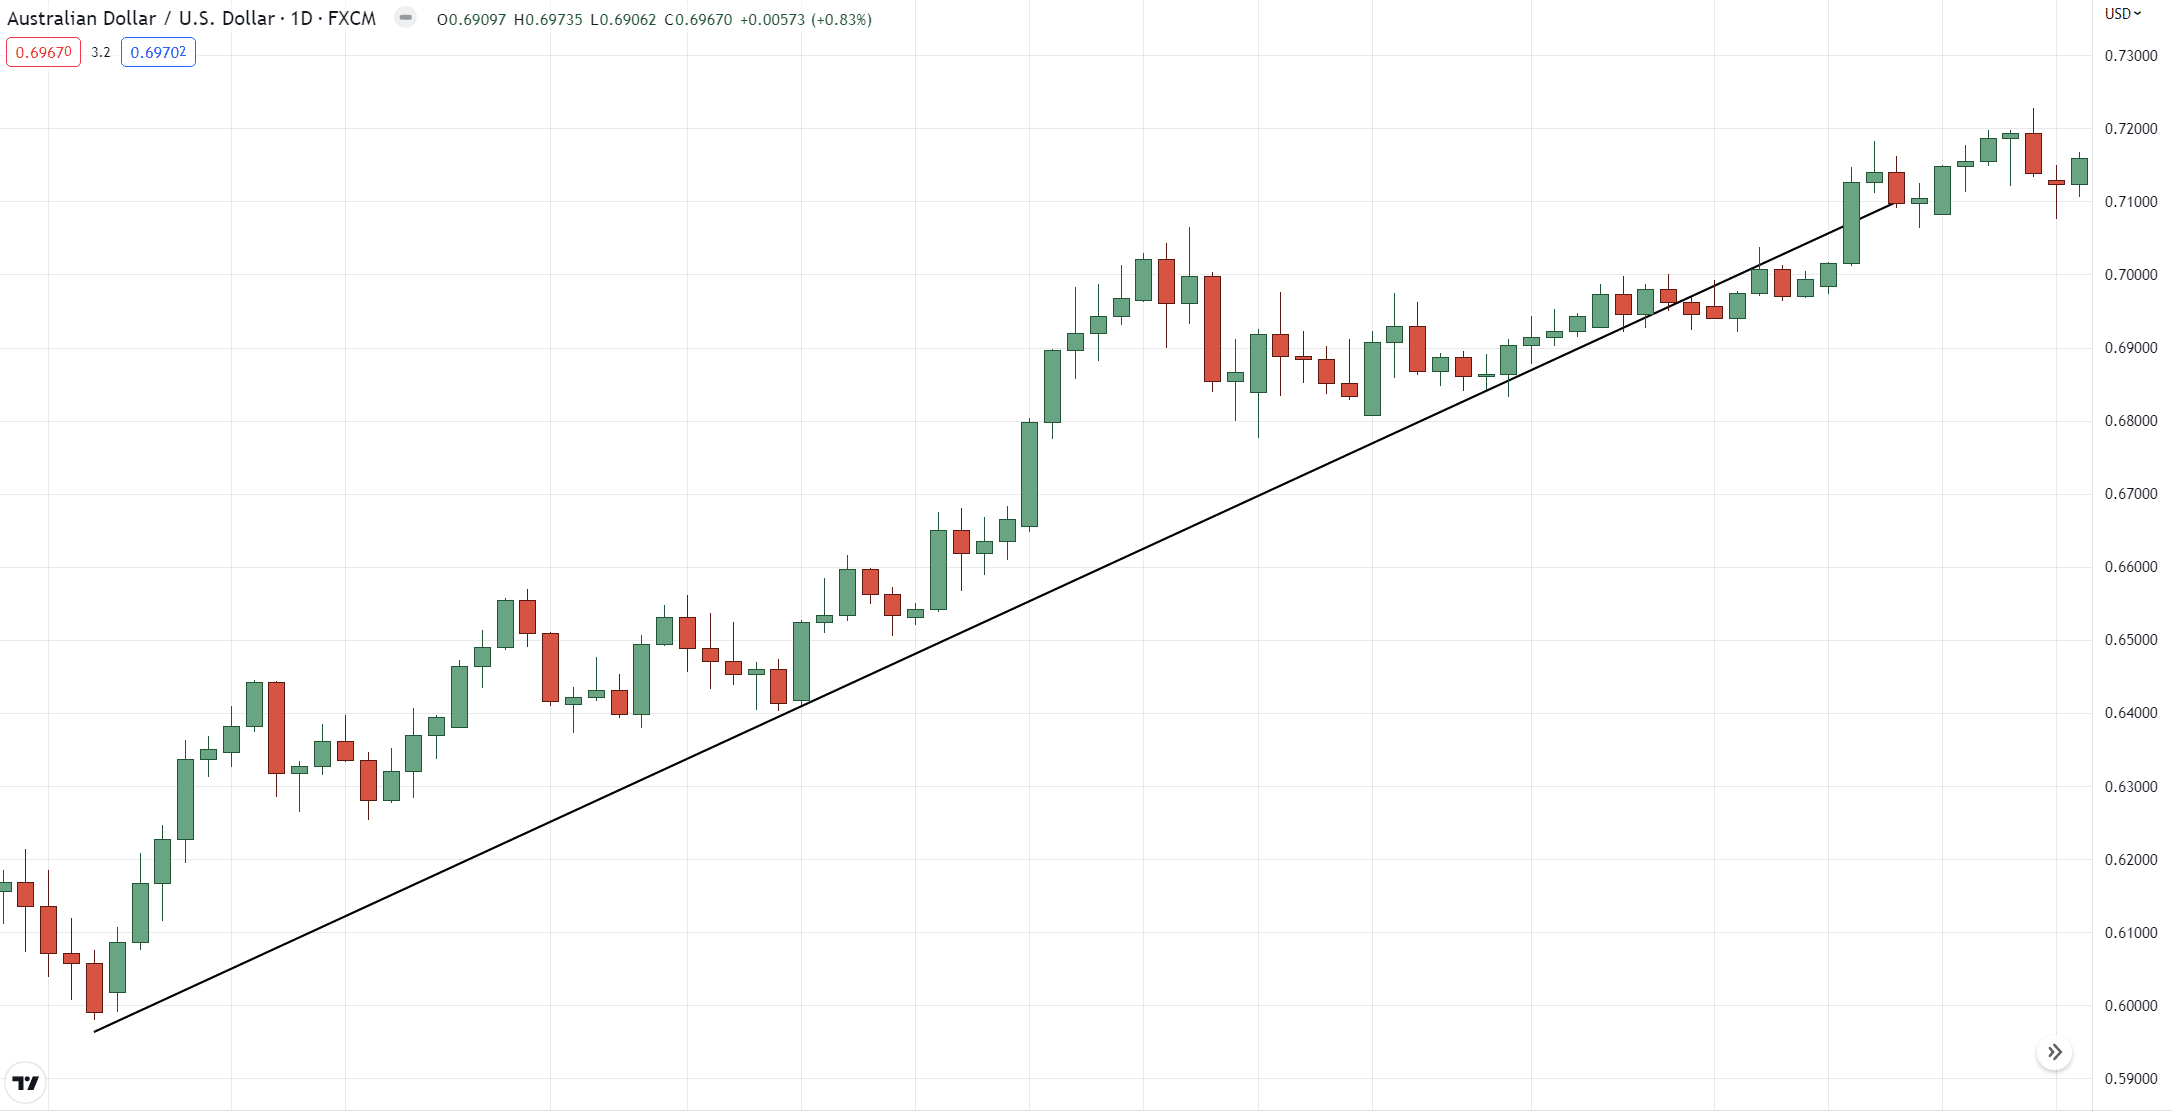
Healthy trend
These types of trends are my favorite types of trends.
Why?
Because they often last more than strong trends, of course!
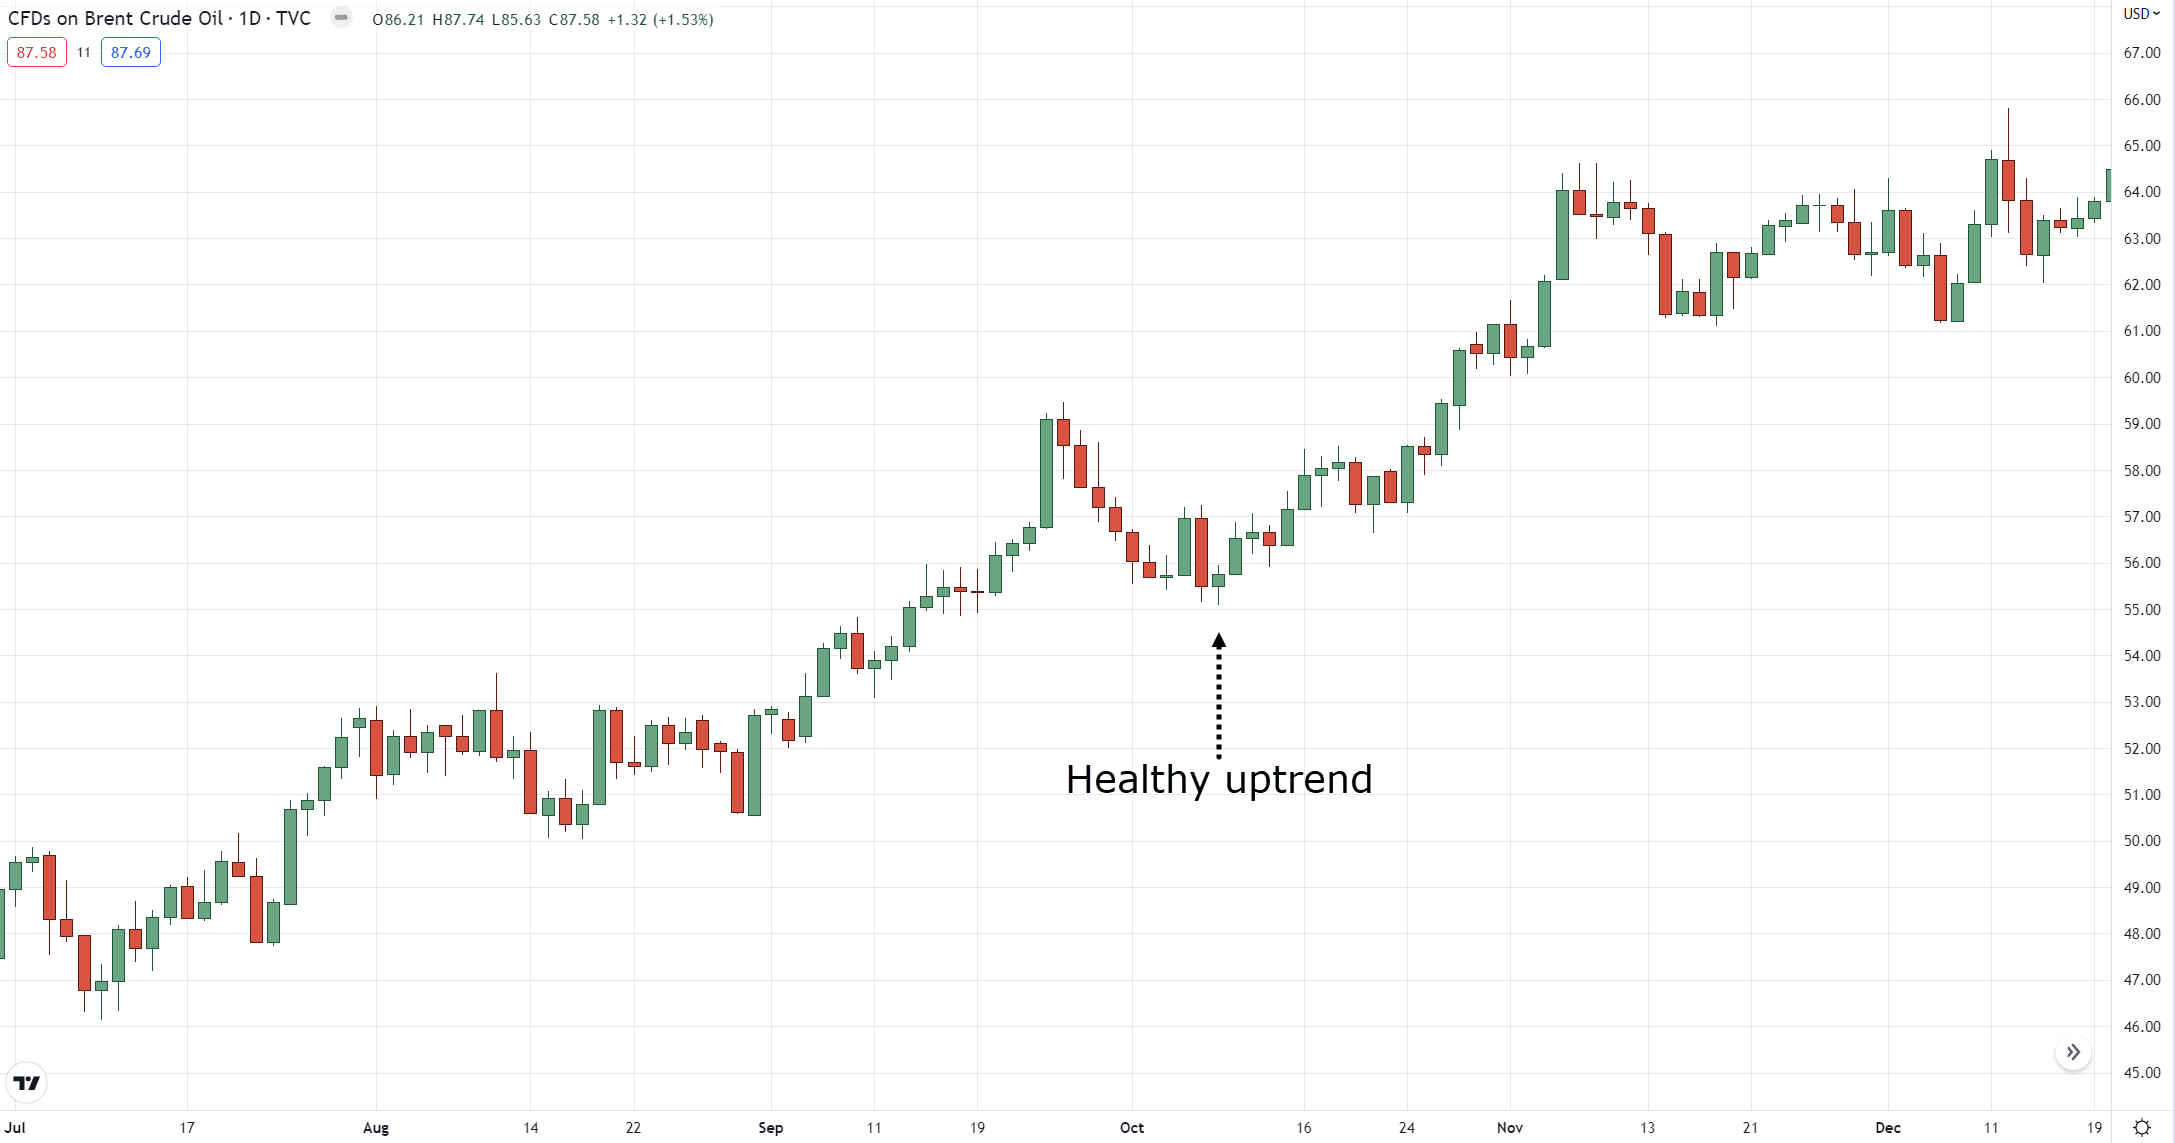
You might be wondering:
“Why is it called healthy?”
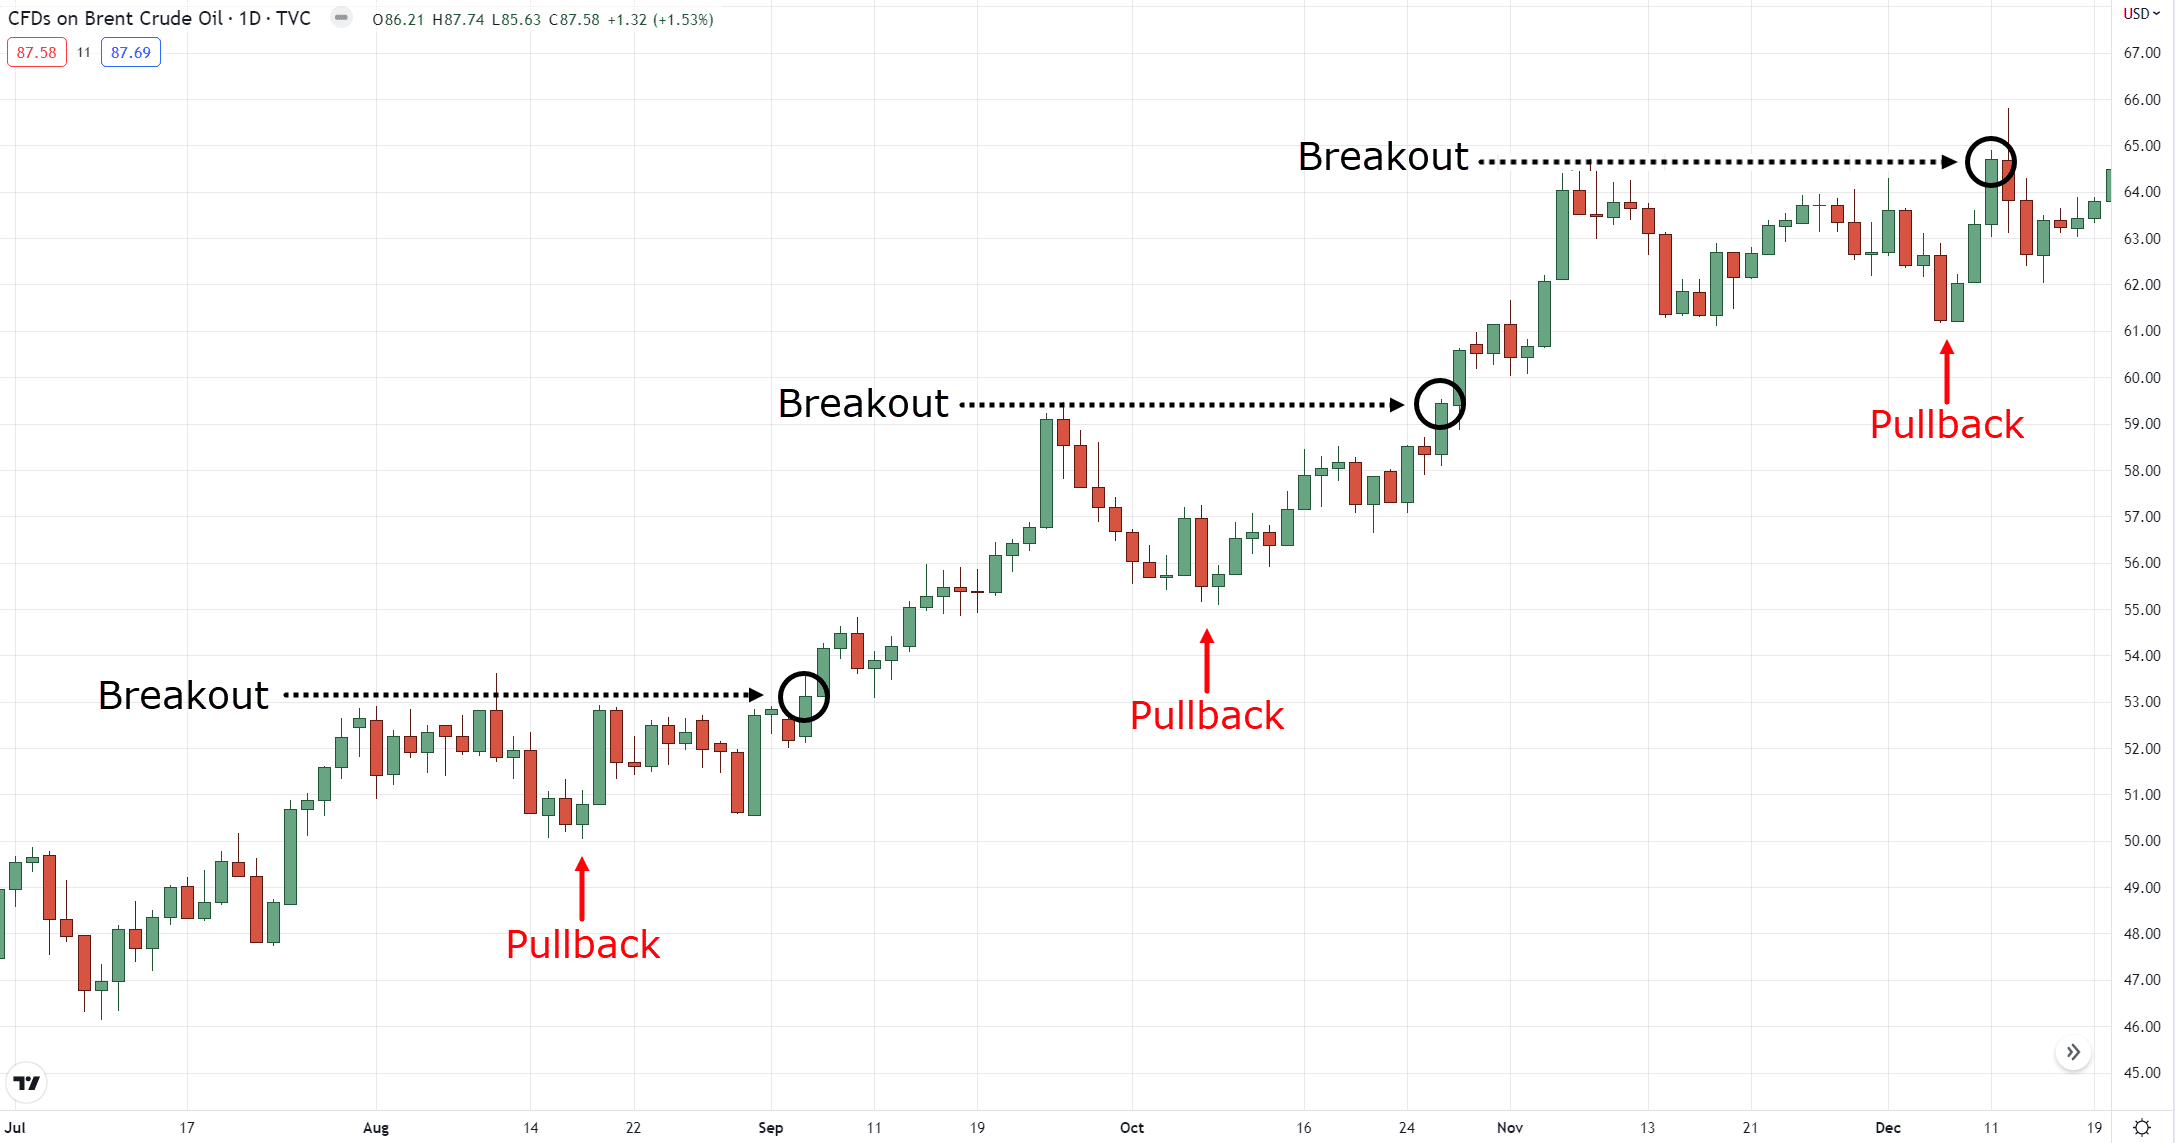
It’s because it has the right balance of breaking out and having pullbacks!
If the strong trend is like a sprinter then a healthy trend is like a jogger who takes it slow and steady.
Got it?
Weak trend
Well…
A weak trend is like a lost tourist trying to get to his destination.
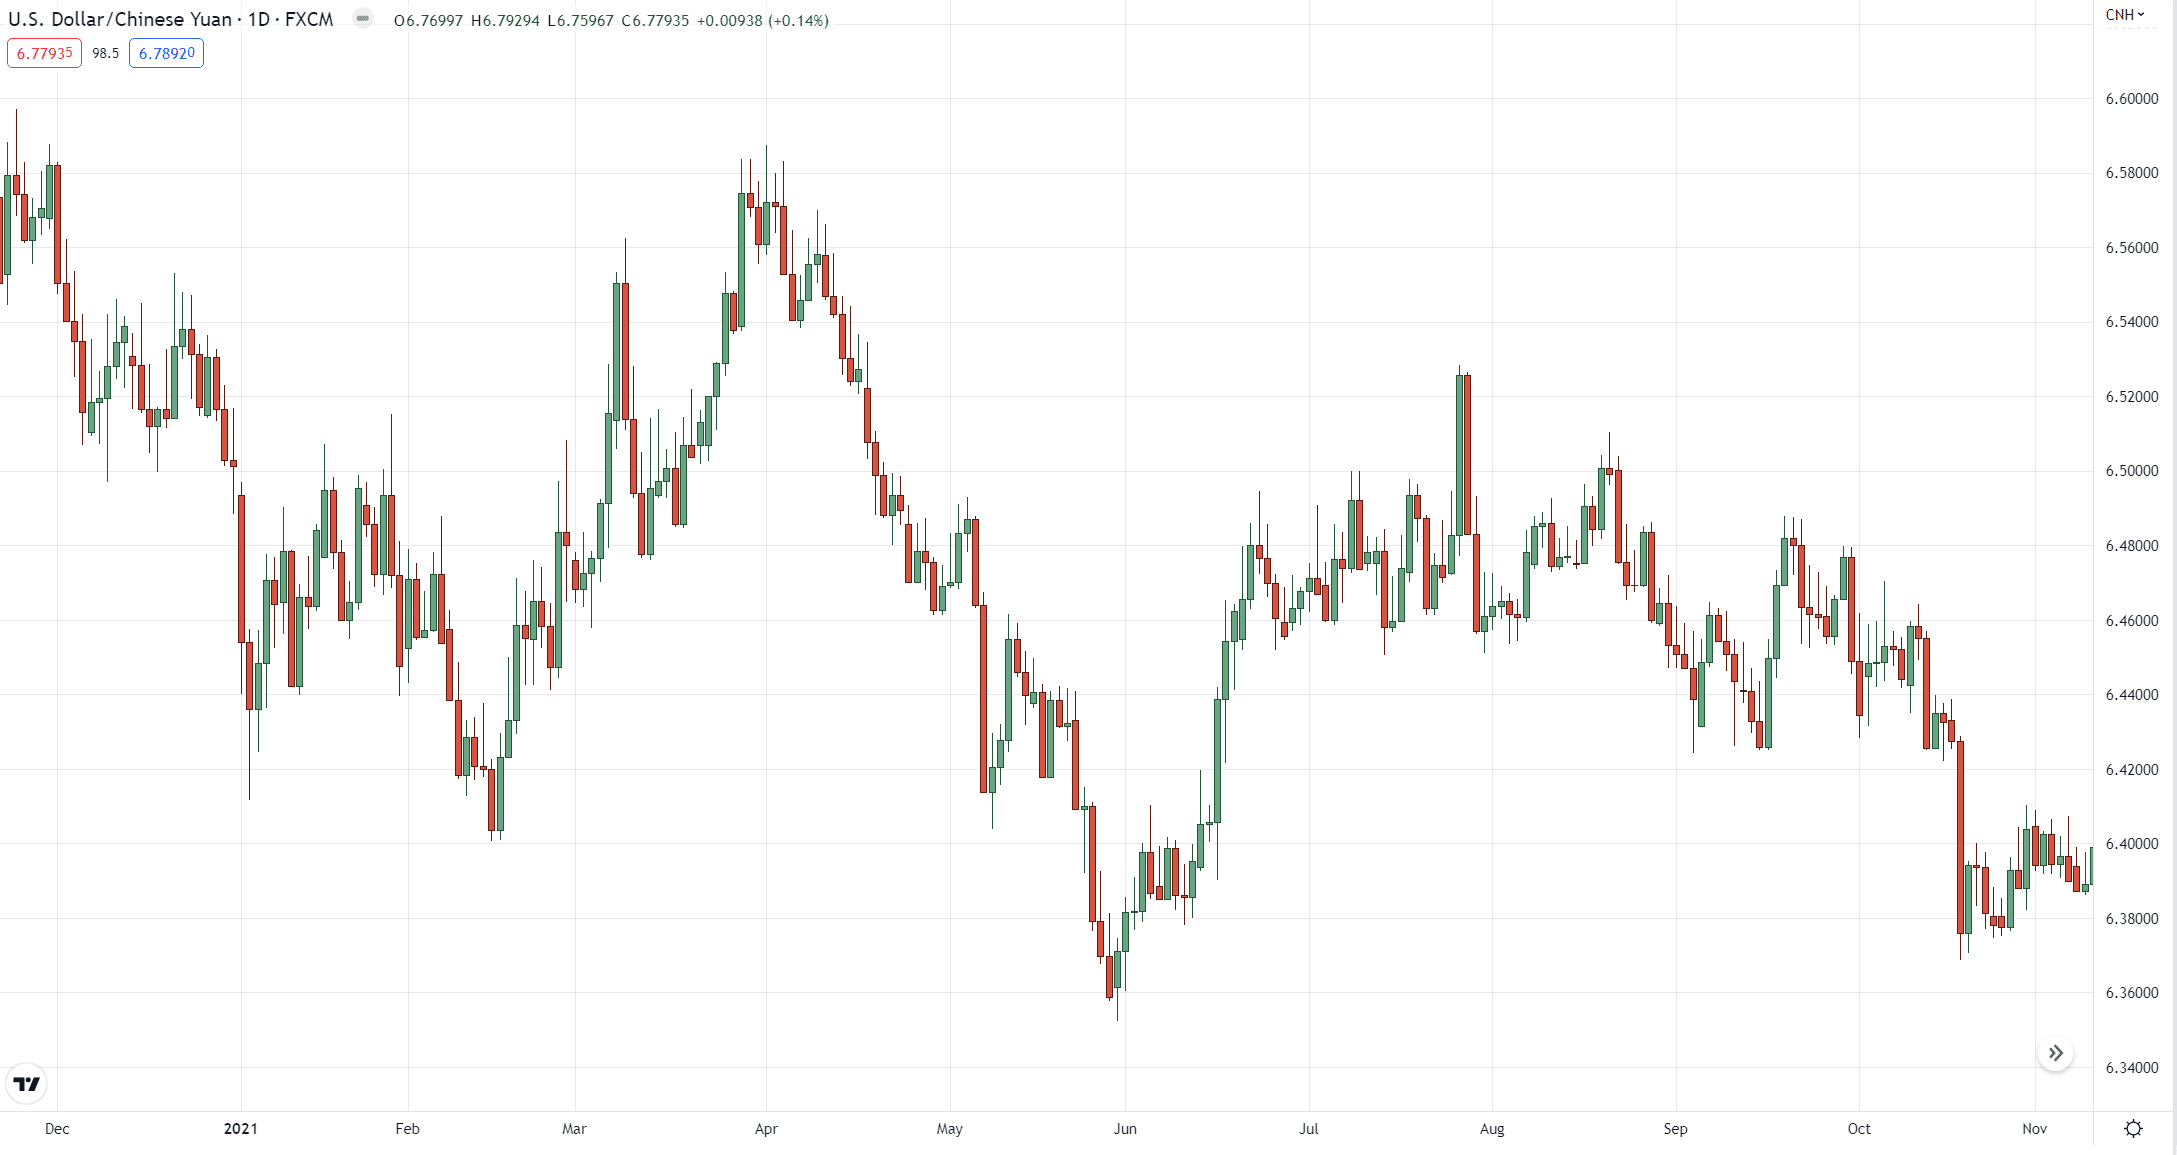
Sure, it’s still in a downtrend if you take a look at the big picture.
But as you can see, there are multiple trends and ranges within this trend!
 types of trend lines")
It’s like the lost tourist is taking time going into “side” destinations!
These markets are often the most challenging to trade.
Nonetheless, one major characteristic of a weak trend is that pullbacks are very long and breakouts don’t go too far.
Got it?
Now…
Since there are different types of trends, you’ll now know exactly how to trade them using different types of trend lines.
It’s what I promised you, remember?
So, what are the different types of trend lines you may ask?
They are:
- Straight trend line
- Curved trend line
- Reversal trend line
Let’s get to the meat of this masterclass guide on how you can exactly enter, manage, and exit your trades using these different types of trend lines…
Types of trend lines: Straight trend line
Straight trend lines are nothing new…
That’s for sure!
It’s what I’ve been showing you since a while ago!
But here’s what I haven’t answered yet:
When is a straight trend line valid?
A straight trend line is valid on the second swing high (or swing low):
 types of trend lines")
Wouldn’t make sense to plot random trend lines on different angles if you’ll just rely on one swing high or low, right?
And if you remember…
Always make sure to treat it as an area and not a single line!
 types of trend lines")
Easy enough, right?
So, recall…
Different types of trends require different types of trend lines.
With that said…
What market condition is a straight trend line’s biggest strength?
Healthy trends, of course!
 types of trend lines")
Given how healthy trends have a decent number of breakouts and pullbacks, it’s easier to plot and trade using a straight trend line.
But then again…
Not all markets have equal trends.
So, what would you do with a straight trend line when the market looks like this?
 types of trend lines")
You can’t just plot trend lines like this, right?
 types of trend lines")
It’s pretty much useless!
What’s the solution then?
Let me tell you…
Types of trend lines: Curved trend line
Remember the time when cryptocurrencies were all over the news?
It was the new fad in trading!
It’s even the reason why some people first get into trading!
However…
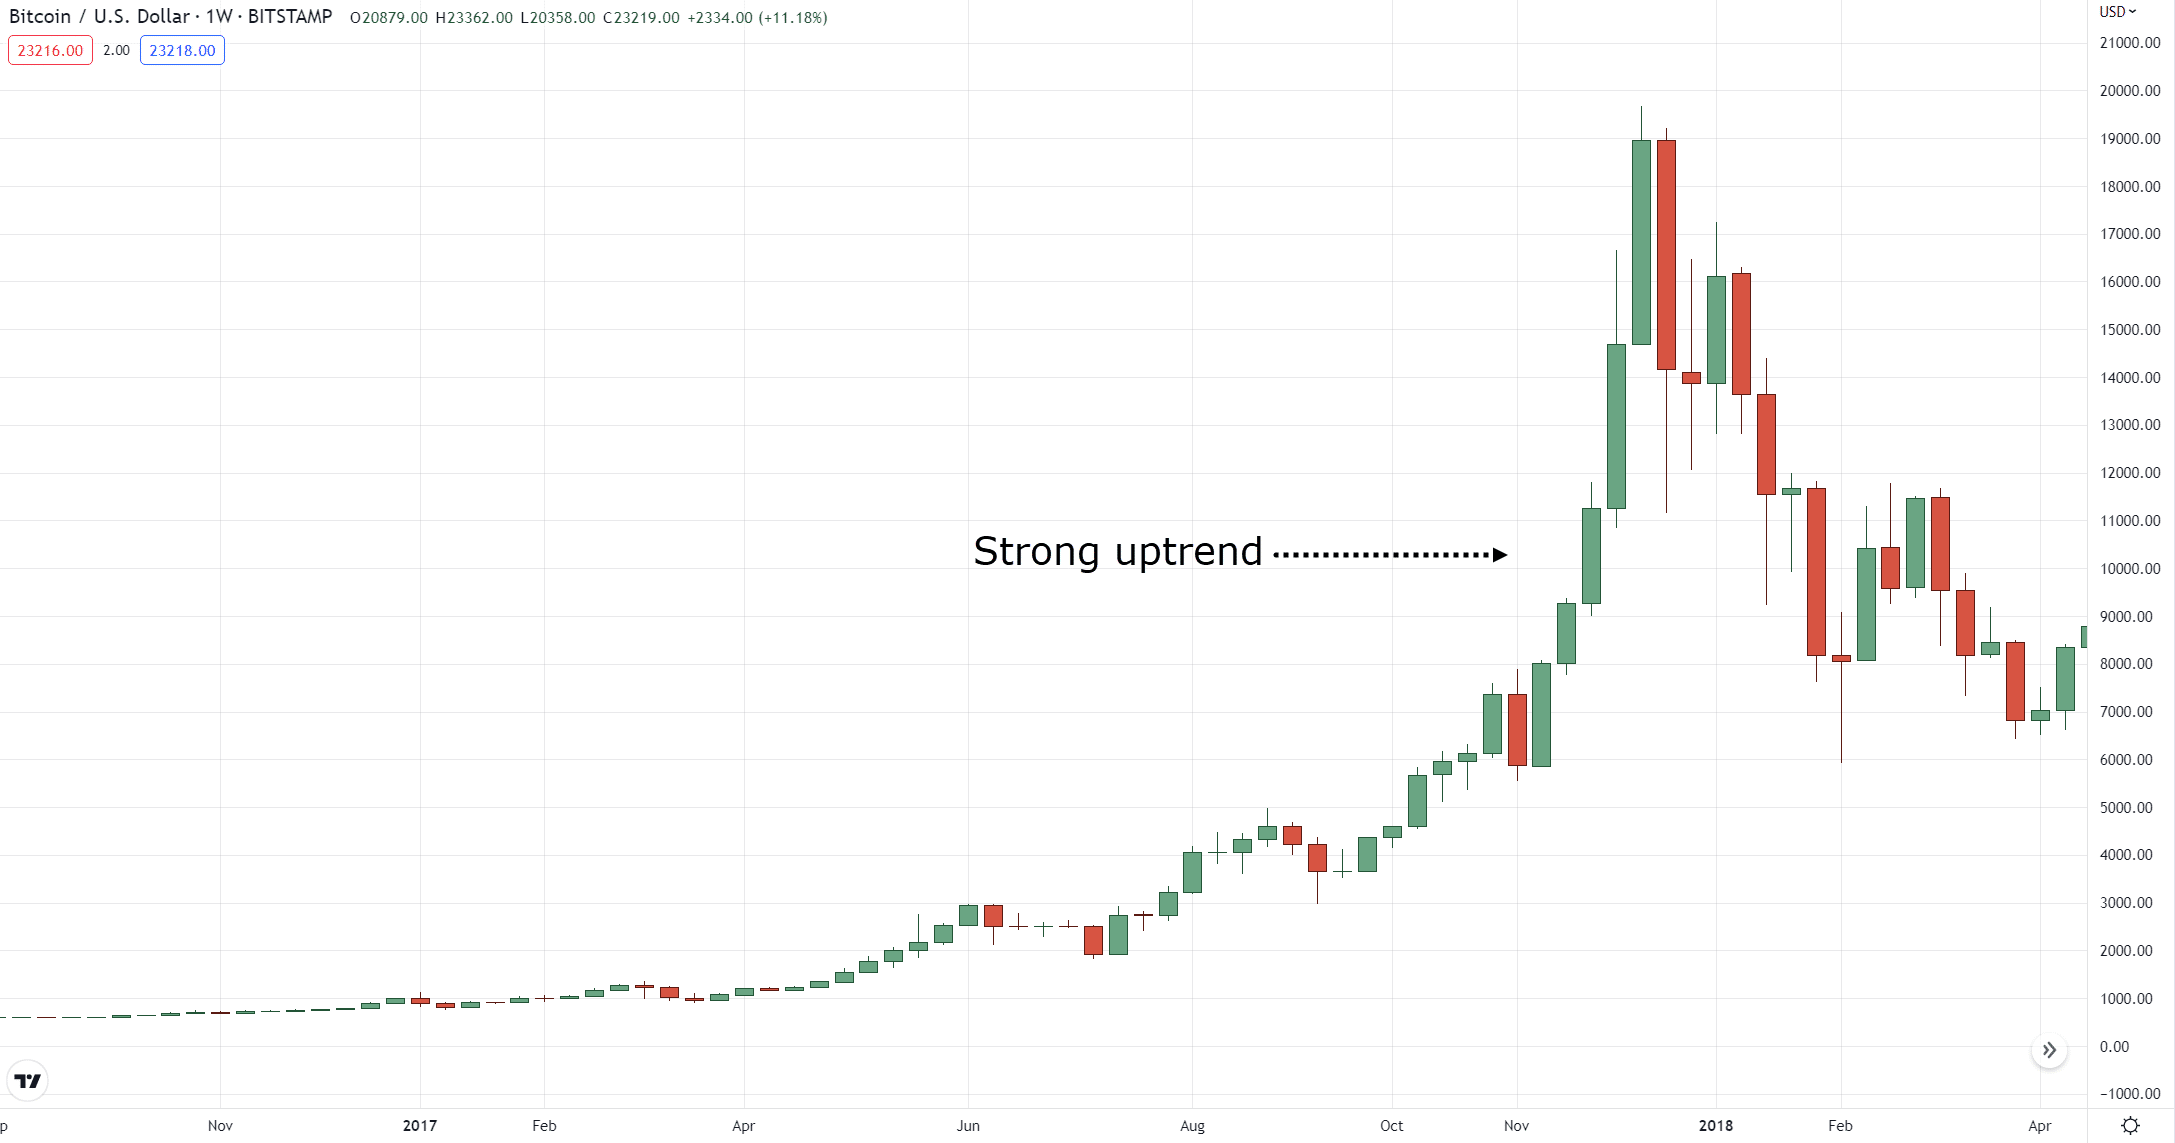
The moment some crypto such as Bitcoin started gaining news coverage, it was already at its peak:
 types of trend lines")
With a lot of people having the fear of missing out…
Most have bought to the top (and you know what happened next).
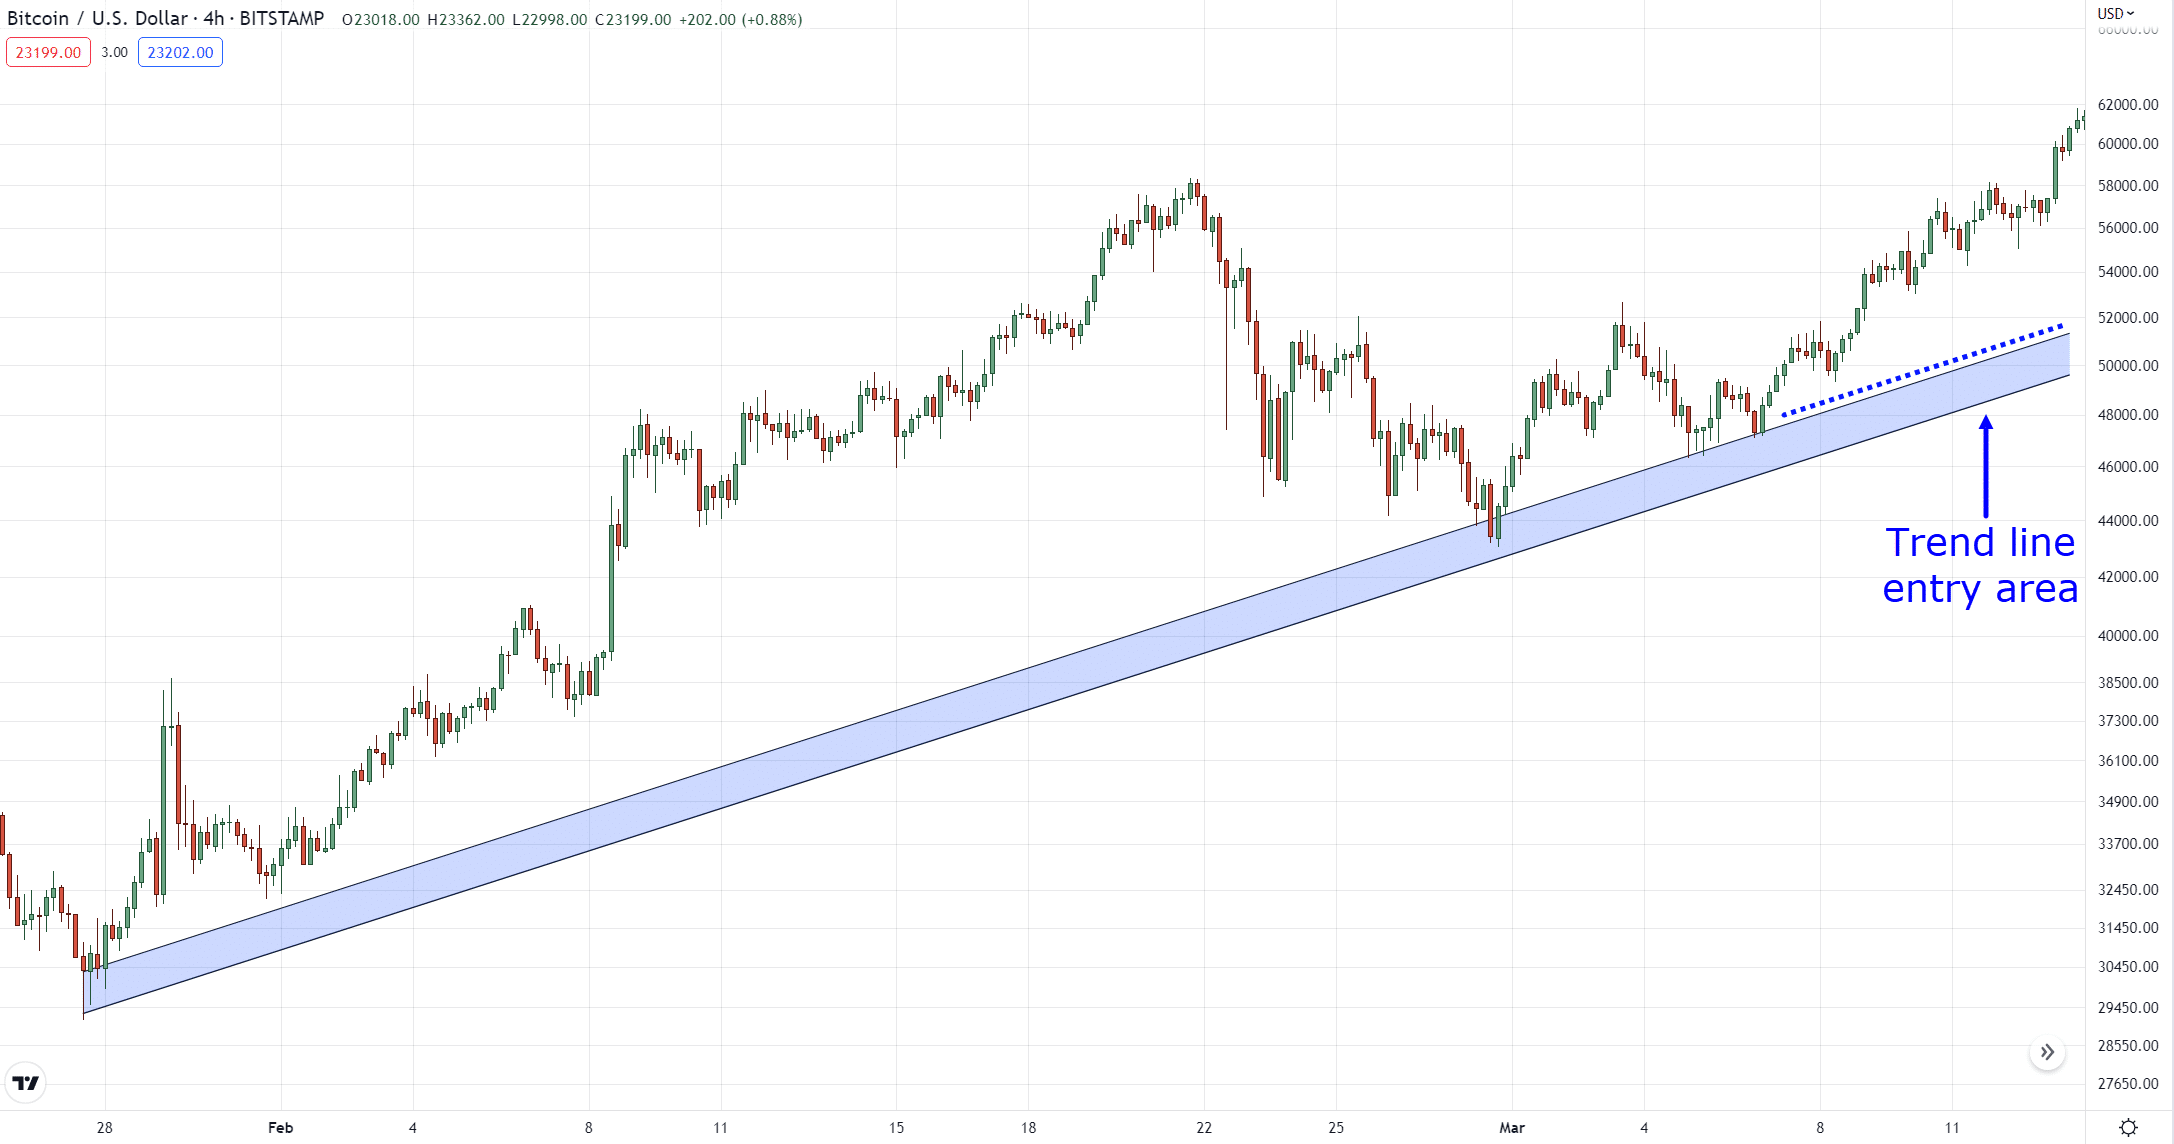
But with a curved trend line, you’ll be able to:
- Know the specific areas of value for you to enter a trade on
- Know when to hold as the trend goes parabolic and exit if it slopes more than 80 degrees
Let me show you…
 types of trend lines")
Amazing, right?
Having curved trend lines on a parabolic trend keeps you objective on when to take advantage of this massive trend!
This is why a curved trend line is a worthy technical tool to add to your arsenal.
Now…
When is a curved trend line valid?
This can be a bit tricky.
Why you may ask?
Well, we don’t know if it’s a parabolic trend in the making until it makes a second test of its swing low (since the market keeps on sloping):
 types of trend lines")
That is why a curved trend line is valid on the second breakout instead!
 types of trend lines")
In the later sections…
I’ll reveal to you when exactly to enter and exit your trades using the curved trend line.
But for now…
What market condition is a curved trend line’s biggest strength?
It’s pretty obvious.
Strong trends of course!
 types of trend lines")
The reason why I shared this with you is that strong trends are often the kind of market condition that plays with your emotions (greed and fear).
At the same time, it’s the kind of trend that keeps newbie traders lost.
They ask questions like:
“When can I enter this parabolic trend, should I enter now?”
“I’ve entered recently, when should I exit!”
Sounds familiar?
This is why a curved trend line is one of the tools that would help you objectively take advantage of these types of trends!
So, at this point…
It’s already etched in your mind that trend lines are meant to be used alongside trending markets.
But what I told you is that you can also use trend lines to time market reversals and to spot market reversals early!
Sounds too good to be true, right?
So, stick with me here, and let me show you how in the next section…
Types of trend lines: Reversal trend line
Out of all my years in trading…
I find reversal trend lines one of the most reliable ways to spot reversals in the markets.
It’s the same way how you plot straight trend lines.
However…
You use them the opposite way!
 types of trend lines")
Now I know you might be thinking…
“Wait, so if the price breaks a straight trend line, then should I already consider it a reversal trend line?
“What’s the difference between a straight trend line and a curved trend line?”
Those are some valid questions!
So, let me shed some light on this…
When is a curved trend line valid?
Before I share with you some charts, let me show you a schematic of when a curved trend line is valid:
 types of trend lines")
There are two components to this!
The usual straight trend line, and then the confirmation line (excuse my handwriting, hah):
 types of trend lines")
So, when the market makes a strong close below that confirmation line…
 types of trend lines")
The reversal trend line is valid!
Again, two things must happen…
- The price must break the straight trend line
 types of trend lines")
- The price must make a pullback and then breaks out
 types of trend lines")
In short:
A reversal trend line is a continuation once a straight or curved trend line fails!
Makes sense?
So, with that said…
What market condition is a reversal trend line’s biggest strength?
Reversal trend lines are often the right tool to look for trading opportunities in a weak trending market.
Because instead of waiting for the market to retest the trend line…
 types of trend lines")
Why not take advantage of its swing?
 types of trend lines")
Pretty cool, right?
Nonetheless…
The main reason why I shared with you the reversal trend line is so that you’ll continue to see opportunities even when trends fail.
Sounds good?
So…
Let’s put everything altogether and show you:
- When should enter
- How should you manage
- When should you exit
Using the different types of trend lines.
Excited?
Then keep reading!
How to profit from the different types of trend lines
Let me ask you…
Why do you have to first define the different types of trends out there?
Well, to know what different types of trend lines we should use!
And why do you have to define the different types of trend lines out there?
That’s right.
To know what type of setup and trade management we should use!
It’s all connected!
So let’s get right into it…
Straight trend line
Using straight trend lines on a healthy trend is such a wonderful time to look for pullback setups.
What’s a pullback you may ask?
Here’s what it looks like:
 types of trend lines")
So, the moment your straight trend line is valid (which is after a second test of the swing low):
 types of trend lines")
You’d wait for price to retest the third swing low!
Simple, right?
Okay, so what do you do when it retests the swing low?
What do you want to see before you enter the trade?
Now listen closely.
First…
You’d want to wait for the price to close within or beyond the trend line:
 types of trend lines")
Then, once it closes back within the range with a strong candle:
 types of trend lines")
You place a market order at the next candle open:
 types of trend lines")
Now you may want to come back to this training guide to nail this down!
So, how about the exits?
In this case…
We would use a trailing stop loss which is the trend line itself.
This means that you’d only want to close the trade when the price makes closes two candles below the trend line area of support.
 types of trend lines")
A simple setup, right?
Next…
Curved trend line
On the previous trend line, we used a pullback setup to enter.
But for strong trends, decent pullbacks rarely happen.
Why?
Because strong trends often slope higher, remember?
 types of trend lines")
So, what’s the solution?
A breakout setup!
Once your curved trend line is valid on the second breakout:
 types of trend lines")
You simply enter on the next candle open!
 types of trend lines")
Much simpler than the last one, right?
The exits are similar as well, which is to reference your trend line as a trailing stop loss!
 types of trend lines")
Sure, you may not catch the top, and we really didn’t make much profit in this trade.
But in the end, you’ll never really know when the “top” really is, right?
At the same time, not all trades will be big winners.
Finally, the last one…
Reversal trend line
As I’ve mentioned…
This type of trend line is one of my favorites as it gives you the “front seat” of a new potential trend.
The potential reward is huge!
 types of trend lines")
But of course, this is not the holy grail.
Instances such as a trend reversal failing are always possible (such as with any of the setups I showed you so far).
 types of trend lines")
Nonetheless!
How you enter is similar to the curved trend line, with a breakout!
 types of trend lines")
The only difference is this time…
We’d need the assistance of a medium-term moving average as a trailing stop such as the 50-period moving average!
This means that you’d only exit the trade if the price closes beyond the 50 MA:
 types of trend lines")
There you go!
Now, it doesn’t matter whether you choose a 40-period, 46-period, or 56-period moving average.
So, don’t waste too much time knowing what the “best” is as there isn’t any!
As long as it’s a “medium-term” moving average period then that’ll do.
Got it?
With that said…
Let me tell you something that you must know.
Disclaimer
In today’s guide, I have shared with you multiple cherry-picked charts to illustrate a concept.
However…
It’s crucial to know that there will be times when the market will invalidate your setups (as with any other strategies out there).
Nonetheless, here are some sources that I know will help you when trading with the different types of trend lines…
The Complete Guide to ATR Indicator
The Complete Guide to Breakout Trading
How to Use Trend Lines: The Complete Guide to Trend Line Trading
The Moving Average Indicator Trading Strategy Guide
With that said, let’s do a quick recap of what you’ve learned today…
Conclusion
In the end…
It’s not about knowing which type of trend lines is best.
But to know exactly when to use each one of them whenever different types of trends arise!
Today, you’ve learned that…
- A trend line must be treated as an area and not as a single line on the chart despite it being called a trend “line”
- There are trends such as a strong, healthy, and weak trend
- There are trend lines such as the straight trend line for healthy trends, the curved trend line for strong trends, and then the reversal trend line for weak trends
- You can trade the different types of trend lines by using pullbacks and breakouts as entry triggers and reference the trend lines as a trailing stop exit trigger
Over to you…
Have you been using the trend line for a long time?
What tips can you give?
Perhaps you haven’t dabbled into the trend line too much.
If so, how do you think this training guide will help you improve your current strategy?
Let me know in the comments below!
Have been using the trendlines for about a year and one tip I would give is patience is a key wait for the market to come to you
Awesome, thank you for the great insight, Jeremiah!
Please how do I set up the curve trend line on my charts
Hey there, hope
The curved trend line as of the moment can be accessed anytime on TradingView!
Awesome! I found this guide very helpful, thank you so much!
You’re welcome, Abdullahi!
This has actually reshaped my thinking about trend lines. And I clearly see that I need to take advantage of whatever trendline and not just looking for the best or certain trend lines alone. In addition, I got to realize what the concept of setup is all about in trading. Thank you Sir Rayner!
Great to here that, you’re welcome!!
Glad to hear that it helped you, Crowned Prince!
Eye opener artical. Fantastic
Great to hear that, Shrikant!
Thank you for giving us soooo much important knowledge. GBU
You are most welcome, Deepu!
Thank you very , I have learnt a lot of things that were causing me to loose trades .
Great to hear that you have learned a ton, Linus!
Ur lessons is always very valuable to me .. n I’m yr student infact ..
But I still hv problems understanding stop lost n limit
Order .
Tends did not do it right ..
Suffered few unnecessary losses and shorten some winnings when it was meant to hold longer ,cos I didn’t got it right, so get filled !
Hope a lessons on good illustrations supported, like yr usual teachings n sharing ..very educational indeed
Thku n appreciates !
Christy
Hey there Seah,
I believe I also have another article regarding stop loss orders, but let me know how I can help!
Also, I’m glad you’ve found some benefit on this guide!