Imagine:
You’re waiting for a pullback towards support before you get long.
Somehow, the market knows what you’re trying to do and it doesn’t re-test the level you’re looking at.
Instead, the market continues to move higher without you—argh!
Sounds familiar?
Then you’re not alone.
The good news is, there’s a fix for it if you know what to look for in a pullback trade.
So read on to discover how to do pullback in trading right…
#1: Trade in the direction of the trend
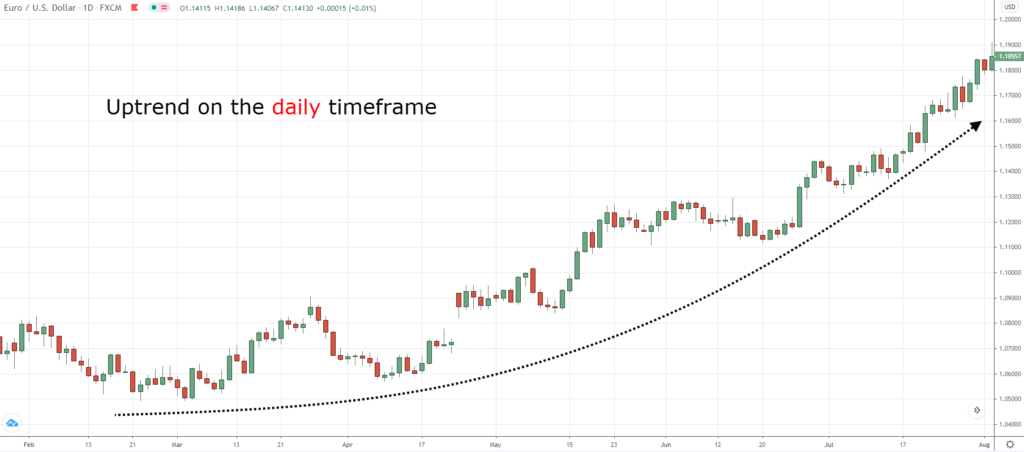
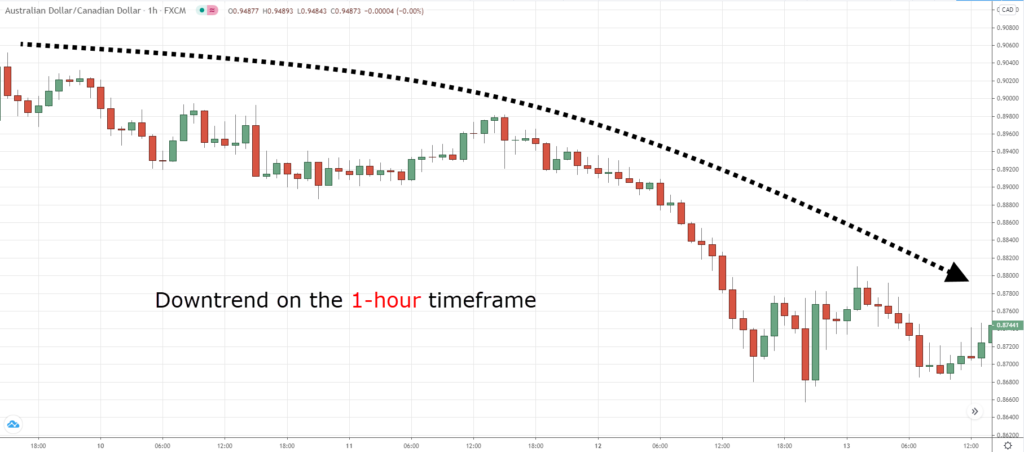
The first step to pullback trading is to identify a trend (that’s relevant to your timeframe), and then trade in the direction of it.
For example, if you’re trading the daily timeframe, then you must have a trend on the daily timeframe.
Here’s what I mean:
Or if you’re trading on the 1-hour timeframe, then you must have a trend on the hourly timeframe
An example:
Remember:
For pullback trading to work, the market must be trending (which means you can ignore range market condition).
#2: Classify the type of trend
Here’s the deal:
Not all trends are created equal.
Some have shallow pullbacks whereas some have deep pullbacks.
So here are the 3 types of trends every trader must know:
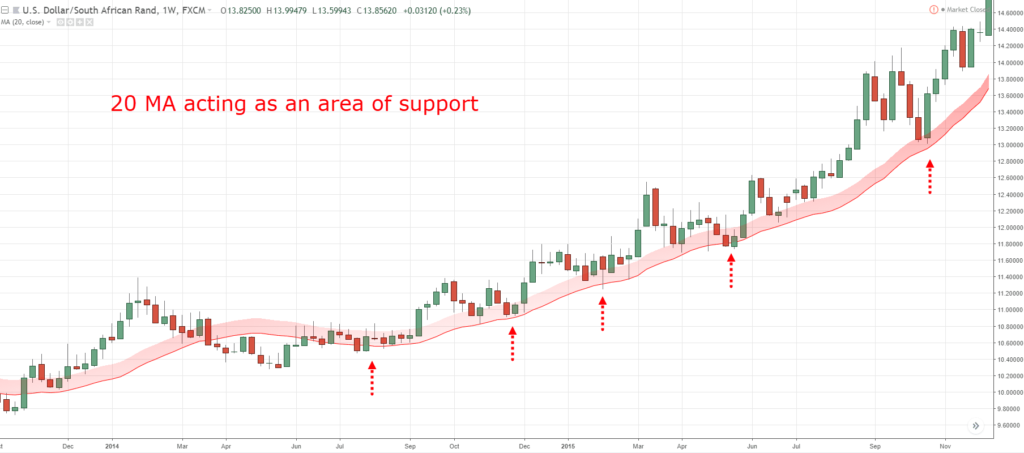
- Strong trend: The price respects the 20MA and remains above it
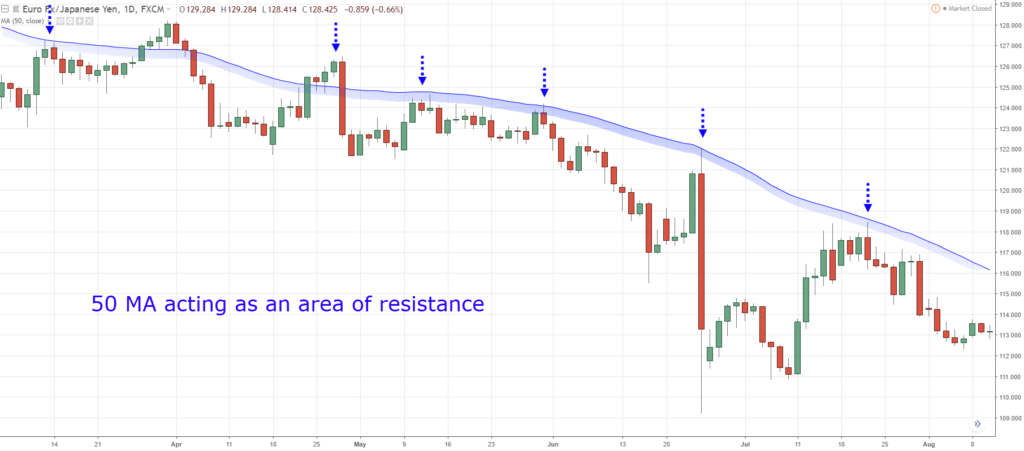
- Healthy trend: The price respects the 50MA and remains above it
- Weak trend: The price respects the 200MA and remains above it
You’re probably wondering:
“What’s the purpose of knowing the different types of trends?”
That’s because it helps you to identify the area of value on the charts, so you know where exactly to enter your pullback trade.
I’ll explain more in the next section, read on…
#3: Identify your area of value
In an uptrend, the area of value refers to the location on your chart where buying pressure could step in and push the price higher.
So let’s dive in…
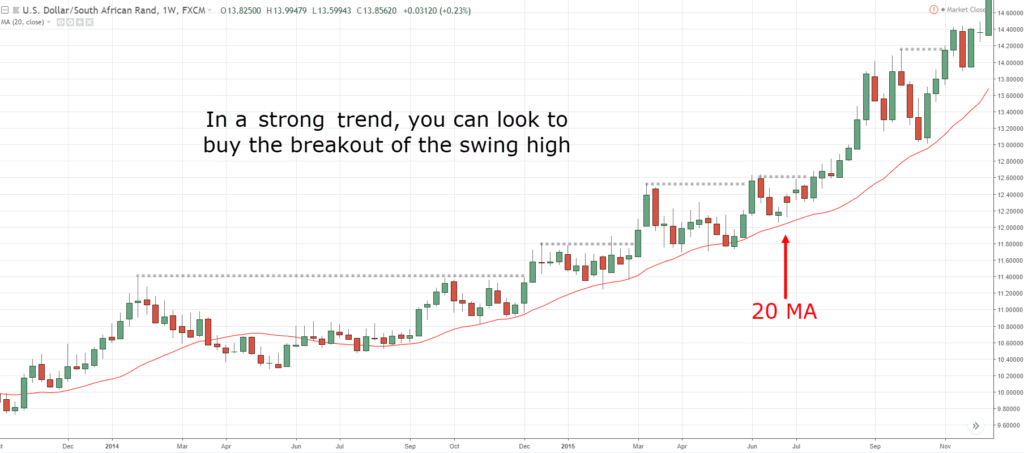
In a strong uptrend, the area of value is at the 20MA.
Here’s an example…
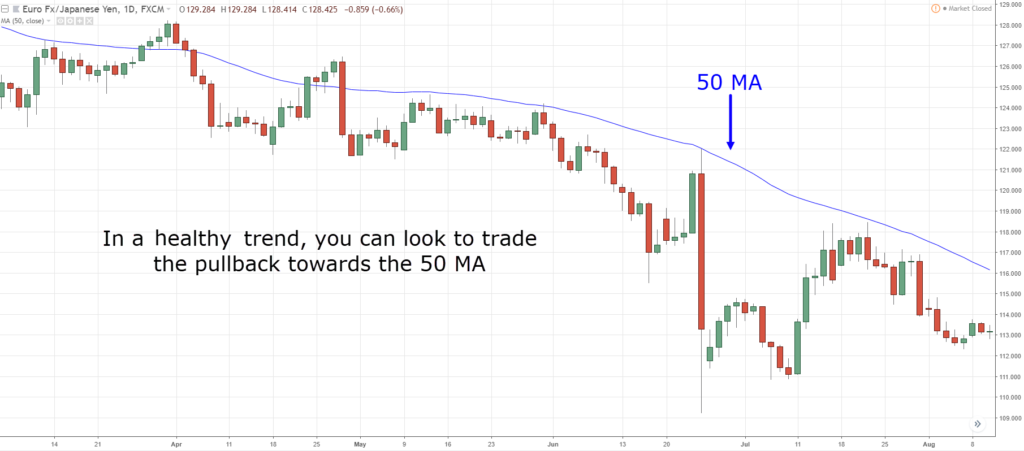
In a healthy trend, the area of value can be at the 50MA (or at previous resistance turned support).
An example…
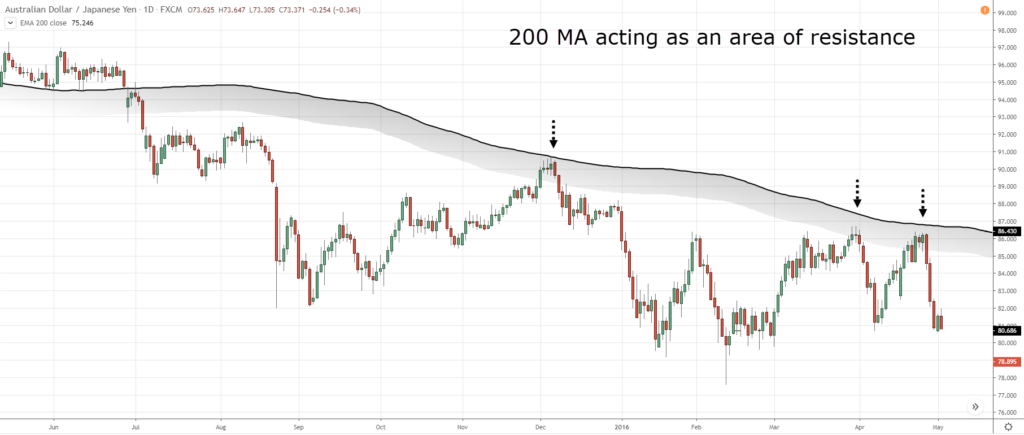
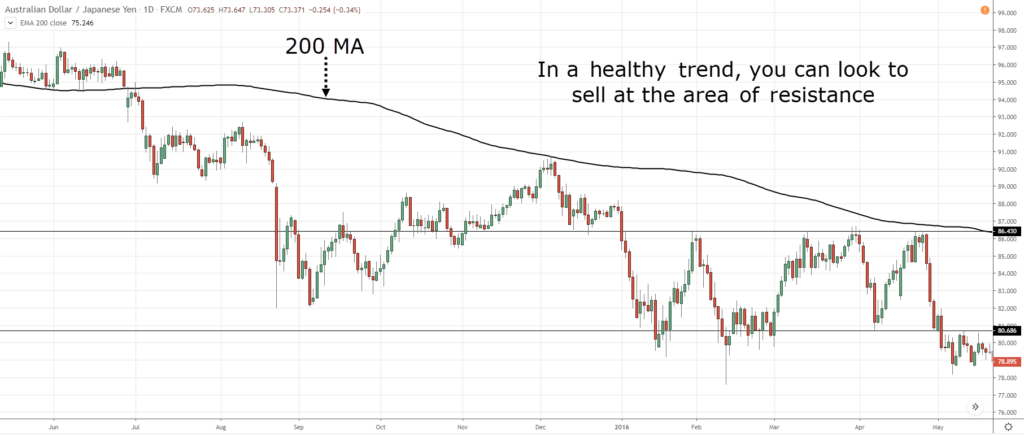
Finally, in a weak trend, the area of value is at the 200MA (or at support).
Here’s what I mean…
Pro Tip:
We’re dealing with an area on your chart, not a specific price level.
So, be prepared that the market could exceed your area of value before reversing higher.
Now, what is pullback in trading if you do not have the next two things…
#4: Entry trigger to time your pullback trade
An entry trigger is a “pattern” that gets you into a trade after all your conditions are met.
(In this case, our conditions are 1) trading in the direction of the trend 2) classifying the type of trend 3) identifying the area of value.)
There’s no need to complicate things here because an entry trigger could be as simple as buying on a pullback, or on a breakout.
I’ll explain how trends and pullback in trading work together…
Strong trend
As you know, a strong trending market has a shallow pullback and remains above the 20MA (for an uptrend).
This means buying on a pullback can be difficult because the pullback is usually short-lived before the trend resumes higher.
So, an easier approach to buy a breakout of the swing high.
Here’s example…
Healthy trend
In a healthy trend, the pullback is healthy and it could re-test the 50MA or previous resistance turned support—so these are areas to look for buying opportunities.
Next, you can look for a bullish reversal candlestick pattern (like Hammer, Bullish Engulfing Pattern, etc.) as an entry trigger to get long.
Here’s an example…
Pro Tip:
You can also buy a breakout in a healthy trend, but your stop loss is wider as it needs to go below the 50MA or, the previous swing low. More on this later…
Weak trend
In a weak trend, the pullback is deep and it could re-test the 200MA or, support area.
Next, you can look for a bullish reversal candlestick pattern (like Hammer, Bullish Engulfing Pattern, etc.) as an entry trigger to get long.
Here’s an example…
Onward…
#5: Exits to protect your account and maximize your profits
Now, there are 2 types of exits to consider:
- Exit when you’re wrong
- Exit when you’re right
Let me explain…
Exit when you’re wrong
After you enter a trade, there’s a possibility the market could move against you.
So, at which point on the chart will you get out of the losing trade (otherwise known as your stop loss)?
Well, you want to exit the trade when your trading setup is invalidated.
For example:
In a strong trending market, the area of value is around the 20MA.
So, if the price breaks below the 20MA, then the area of value is breached and you should get out of the trade.
Here’s what I mean…
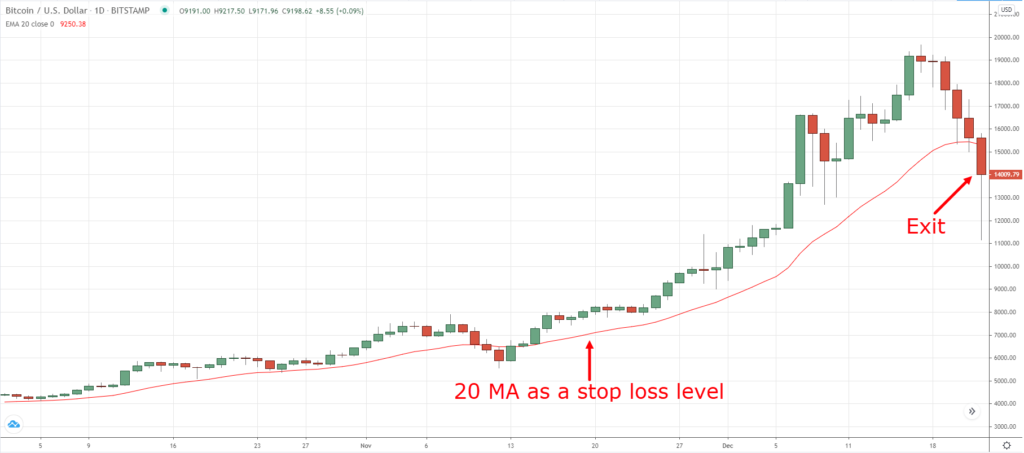
Here’s another one…
In a healthy trend, the area of value could be at previous resistance turned support.
This means if the price breaks below support, then the area of value is breached and it’s time to get out of the trade.
Here’s what I mean…
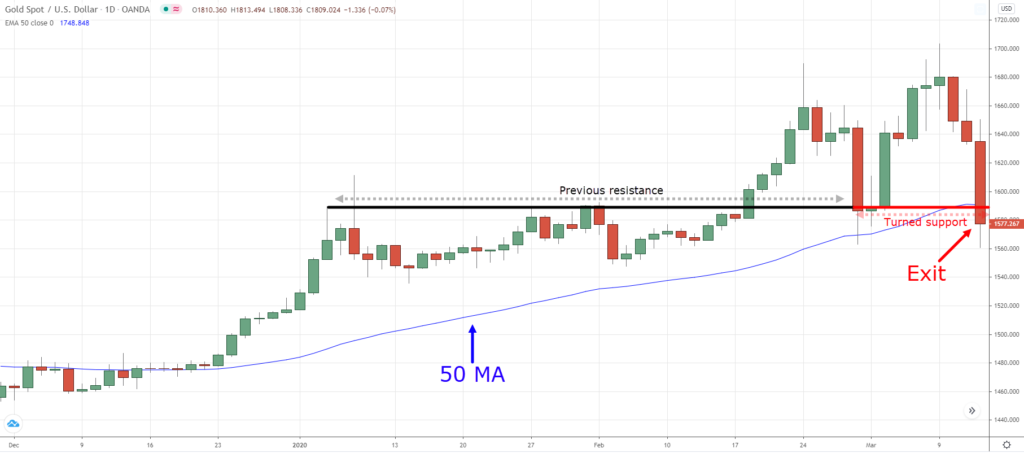
Next…
Exit when you’re right
Now what if the market moves in your favour, how will you exit your winner?
Here are a few general guidelines:
Strong trend: In this market condition, it’s ideal to ride the trend because the pullbacks are shallow which makes it easy to hold onto your winner.
You can trail your stop loss using the 20MA and exit the trade only when the price closes below it.
Healthy trend: In this market condition, you can capture a swing by exiting your trade before the swing high.
Or else, you can ride the trend using the 50MA, but bear in mind the pullbacks are deeper which requires you to withstand more “pain”.
Weak trend: In this market condition, you want to avoid riding a trend because the pullbacks are deeper and will likely stop you out of your trade.
Instead, look to capture a swing at resistance or the previous swing high.
If you want to learn more about swing trading and riding trends, then check these out…
The NO BS Guide to Swing Trading
5 Powerful Trading Stop Loss Techniques That Work
Bonus #1: How to identify high probability pullback trades (for stocks)
When it comes to stock trading, it’s possible to have hundreds of stocks forming a pullback trading setup at the same time.
So the question is:
How do you know which stocks to buy and which to avoid?
Well, the secret is to focus on stocks which have increased the most in price over the last 12 months.
Why?
Because these are stocks likely to outperform the market (and it’s been proven in theory as well according to the paper Returns to Buying Winners and Selling Losers by Jegadeesh and Titman).
So, how do you apply this to your pullback strategy for trading?
- Rank stocks according to their rate of change (ROC) over the last 50-weeks—from the highest to the lowest
- Look for a pullback trading setup on stocks with the highest ROC value. If there isn’t, then move to the next stock (with a lower ROC value)
- The top 5 stocks with a valid pullback trading setup are the ones to focus on
Pro Tip:
You can use a platform like Thinkorswim to help you rank the stocks, and it’s free.
Bonus #2: Multiple plans of attack
Most of the time, the market will not behave the way we want it to be.
For example:
You’re waiting for the price to test support before you look for an entry trigger to go long.
But somehow, the market knows what you’re trying to do. So, it doesn’t test support and continues to move higher, without you.
Sounds familiar?
That’s why as a professional trader, you must have multiple plans of attack—a single pullback strategy is not enough to conquer all markets.
So, even if the market doesn’t behave in the manner you’d like it to, you’ll still have other setups to capture opportunities in the market.
Here’s an example…
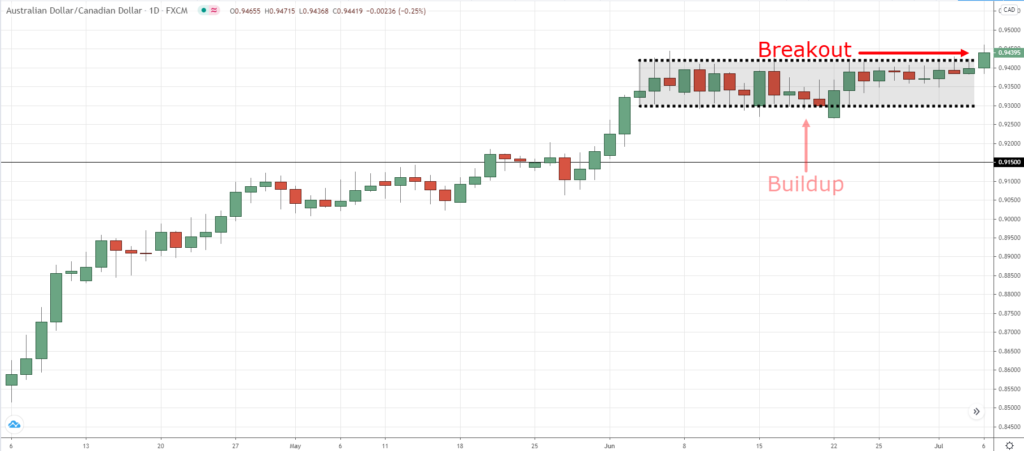
In the chart below, AUD/CAD has broken out of resistance. So, one possible setup is to wait for the price to re-test previous resistance that could act as support, around the 0.9150 area.
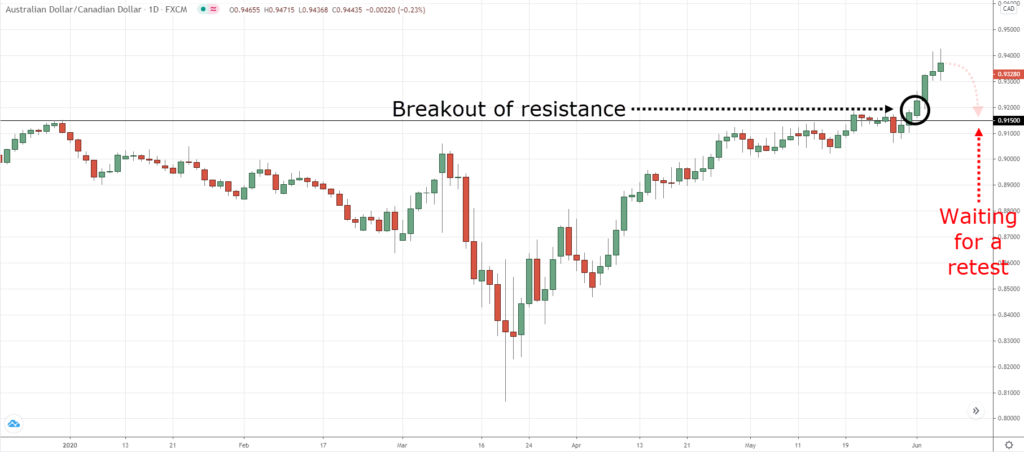
However, the market knows what you’re thinking and the price doesn’t re-test support. Instead, it consolidates and forms a buildup.
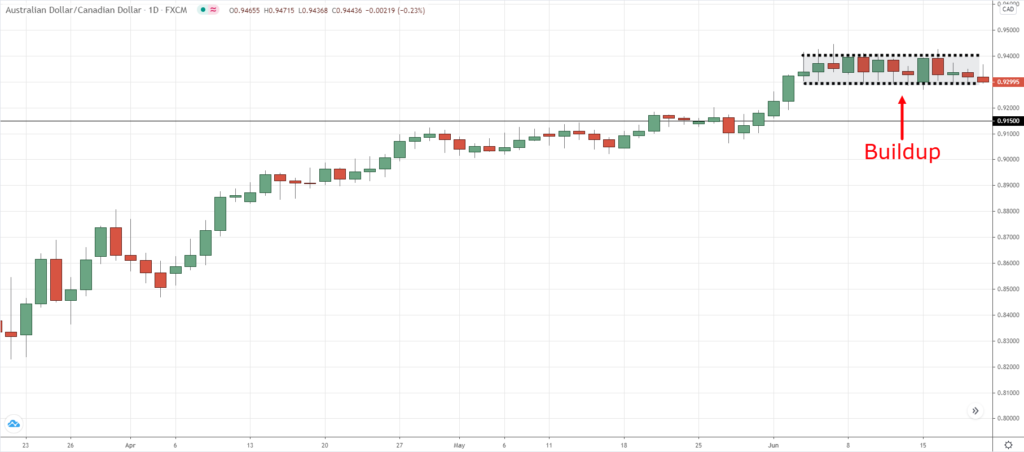
If you’re a one-trick pony with only one pullback trading strategy, then you’ll remain on the sidelines as the market breaks out higher.
But, if you have multiple plans of attack, then you could also look to buy the breakout of the buildup.
Here’s what I mean:
Make sense?
Conclusion
So here are the things to look for in your pullback trading strategy:
- Trade pullbacks in the direction of the trend (not against it)
- Classify the type of trend: strong, healthy, or weak
- Identify the area of value for the respective type of trend
- Look for a valid entry trigger to get you into a trade
- Know when to exit when you’re right or wrong
Now over to you…
What do you look for in a pullback trade?
Leave a comment below and share your thoughts with me.


Very very educative forex trading content. I quite got some of my unanswered questions of old well attended to. Well done. Please, keep it up.
Hi Adewale,
Thank you!
Cheers.
The way I see a pullback is for example market is trending downward two consecutive green candle are form below 20 sma than a red candle close lower than previous green candle that is my idea of a pullback.
Thanks for sharing, Bill!
Hi,
I need help on day trading stocks. My indicators are very good, but my entries seems to be not consistent mainly due to little experience in trading I easily get confused in what works and what not. Do you have any risk management material for day trading, if you do I really love to learn it from you
Sure, check this out… https://www.tradingwithrayner.com/forex-risk-management/
@rayner teo. While trying to identify trend using MAs , how back in time you would recommend to look? Last 20 candles, 50 candles, more?
Hi Annk,
50-80 candles on a higher timeframe would be good. And being able to spot your higher highs and higher lows in an uptrend,
same for a downtrend.
Cheers.
Sir , plz explain on candle pressure reading . we’ll be very happy
That’s amazing facts! Kudos
Hi Ahmeng,
Thank you!
Dear sir you doing great job far us but after many time shear you on facebook your book not downloalod what i can do.
Hi Anuj,
Kindly write to support.
Cheers.
im buying pullback by looking volume(low on pullback),RCP,MA(50MA rising),horizontal support.
Hi Rayner. I’ve purchased the book and my money got deducted and i did not received any emails. Can you please check on that. Thank you
Hey Ravi, could you please reach out to support@tradingwithrayner.com and we’ll assist you right away.
Hello Rayner, I woke up for trading 2 months ago, I’m still learning and testing with small live values to build a strategy to become profitable in the future. I started to learn seriously once I found your videos and blog, I have to congratulate you because you really stand up from the croud and make a diference to starting would-be traders like myself.
I wanted to ask you what you think of this idea that I’ve been working on: (excuse me for the lack of technical language, I still have much to learn)
I noticed that crypto-currency trading could be very interesting because of extreme volatility. I’ve been testing on ETH-USD on kraken which has high volatility and liquidity, which suits my specific idea of a plan, even for when the account gets to be a 6 figure account. (hence the necessary liquidity)
My idea is trading pull-backs and swings, which became very, very predictable once I started to aplly your price action trading strategies.
I’m looking for the edge on the market, not in the large of number of trades with more win percentage in each, but instead, in the high probability of trading success with very low margins and very low trading numbers.
I explain:
The idea is based on high volatility (2 to 3%, or more) big number of pullbacks and swings (even in a range market) in the 30m and 5m charts during the course of one day and the high predictability of those.
I already know, due to live testing, that if I try to score 2 or 3% gains of the many (high predictable) possible set ups I find, I will lose more than half of them at least, and my idea doesnt work.
But… I found out that, (and this is the all important thing) if I reduce my aimed gain to 0,9% (even cutting possible higher gains on each trade, to not let the price go against me while I try bigger profit) and only do 1 (one) trade per day (So I can make sure I do it on the most predictable set up) I can have almost 100% success on those tiny percentage trades
0.9% may seem a low value for non experienced people, and with the transaction fees the liquid gain starts only at 0.44% (increases as my monthly trading volume reduces the fees, because I keep cutting the trades at 0.9% to increase probability of success)
But I’ve done the math and if I can do that one trade per day with only that small margin with more than 90% success (and keep reinvesting 100% of the gains, at least for the first months) I can increase the account from 16 to 21 % consistently every month!!!
For an experienced trader like you, it’s easy to recognize that those percentages are HUGE if made consistently month after month for 3 or 4 years right?
Now, everyone (non trading people that I know basically) I try to explain this idea tells me it cant be done. But I’ve been testing this, and making many mistakes because I’m entering trades many times in the day with live small ammounts, but I ‘know’ that if I have the self discipline to only make one in the day (the most obvious one) I can get it right almost 100%
What do you think of this? Is this total newby rubish or could eventually be something if I dig deeper into it?
(Mind that I believe this whole idea is only possible with crypto currencies due to the consistent extreme volatily of those, and not possible on more traditional markets like stocks or forex, or commodities, with less volatility) But then again, I’m just a newby 🙂
Rayner you are good, that’s the truth, very useful.
Thank you, Olashupo!
Am a trend pullback trader, this content is dope.
Thank you