Let me ask you…
Have you ever looked at a chart and noticed the Stochastic indicator (aka Stochastic oscillator) is overbought.
So, you immediately go short because you think the market is about to reverse.
And here’s what happened next…
The market stalls.
Pause for a while.
…and then it blasts off higher!
Clearly, you got stopped out of your trade and you wonder to yourself…
“Wtf just happened?”
Well, you’re not alone.
That’s why I wrote this Stochastic indicator trading guide to teach you everything you must know about Stochastic, how to use it, how NOT to use it, and why.
Here’s what you’ll learn:
- Stochastic indicator explained: What is it and how does it REALLY work
- The 2 DEADLY mistakes traders make when using Stochastic and how to avoid it
- How to use the Stochastic indicator and “predict” market turning points
- How to use the Stochastic indicator and filter for high probability trading setups
- How to better time your entries with the Stochastic indicator
- When NOT to use Stochastic indicator (hint: it goes against what the “gurus” are telling you)
Or if you prefer…
You can watch this training video below:
Stochastic indicator explained: What is it and how does it REALLY work
Now:
Instead of me explaining the Stochastic oscillator or what the Stochastic indicator is about, here’s what the founder of Stochastic has to say…
“Stochastics measures the momentum of price.
If you visualize a rocket going up in the air – before it can turn down, it must slow down.
Momentum always changes direction before price.” – George Lane
In other words:
The Stochastic is an indicator that measures momentum in the markets.
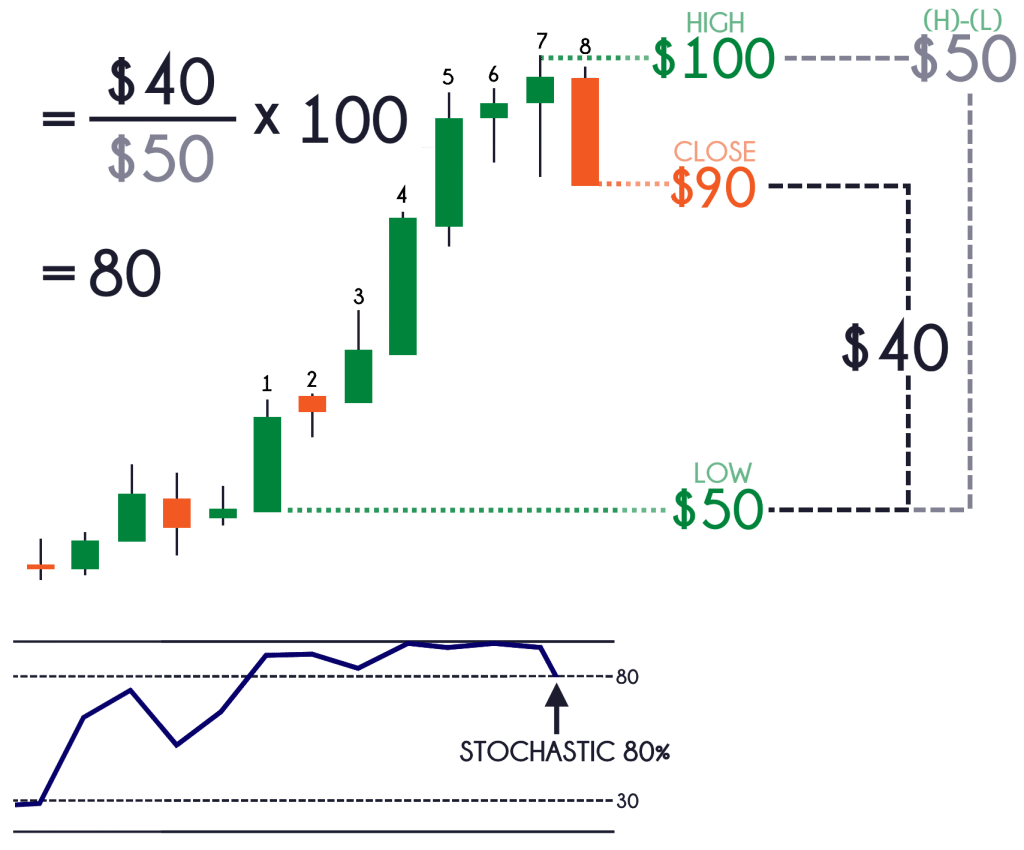
And for you math geeks out there, here’s the Stochastic formula to calculate it…
%K = (Current Close – Lowest Low) / (Highest High – Lowest Low) * 100
%D = 3-day SMA of %K
Where:
Lowest Low = lowest low for the look-back period
Highest High = highest high for the look-back period
%K is multiplied by 100 to move the decimal point two places
Are you confused?
Yeah, me too!
That’s why this image below will explain the Stochastic formula better (using an 8 period Stochastic)…
Moving on to Stochastic indicator settings (or Stochastic oscillator settings)…
Stochastic indicator settings
Now just a quick one.
The settings on my Stochastic indicator is (20, 1, 1) and it’ll show a single line instead of the traditional 2 lines.
Here’s what I mean:
Now there’s nothing magical about it and you shouldn’t think too much about finding the best stochastic oscillator settings.
I use 20-period because there are 20 trading days in a month, and a single line is enough to interpret what it means.
Does it make sense?
Great! Then let’s move on…
2 DEADLY mistakes traders make when using the Stochastic indicator — and how you can avoid it
This is important.
If you can avoid these mistakes, then you’ll save yourself hundreds if not thousands of dollars in the long run.
They are:
- Going long just because the market is oversold
- Thinking the market will reverse because you spot a divergence
I’ll explain…
1. You go long just because the market is oversold
Recall:
The Stochastic is an indicator that measures momentum in the markets.
So, when it’s at overbought level (above 80), it means the market has strong bullish momentum.
And the last thing you’d want to do is “blindly” go short just because Stochastic is overbought.
Here’s why:
As you can see, if you went short just because the market is overbought, it would have been a painful experience.
Because the market can remain overbought/oversold for a long period of time – far longer than your account can withstand it.
Next, let’s move on to the 2nd deadly mistake made by traders…
2. You think the markets will reverse because there’s a divergence
A divergence occurs when the price makes a higher high but the indicator shows a lower high — which means the 2 signals diverge from one another.
Now…
According to trading textbooks, courses, and etc. they will tell you that when you spot a divergence, it means a reversal is about to occur.
But that couldn’t be further from the truth.
Here’s an example:
As you can see, there’s a divergence but the market didn’t reverse.
In fact, it continued to head lower for quite a while.
Now at this point…
You’ve learned the 2 biggest mistakes traders make when using Stochastic and how to avoid it.
Now you’re probably wondering:
“So, what is the correct way to use the Stochastic indicator?”
Well, that’s what I will share in the next section.
Read on…
How to use the Stochastic indicator and “predict” market turning points
If you haven’t realized by now…
The reason why traders fail with Stochastic is because…
You don’t use it in the context of the market.
You’re probably thinking:
“What does it mean?”
Simple.
Trade with the trend — and not against it.
If you look at the earlier examples, most of the common mistakes can be avoided if you’re not trading against the trend.
Make sense?
Great!
Then let’s see how you can adopt this principle and use Stochastic to “predict” market turning points.
Here’s how to use stochastic indicator…
- If the price is above 200-period moving average (MA), then look for long setups when Stochastic is oversold
- If the price is below 200-period moving average (MA), then look for short setups when Stochastic is overbought
Here’s an example:
Now…
This doesn’t mean you “blindly” go short when Stochastic is overbought.
But it can help you anticipate where the pullback might end, so you can better time your entry and trade with the trend.
Can you see how a simple tweak makes a BIG difference?
Great!
Moving on…
How to use the Stochastic indicator and filter for high probability trading setups
I’m not sure about you.
But whenever I put on a trade, I want to know where I am in the “big picture”.
Why?
Because if you want to find high probability trades, then you want to be trading with the higher timeframe trend — and not against it.
So how do you do it?
Well, you can use the Stochastic indicator to filter your trades.
Here’s how to use Stochastic oscillator that way…
Let’s say you want to go long on the 1-hour timeframe.
But before you do so, check the daily timeframe and see where you are in the “big picture”.
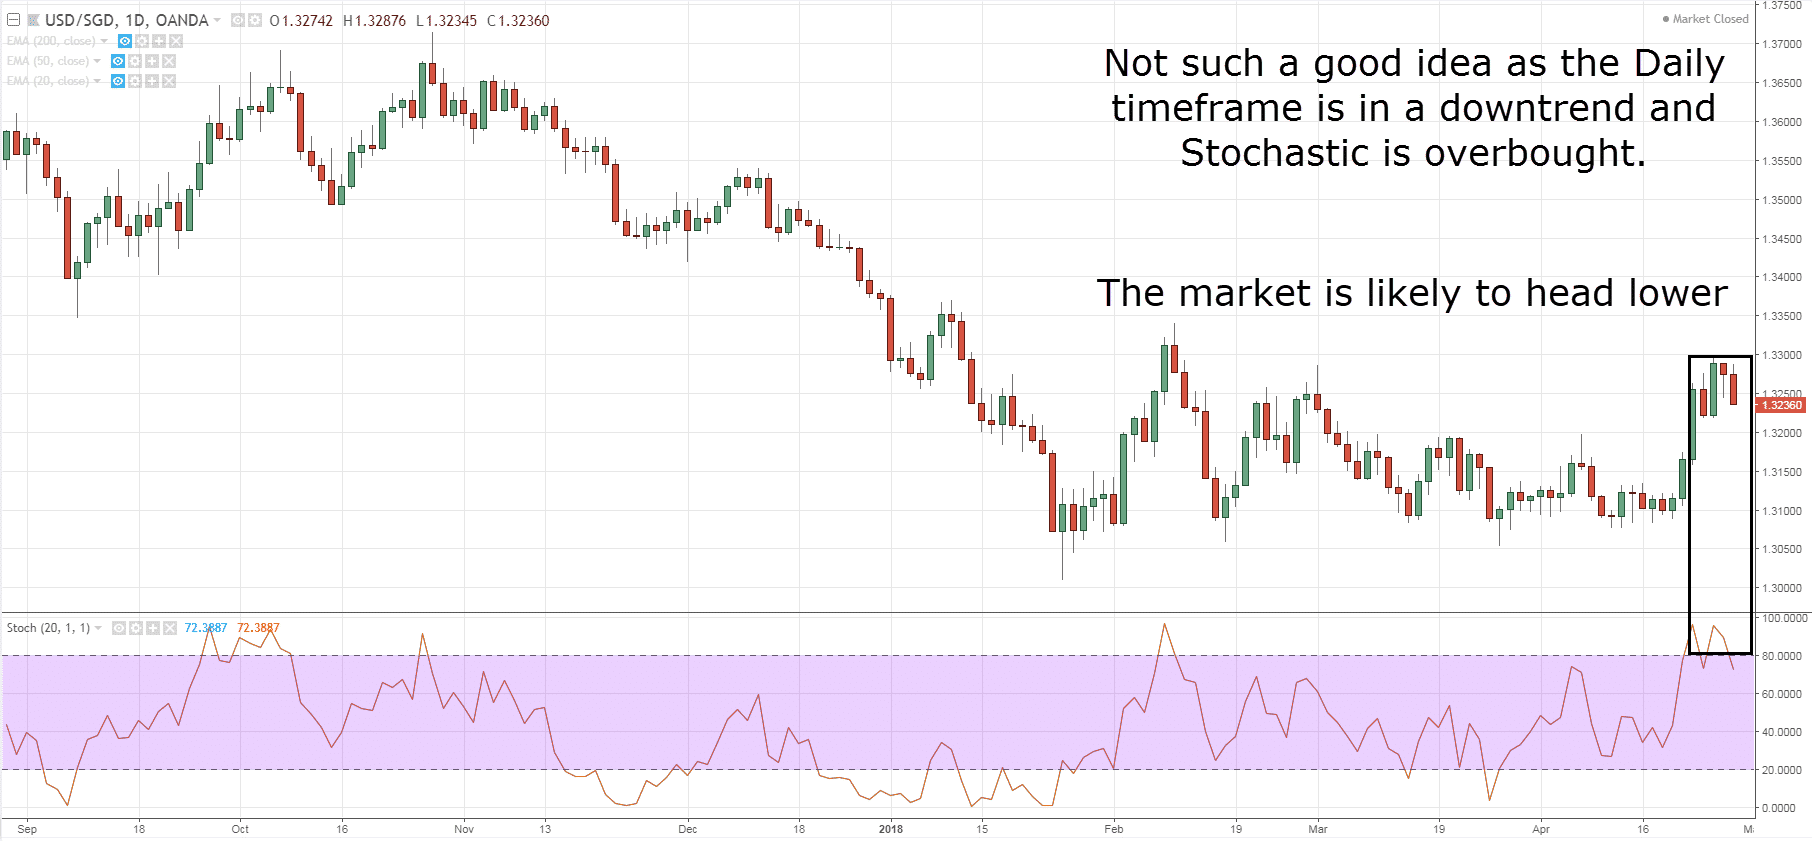
You want to make sure the daily timeframe is not in a downtrend with Stochastic overbought.
Because that’s where the market is likely to head lower — and you don’t want to be long.
An example:
Most of you might want to go long based on the chart below…
But…
If you look at the higher timeframe, you’ll realize something is not right.
The higher timeframe is in a downtrend and Stochastic is at overbought level.
So chances are, the market is likely to continue trading lower, and you don’t want to be long.
Here’s what you should do instead:
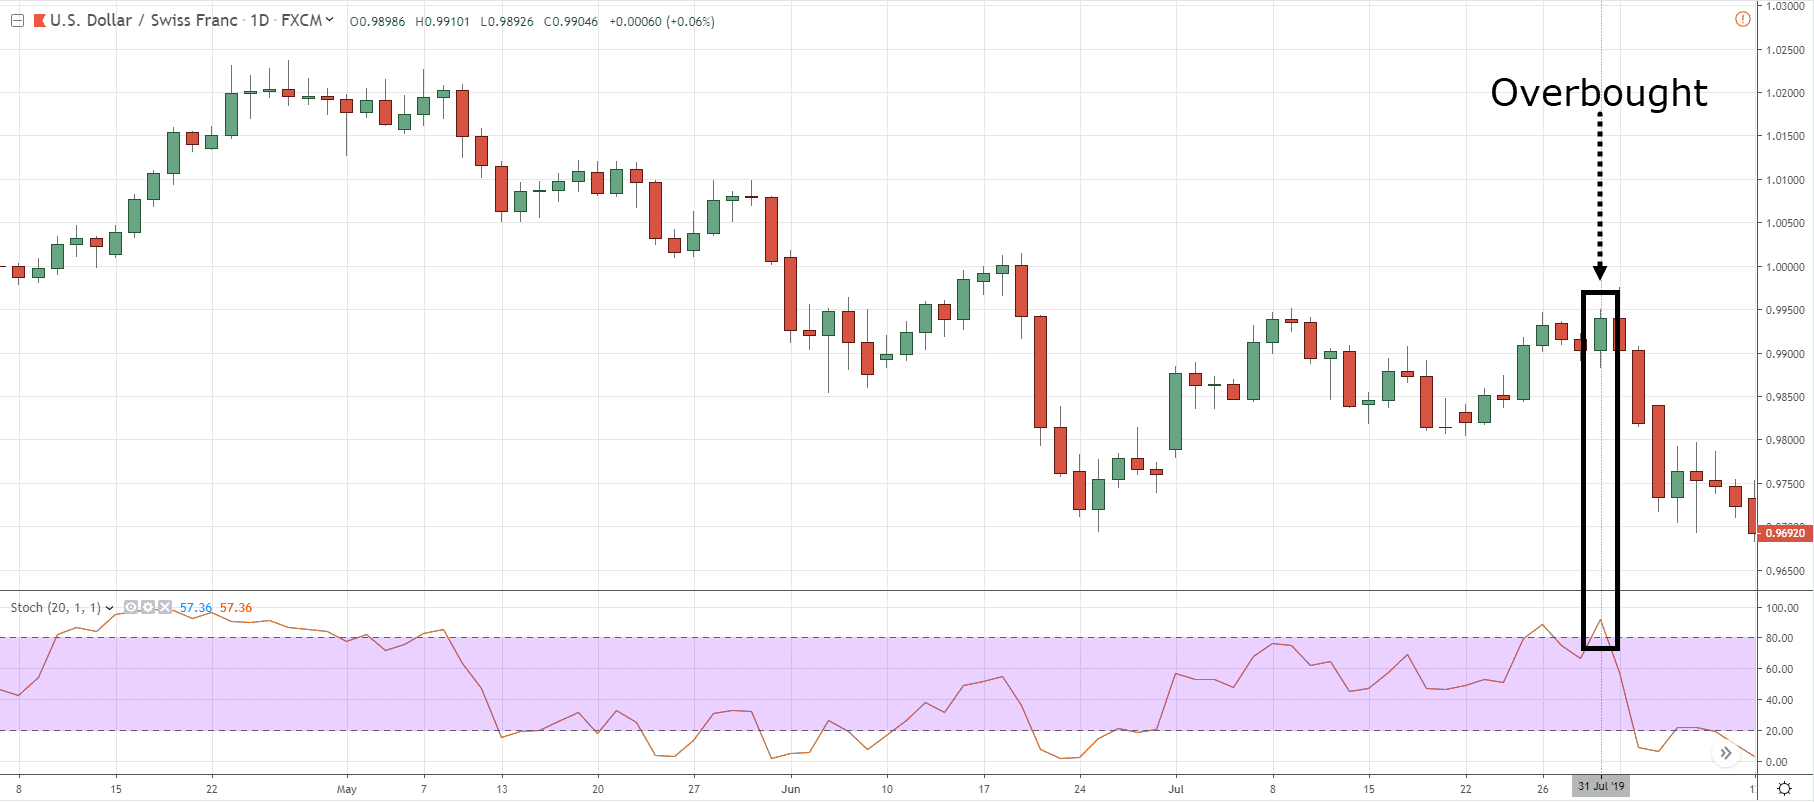
If the Daily timeframe is in a downtrend with stochastic overbought…
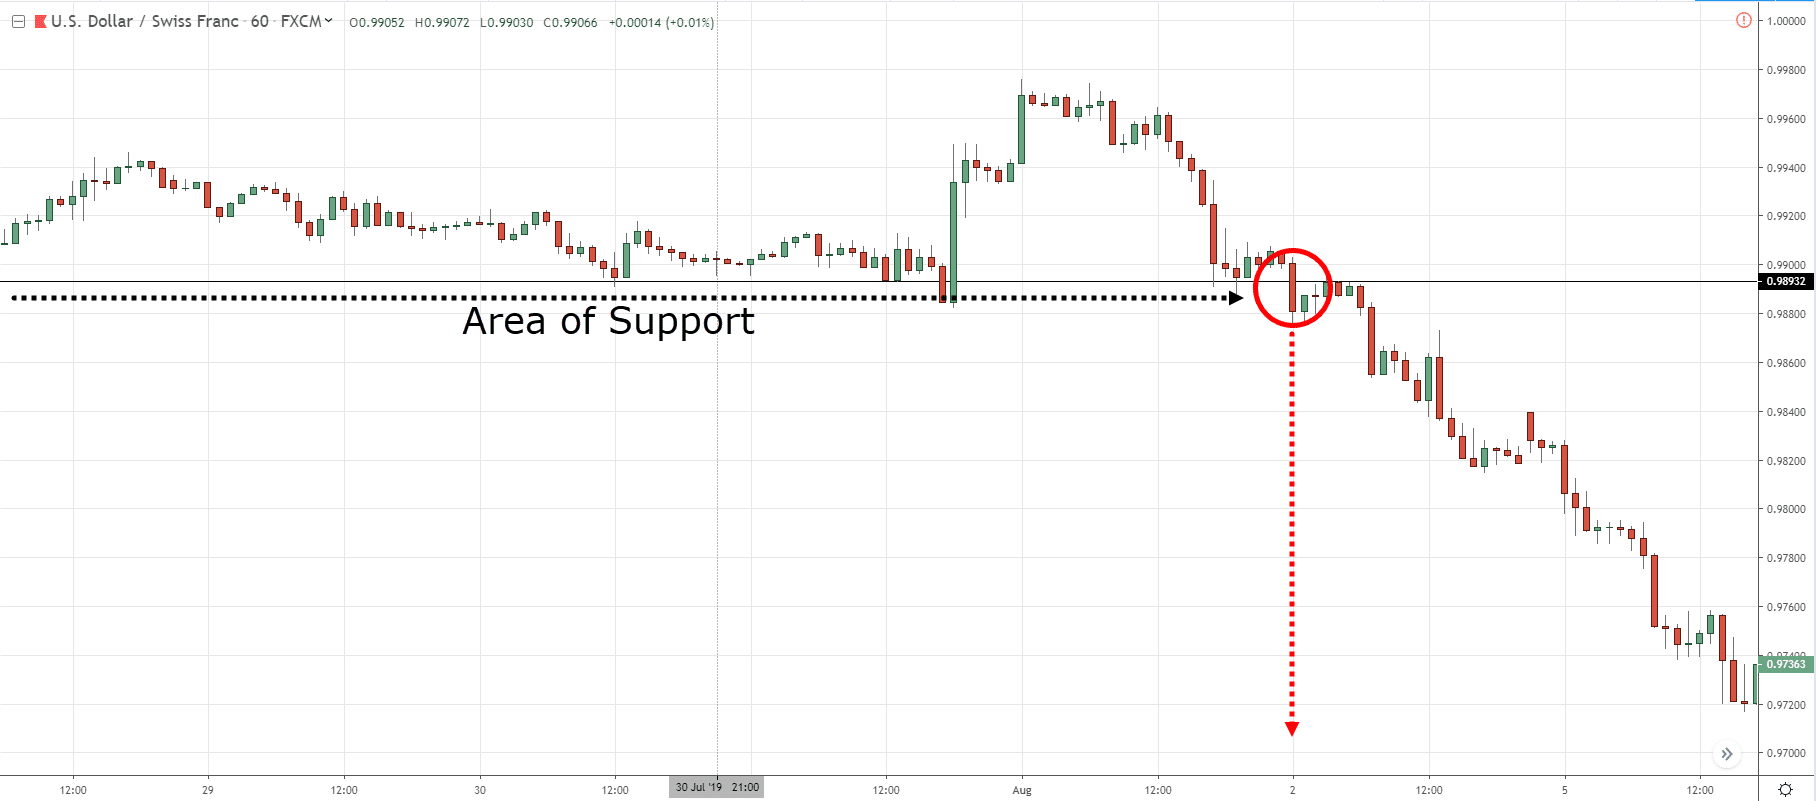
You’ll look for trading setup on the lower timeframe – to go short.
Your entry trigger can be a bearish breakdown from Support on the 1-Hour timeframe.
I’ll explain…
USD/CHF on Daily timeframe with Stochastic overbought:
USD/CHF on 1-Hour timeframe breaking down from support:
Can you see how it works?
Great!
How to use the Stochastic indicator to better time your entries
Now unlike chart or candlestick patterns where the entry can be subjective, the Stochastic indicator doesn’t give you that problem.
That’s because there’s no discretion for the entry.
It’s either YES you enter, or NO you stay out.
So if you’re the type of trader that is always unsure whether you should pull the trigger, then this entry technique is for you…
Here’s how to use Stochastic oscillator to time your entries better…
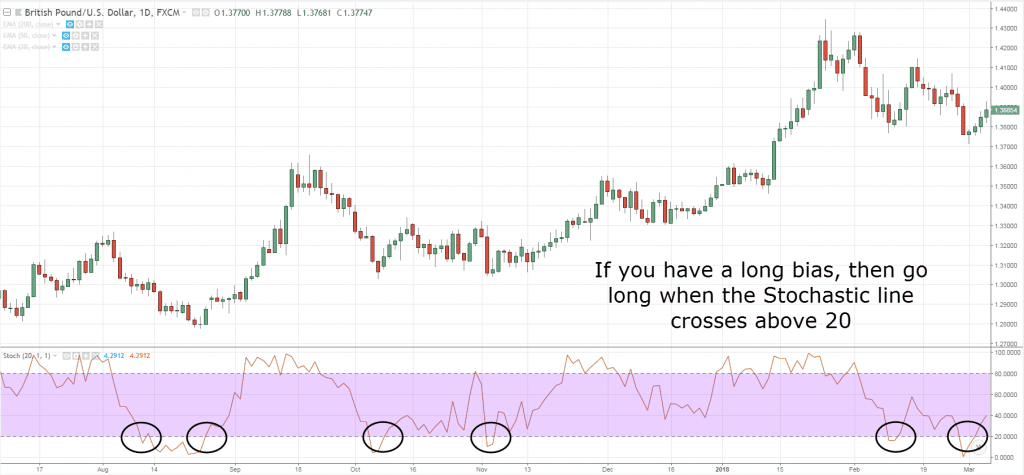
- If you have a long bias, then go long when the Stochastic line crosses above 20
- If you have a short bias, then go short when the Stochastic line crosses below 80
Here’s an example:
Now, what does this means?
Recall:
The Stochastic indicator measures momentum.
So, when you see the Stochastic crossing above 20, it’s telling you bullish momentum is stepping in (and vice versa).
And one important thing:
Don’t mistake this as a trading strategy because it’s not.
Rather, it’s an entry trigger to get you into a trade.
A BIG difference.
Why you don’t need to use Stochastic indicator in a range market
Now:
If you search the internet, books, courses, and etc, they will tell you the best time to use the Stochastic indicator is in a range market.
Why?
Because you can wait for the price to be overbought before shorting (and vice versa)
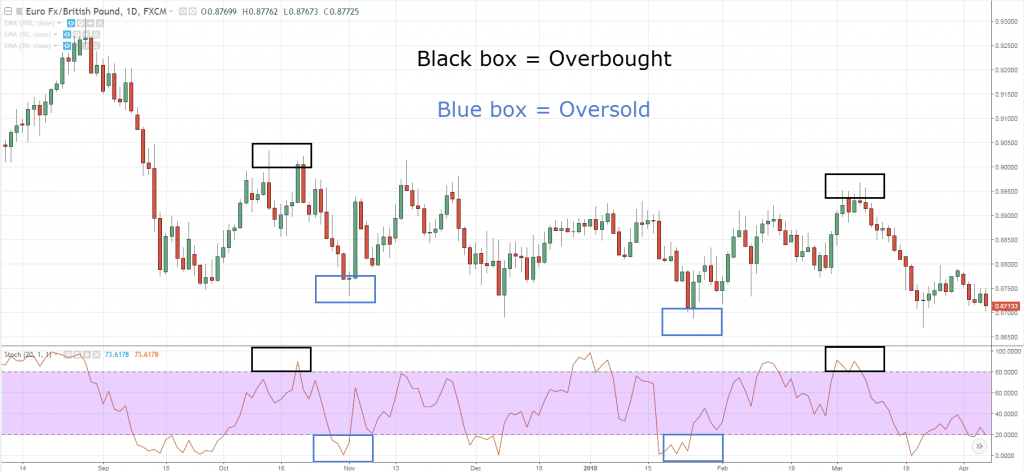
An example:
And from the looks of it, it seems that Stochastic indicator can pinpoint the tops/bottoms of a range with deadly accuracy.
But here’s the thing:
Do you REALLY need a stochastic indicator to do so?
Nah.
Because all you need to do is…
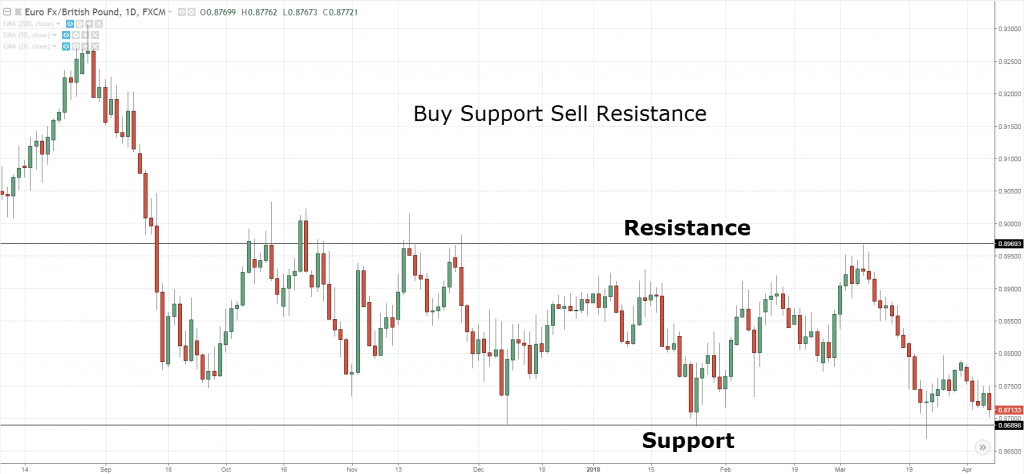
Short Resistance.
And voila! You get the same result.
Here’s what I mean:
As you can see… you’ve accomplished the same thing as what Stochastic did — but with less clutter on your charts.
Does it make sense?
Awesome!
Frequently asked questions
#1: How can I use Stochastic Indicator to tell me if the market is in a range?
You don’t need to use the Stochastic Indicator to tell you if the market is in a range or not. Because if you find that the price keeps retesting the highs or lows multiple times, then the market is in a range.
Alternatively, when the market is in a range, you’ll observe that the Stochastic Indicator tends to reverse near the 70 area and the 30 area. For example, if the market is in a range, it tends to find support when the Stochastic value is at 30 and it tends to find resistance when Stochastic value is at 70.
#2: Is there a good way to combine the Stochastic Indicator with other indicators?
Yes, it’s possible. Stochastic Indicator is useful to identify area of value on your chart and to serve as an entry trigger.
The first way to go about it is to combine the Stochastic with a moving average:
- Use a moving average to determine the trend
- Use the Stochastic to identify the area of value in the trend
- Then use candlestick patterns to serve as an entry trigger
Alternatively, you can:
- Use a moving average as a trend filter
- Use support and resistance as an area of value
- Then use Stochastic Indicator as your entry trigger
In this case, Stochastic is acting as an entry trigger. So if the market is in a downtrend and the price is at resistance, you can look to sell when the Stochastic crosses below 70.
Conclusion
So here’s what you’ve learned today:
- The stochastic is an indicator that measures momentum
- Don’t go short just because Stochastic is overbought because it can remain overbought for a long time
- Spotting a divergence doesn’t mean the market will reverse. It fails more often than not in a trending market
- In a downtrend, overbought level on Stochastic can help you time when the pullback might end (and vice versa in an uptrend)
- The Stochastic can serve as an entry trigger to go long when it rises above 20 (and short when it cross below 80)
Now here’s my question for you…
How do you use the Stochastic indicator?
Leave a comment below and share your thoughts with me.




Awesome!, Handsome
Cheers
Is there an indicator that tells you market is ranging?
You can use oscillators like RSI or Stochastic.
But you don’t need them as your eyes can do it too.
Hi rayner, is your stochastic settings applicable to all time frames?
Good lesson Rayner thank you very much.
You’re welcome, Fabio.
Thank You for your lesson Mr Rayner…
My pleasure!
As clear as a bell. Thanks Rayner.
I’m glad to hear that, Van.
Very interesting lesson . Thank you
Cheers
Rayner you are an Iumination to your generation and beyond. i have struggled to understand this stochastic concept for a while now. but today after reading and watching this material, am good. and have started making profit instantly. more wisdom to you.
Awesome to hear that!
Could please share how you simply use your stochastic profitably..? Thanks
Rayner- you are god-sent. It could not be explained any simpler. Sharing this and many previous videos only shows the caring side of you. Thanks.
Thank you for your kind words!
How can you tell when a ranging market is about fo breakout of its range
This post will help… https://www.tradingwithrayner.com/support-and-resistance-trading-strategy/
Thank Rayner bunch it was very helpful and insightful. thanx again
Thank you for explaining STS further 🙂
You’re welcome!
You talk about everything but how to determine where to exit?
Thanks!
Robin
These post will help with your exits…
https://www.tradingwithrayner.com/set-stoploss/
https://www.tradingwithrayner.com/2-how-to-know-when-is-the-best-time-to-exit-your-trades/
Rayner you are genious but please let me know complete about divergence
I believe you can find tons of information on Google.
I printed out this article and brought on my work. I want to master in stock trading even if i have a full-time job here in Philippines. I keep reading on it even my co workers laugh at me.thank you rayner
You’re welcome, Janel. Keep on pushing!
Nice one Rayner! Pls can i get a PDF of this?
I don’t have it.
I’m new to this so I’m still researching about these indicators. But I think it would be best to use it together with other indicators like candle stick patterns, moving averages, support and resistance, and the like. Is that a good way to use stochastics? Thanks a lot sir Rayner.
There’s no best way to use an indicator.
What’s important is to understand how it works and then complement it with your own trading approach.
Hi Rayner, Thank you very much. this is very helpful for me or us newbie in trading fx or stock. You are inspiration just like your fried from the Philippines JC Bisnar. Im from philippines and big fan and a follower of you in investa and fb. Again, thank you very much.
You’re welcome, Nobie.
I appreciate the kind words!
Awesome. I Got it now! Thank you so much sir.
You’re welcome!
Thanks rayner
,do this strategy work in intraday?
I mean stochastic of 20 period will applicable in 5min,15min or 1days???
The concept can be applied the same.
Thanks a lot, Rayner! This is really helpful, more than you’ll ever know.
Awesome to hear that, Alex.
I use 5,3,3. Sir what is the difference between 5,3,3 and 20,1,1
The lookback period and the smoothing of Stochastic.
Thanks a lot for enlightening me. Was following wrong path of buy or sell when overbought/oversold. Will try this soonest.
Sure, let me know how it works out for you. cheers
Thanks a million, Rayner
I hope what I’ve read today is gonna help me a lot when trading.
Happy New Year!
Awesome, happy new year!
Thanks Rayner for sharing your professionalism with us !
When checking time frame, what I notice is that, H1 is trending downwards and EMA is above which is what we are looking for, but on D1 is trending upwards and EMA is bellow, which confuses potential pull-back entry.
Which time frame should we follow, H1 or D1 ?
Also, do we need to take into consideration W1 an MN time frames ?
Many Thanks for your help !
HAPPY NEW YEAR 1
I suggest following the signal on your trading timeframe.
Anything below it is noise to you.
To determine what best time frame to use on Monday create EMA 133 or SMA 200 from your chart I prefer Exponential Moving Average 133 by Friday compare you EMA 133 from 15min to 4H chart you will notice the market support and resistance were respecting more the 30Min & 1H chart.
Best time frame to trade 1H and your pull back 30Min. There 4H and D1 serve as mirrors for a bigger picture
Thank you for sharing, Dokta.
thanks, very clear and well presented
I’m happy to hear that, Mimi.
An excellent summary of the stochastic indicator however I do use the two lines it has definitely shown me that when it’s over 85% and they sometimes touches a hundred that is a rally
Thanks for sharing, Carl!
Awesome lesson….can the same setup be used in binary one min and be accurate
I don’t trade binary.
I trade binary. I use the standard stoch setting on 1 min . Similar to Raynor s technique
Hi Rayener,
You nailed it!!!!
But I have a question. When you were talking about using Stochastic as entry trigger, you mentioned we can go long when Stochastic crosses above 20 and short when Stochastic crosses below 80. Is it irrespective of trend in higher timer frame? In other words, is it about following short term trends (or pullbacks)?
It’s none of the above.
It’s simply an entry trigger to enter a trade once your other trading criteria (that you have set) are met.
During oversold or overbought, go back to SnR rules and candle anatomy to see it is reversal pin bar or engulfing candle or insider bar.
Thanks for sharing, Ong!
Higher TF would be more strong signal
wow! Rayner i have learnt that the stochastic is an indicator that is used to measure momentum. i shouldn’t go long or short simply because the stoch is over bought or over sold! i have learnt that i can use the stoch to better time my entries that is when am using the stoch settings 20,1,1,,, with good trade setups! thanks man
Awesome, Martin!
I love u man… Your theory… I m your big fan !!!
Thank you, I appreciate it!
Awesome technique
Cheers
Thank you for the information shared, I learned a lot and now I can use stochastic with confidance. Keep it up
My pleasure, Musa!
Nice one Rayner. Thank you. I have one question. If you check one the 1 hour timeframe and it’s an uptrend but in the daily timeframe it’s a downtrend, would you advice to base the trade upon the daily timeframe or just ignore the pair? PS: you’re an intraday trader.
You can trade the long side on the 1-hour timeframe but know that you’re trading against the higher timeframe trend, so you exit should be more conservative and don’t overstay your welcome.
Thank you sir…god bless
My pleasure!
Thank you, It is a great description. Just a question. 200 SMA or 200 EMA ?
It’s EMA.
Thank you for this lesson, i learnt new thing today about the use of Stochastic indicator.it was really a good lesson.thanks.[i use 14,3,3, before but i need more clarification please.]
Rayner, I really like how you explained support resistance levels using stochastic indicator, also knowing what the lower time frame is doing stochastic wise what higher the time frame.
Great job
God Bless
My pleasure bud!
Interesting and informative. Thanks.
Cheers
My entries are based on stochastics.
I use 100MA, if it points up, and stochastics is moving out of oversold, i go long. and vice versa for short entries.
But my exits has nothing to do with stochastics.
Thanks for sharing!
Thanks for this information.
You’re welcome!
Read this but can’t stop thinking about the simplicity of such huge information given out for free when others would have sold this stuff maybe for a 100dollar. I am so humbled by your desire to help others succeed inspire of your busy schedule. You amazed me by the way you keep rewriting the wrongs we have read about trading from some of these so-called trading books with simplicity. No wonder simple trading concept are more profitable. Thank you for your time, thank your for all your articles, thank you for your videos. Always know that there is someone’s life in the deep part of Africa you are changing for the better as the days passes by. God bless greatly. Keep flourishing, my friend. Once again, thank you!!!
Thank you for your kind words, I appreciate it!
HEY Rayner, i am trading using FXCM trading station, noticed that you are using trading view with stochastic parameter 20,1,1, what is the parameter setting in FXCM ? it looks diffrent at FXCM trading station
Thank you. Very glad to learn that short stock below 200 MA & Stochastic oversold then. Sir, will you please describe RSI and ADX in such a simple way ?
Sorry, short stock below 200 MA & stochastic overbought then. Please describe RSI & ADX.
Great stuff. Thanku so much
Cheers
I’ve been using stochastic indicator wrong thoo its been giving me good results I guess it’s I’ve just been lucky with my trading, Thanks Rayner for educating us on this indicators your doing a nice work God will reward you abundantly.
Regards
You’re welcome!
I buy when the stochastic cross above 20 level and sell when the stochastic cross below 80 level. And if I’m buying 1h time frame I must first check if daily time frame is above 200ma and stochastic is oversold and if it’s below 200ma I must check D1 if it is below 200ma and stochastic is overbought.
Thanks for sharing!
The chart you used in this article of Euro FX/British Pound is same as was shown in “The NO BS guide to Swing Trading”.Isnt it?
It might not be a good idea to show the same chart every where to prove your point and make your life easier..
Please dont get me wrong, I too want to help traders only…and I feel constructive criticism always helps…Isnt it?
I use my Stochastics with 20,9,2 setting. I used to use it with 5,3,2 setting but it’s a bit too noisy for my liking. I started using the 20 because of you. Pretty good entry and sell signal when there’s a crossover of the 20 and 9. Can’t rely on just that though. You have to wait for confirmation because it can turn on the dime! The idea is the same though. Thanks for all that you do! Over 2 years in the market and you’ve turned my trading experience around!
Thanks for sharing, Luis.
And awesome to hear that!
You said friend short when it is below 80 , but many times it reverse from there and go again in overbought area, it can happen 3 4 times
You might want to re-read again.
Hey Rayner! Thanks for your tutorial! It’s great!
Right after I read your tutorial here, I come up with something! Using your Osci set up and technique, I can combine it with breakout system and ride the massive trend after that.
Your YT Channel is also inspired me to create my own channel and share my experiment about Osci breakout. First start is good, because I made 800 pips floating plus, and CUT the LOSSES with minimal amount of risk.
You can check my vid here if you don’t mind
https://www.youtube.com/watch?v=8I28_5_2zwU
Thanks. So much love from Japan.
Thank you for sharing!
I am trading in the Saudi market only does it work for me and is the analysis one for all currencies and thank you
Kindly share your free e-book on stochastic.
Thanks
Go long when it crosses above 20 and short when it crosses below 80. But in the section where we can use MA with Stoch, when in downtrend, and price at resistance level, go short when the stoch is below 70. Then why not in 80 level?
One of the best explanation that I could have received on the correct way to use Stochastic. Indicator. All the clutter in my mind is gone. Thanks for piecing the article in such simple language !!!!!
Hi Maqsood,
I’m so glad to hear that!
I use support and resistance, and I also use supply and demand for pullbacks
Hi Avee,
I’m glad to hear that!
Cheers.
What a great explain about stochastic.
Thanks guy
I use stochastic with Bollinger bands, both default settings. And moving average (200, 50 &21) to filter trends
Hi Val,
I’m glad to know that.
Very helpful rayner
Hi Sridhar,
You are most welcome!
Thank you Rayner, to the point article!!!
Hi Akii,
You are welcome!
THANKS A LOT TRADER, YOUR TEACHING IS NOT ONLY A GATEWAY BUT SUCCESS WAY. KEEP IT UP.
Hi Onyekachi,
You are most welcome!
Cheers.
Nice technique. I like to code it in MT4, can explain how to enter the market and determine stoploss and take profit? Many thanks.
Samuel.
You can use it only for trending markets for a possible entry and not stops.
Hi Rayner..thank you for the good write up, keep it up !
Some trader use Stochastic together with RSI. Whenever Stochastic lower than RSI it is sign of reversal. Somehow I can’t relate this. Any idea?
Buy Support.
Short Resistance.
now this is reallllllly a good words!
Awesome, Kimmy!
Hi . I bought your book (price action trading) wonderful book, l learned a lot of things and l m still learning by following your you tube channel. Thank you sir. You are really generous and honest. You share your knowledge for free. Thank you.
Awesome, Memet!
Very educational and easy to understand and back test …. we love you Reyner in South Africa
Thank you, Vincent!
Rayner you the best..till the day I see you face to face …my best Tutor, and every day motivator
Awesome, You are most welcome, Olu!
Explained it so well
Thank you so much, Ara!
hello! sir rayner, stochatic indicator is this good for scalping strategy? like 1 minute to 5 minute timeframe?
Hey Wilmar,
Rayner is a day trader. He trades on a higher timeframe so are all his teachings.
I hope this helps.
Cheers.
It’s amazing ,
Basically , my family is financialy weak & i’m not able to pay fees for courses, ebooks etc. And here I got what I want to do , knowledge, experience & interest in stock market….. Thank you Rayner…… ❤
I use the stochastic RSI indicator for scalping by using it with the short term support or resistance or swing high’s and low’s in options.
Awesome, Yash!
Awesome bro…
You are welcome, Matt!
Thank you Rayner for your knowledge.
May abundance be showered on you as you share your knowledge!
You are most welcome, Vikas!
Thanks Rayner!!!! You have definitely gave me a full understanding how to use the MA along with the stochastic indicator. I’m still learning the patterns, but this along been a big help❤
That’s good to hear, Nancy!
nice explanation sir, 1)200 day m a, 20/80, are very important
It’s our pleasure, Jagadeesh!
Thanks for your stochastic trading insights Rayner!
The stochastic is my fave indicator, and I use it, with very short parameter settings, for reliable divergence trading. Also, when a short stochastic is superimposed over a longer term one (like you use here), I always look for two great high probability setups, called “the slingshot” and “money on the floor”.
Thank you for sharing your thoughts, Joe!
Thanks so much for revealing secret of stochastic indicator to us, I have a very big question my commando mentor, from what I learnt, we filter the trend with moving average, use stochastic as entry trigger when is overbought if we are in downtrend, Big Boss my question is when are we going to exist the market, what can we use as confirmation of exist, Thanks so much.
Thanks Rayner. This article was clean to understand. I am a beginner to stock market and was studying RSI and stochastic to go on short trading(selling and buying). Please suggest if I can go with a 15 minute time frame and see the stochastic indicator to find the entry and exit level..
Hey Rayner , I am new and have been looking to add an Indicator to my arsenal.
I have learnt that the stochastic is an indicator that is used to measure momentum. I shouldn’t go long or short simply because stochastic is over bought or oversold !
I have learnt that i can use STI to better time my entries that is when am using the stoch settings 20,1,1,,, with good trade setups!
I dont need STI for range markets. In a range, I can simply buy support and sell resistance.
thanks man
Thank you for sharing your thoughts, Dave!