This won’t be the usual MACD indicator stuff you see online.
I won’t tell you to…
- Look for a MACD Divergence
- Wait for a MACD Crossover
- Wait for the MACD Line to cross above 0
Here’s why…
The MACD is just like any other indicators — it’s NOT meant to be traded in isolation.
If you want to use the MACD indicator successfully, it must complement the price action of the markets.
You’re probably thinking:
“Err… so how to use MACD indicator then?”
Well, you’re in the right place because you’ll discover…
- What is the MACD indicator and how does it work?
- Common Mistakes: How not to use the MACD indicator
- How to use MACD histogram and identify momentum reversal
- MACD Indicator: How to use it and increase your winning rate
- MACD Histogram Squeeze: How to identify explosive breakout trades about to occur
Or if you prefer, you can watch this training below…
MACD Indicator: What is it and how does it work
The Moving Average Convergence Divergence (MACD) indicator is a momentum and Trend Following indicator developed by Gerald Appel.
Here’s the MACD formula:
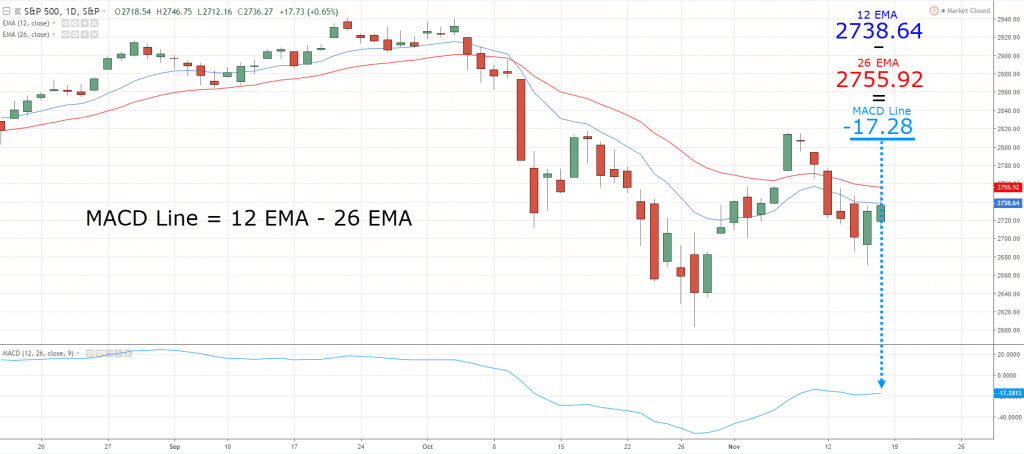
MACD Line: (12-day EMA – 26-day EMA)
Signal Line: 9-day EMA of MACD Line
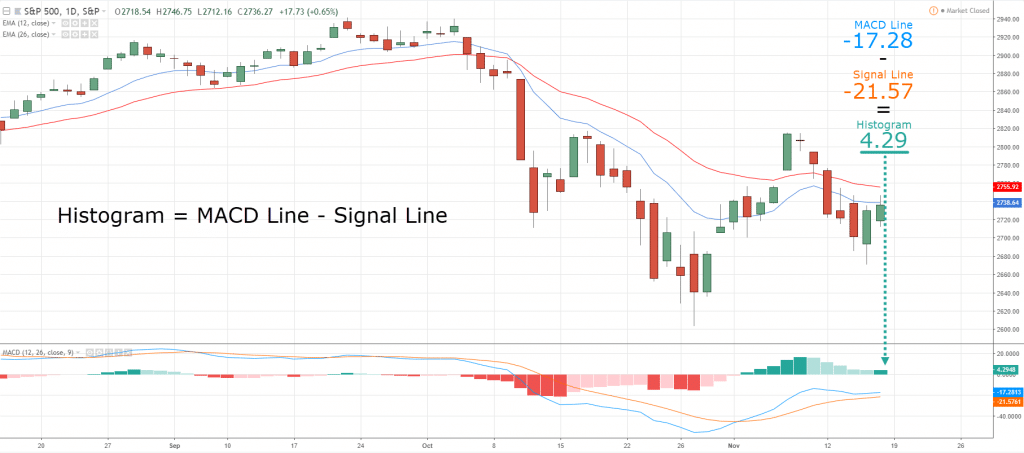
MACD Histogram: MACD Line – Signal Line
Now…
You’re probably thinking:
“It’s too complex and I don’t understand what it means.”
And your brain shuts down.
But wait.
Hang on.
Don’t run away.
Because I’m about to break down the MACD formula step by step — that even a 10-year-old can understand.
Sounds good?
Then read on…
Demystifying the MACD indicator step by step
Now some of you might wonder:
“What’s the best MACD settings?”
Well, there isn’t the best setting because it doesn’t exist.
And for this post, I’ll use the default settings on MACD.
With that said, let’s break down the MACD indicator (step by step).
It’ll be easy, I promise.
#1: MACD Line
All you need to do is take the value of the 12-day EMA and minus against the 26-day EMA (you can find it on your charts with zero calculations).
And poof!
That’s your MACD Line.
Here’s an example:
I told you it was easy, right?
#2: The Signal Line
This gets even easier.
Just take the historical value of the MACD Line and divide by 9.
And that’s it — you’ve got your Signal Line.
Here’s an example:
Let’s say you have a MACD Line of these values…
1, 2, 3, 4, 5, 6, 7, 8, 9
Add the numbers up (which is 45) and then divide by 9.
So, you’ll get 45/9 = 5
Next…
#3: MACD Histogram
This is so easy (it’s laughable).
Just take the value of the MACD Line and minus against the Signal Line.
Tada!
That’s your MACD Histogram.
Here’s what I mean…
Now you might be wondering:
“So, which is the best MACD indicator settings?”
Here’s the deal:
There’s no such thing as a best MACD settings because the market is always changing.
What works best right now is unlikely to work the same in future.
So, the important thing isn’t to optimize for the best MACD indicator settings — it doesn’t exist.
Instead, you should understand the concept behind MACD so you can use it to meet your trading needs.
Does it make sense?
Then let’s move on…
Common Mistakes: How NOT to use the MACD indicator
Now…
Let me share with you 2 common mistakes traders make when using the MACD indicator.
They are:
- Trading the MACD crossover
- Misinterpreting the MACD histogram
Let me explain…
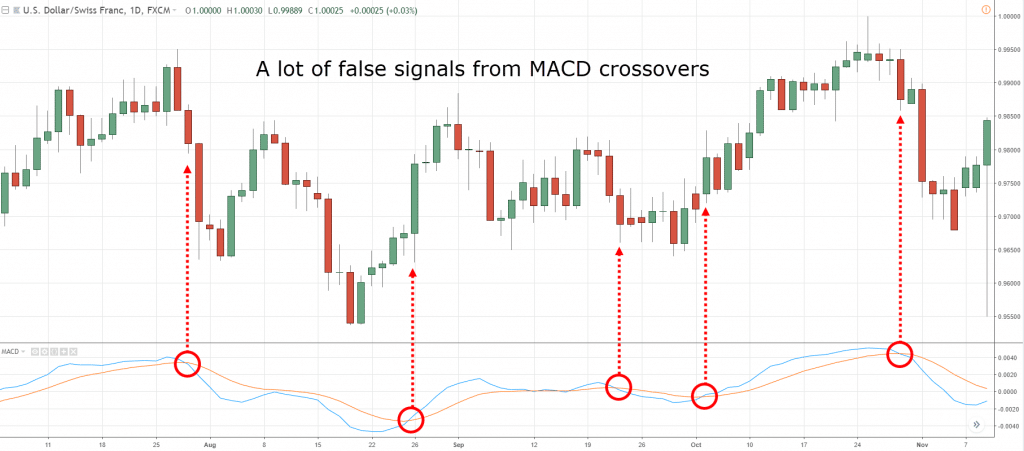
Trading the MACD crossover
This technique might work in strong trending markets.
But remember, most of the time the markets are in a range.
This means the MACD crossover will give many false signals that lead to “death by a thousand cuts”.
An example:
Now, there are better ways to use the MACD crossover (but more on that later).
Next…
Misinterpreting the MACD histogram
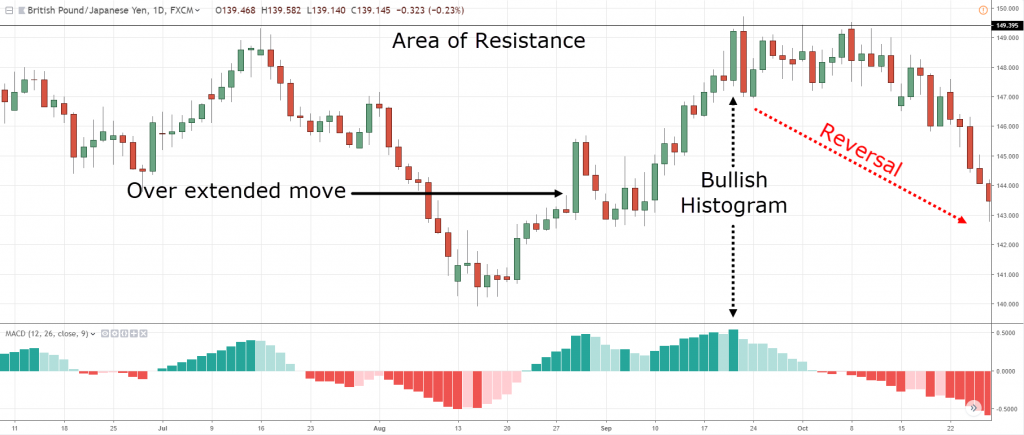
Look at the MACD histogram below:
You’re probably thinking:
“There’s strong momentum in the move. It’s time to buy!”
Wrong!
Because when such a move occurs, it’s usually too late to enter, and the market is likely to reverse.
Instead, a better approach is to go against the momentum — and trade the reversal.
Here’s how it can be incorporated into your MACD indicator strategy…
How to use the MACD histogram and identify momentum reversal
When I first started trading, I like to “chase” breakouts.
The more bullish the candles, the likelier I’ll buy the breakout.
However…
I was bleeding my account.
That’s when I realized I entered my trades “too late”.
I bought when the price is about to reverse in the opposite direction.
And this led to an AHA moment.
I wondered…
“What if I stopped chasing breakouts?”
“What if I took the opposite side of the trade?”
“What if I look to short when there’s strong bullish momentum?”
It worked much better!
However…
I had trouble explaining to traders what strong momentum is.
So…
That’s where the MACD histogram comes into play.
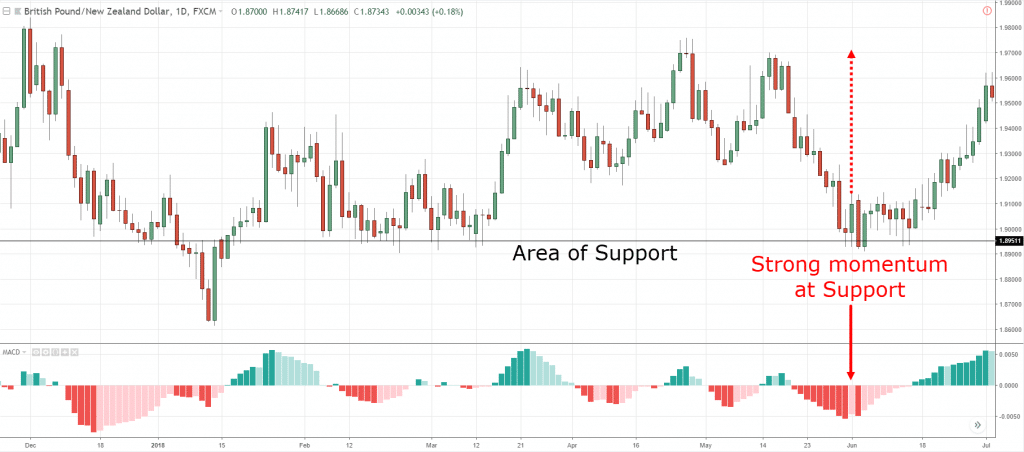
Here’s how it works…
- Wait for the price to come into Market Structure (like SR, Trendline, etc.)
- MACD Histogram shows strong momentum (you want to see a high peak/trough)
- Wait for price rejection before trading in the opposite direction
Here’s an example:
MACD Indicator: How to use it and increase your winning rate
The concept is simple.
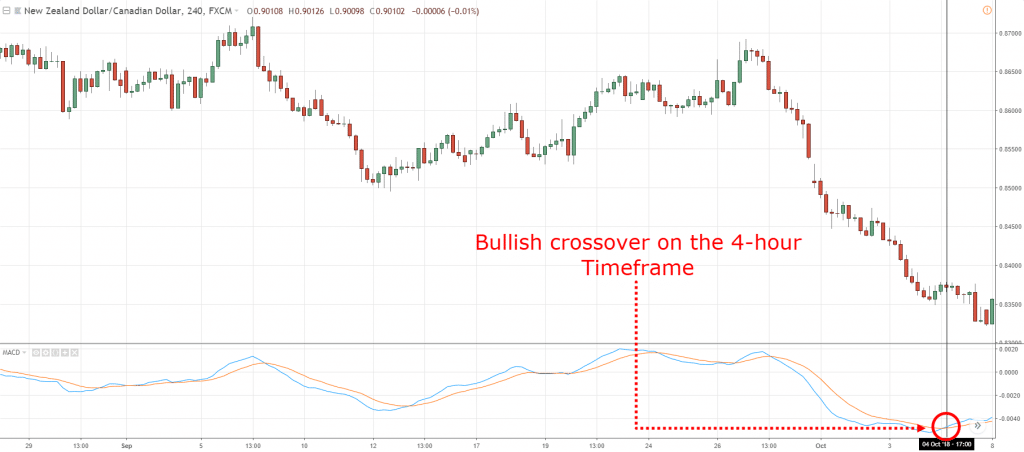
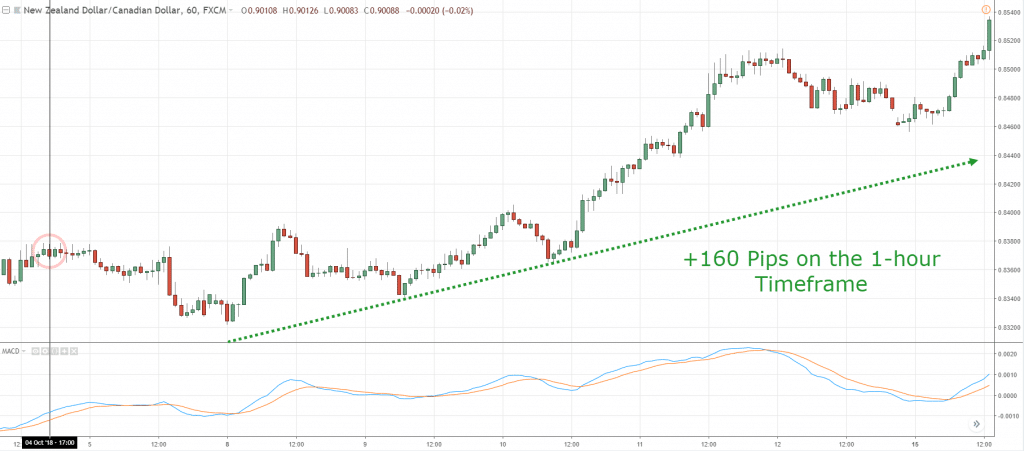
We’ll use the MACD indicator to define the higher timeframe trend, and then trade in the direction of it.
Here’s how it works:
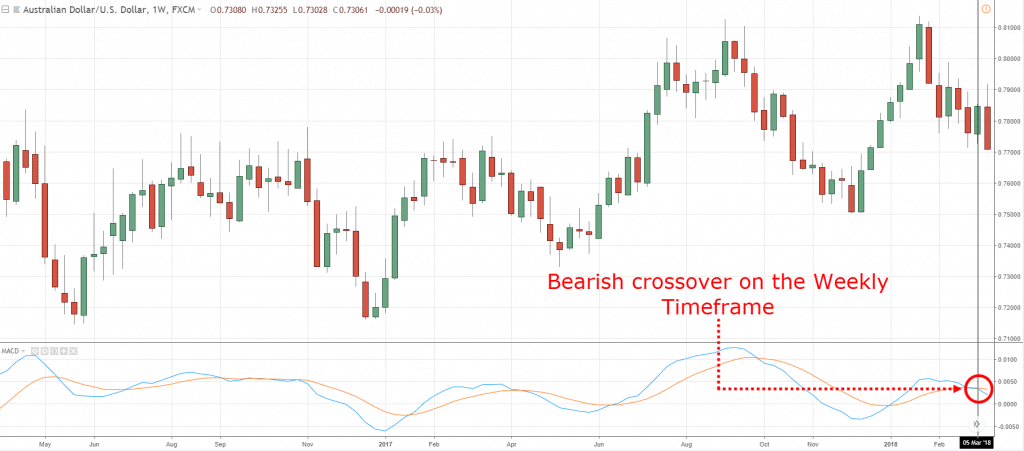
- Define your higher timeframe (HTF)
- If the HTF MACD Line crosses above Signal Line, then look for long setups (on your entry timeframe)
- If the HTF MACD Line crosses below Signal Line, then look for short setups (on your entry timeframe)
I’ll explain…
Define your higher timeframe
Let’s say your entry timeframe is 4-hour, then your higher timeframe is the Daily.
Or, if your entry timeframe is the Daily timeframe, then your higher timeframe is the Weekly.
Your higher timeframe can be anywhere between a factor of 4 – 6 of your entry timeframe.
If the higher timeframe MACD Line crosses above Signal Line, then look for long setups (on your entry timeframe)
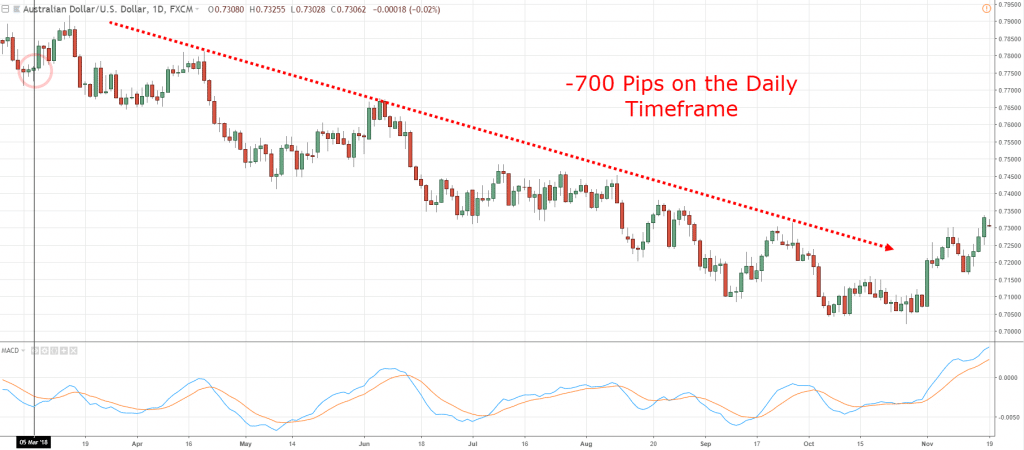
An example:
If the higher timeframe MACD Line crosses below Signal Line, then look for short setups (on your entry timeframe)
An example:
MACD Histogram Squeeze: How to identify explosive breakout trades about to occur
Here’s a fact:
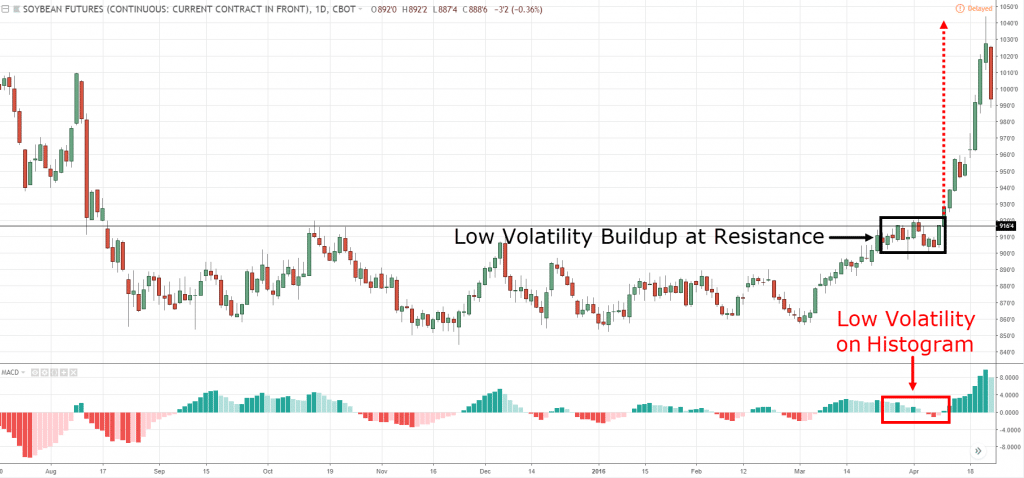
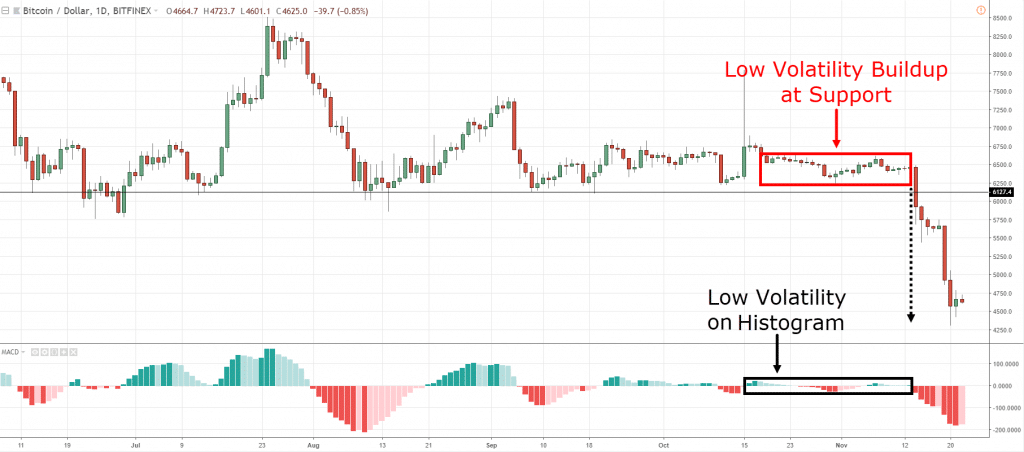
Explosive breakouts usually occur when there’s low volatility in the market — you’ll notice the range of the candles gets small and “tight”.
But if you’re a new trader, this might not be easy to spot.
So, that’s when the MACD Histogram can help you.
Here’s how to use MACD indicator for that…
- The price comes into key Market Structure (like SR, Trendline, etc.)
- The MACD Histogram looks almost “flat” without any visible peak/trough
- Enter the breakout when the price breaks the Market Structure
Here are a few examples:
This is powerful stuff, right?
Now you might be wondering:
“For how long should the MACD histogram be flat?”
There are no fixed rules here.
But generally, I’d like to see it flat for a minimum of 5 candles (or more).
Because the longer it remains flat, the likelihood of a stronger breakout.
Conclusion
So here’s what you’ve learned today:
- The MACD is a Trend Following and momentum indicator
- Don’t “blindly” trade the MACD crossover, it’s not a profitable MACD indicator strategy. Instead, use it as a trend filter so you can increase your winning rate
- You can use the MACD histogram to “predict” market reversals — look for a strong move into Market Structure followed by a price rejection
- When the MACD histogram is flat, it signals the market is ready for a breakout
Now here’s a question for you…
How do you use the MACD indicator?
Leave a comment and share your thoughts with me.



Thanks for sharing your observations … I especially like the the reasons you for why an indicator works and how one should use it.
My pleasure!
Very good insight. Much helpful for me as a naive trader. Thank you for your great efforts.
You’re welcome, Vijayan!
Thank you for sharing. I have learnt quite a lot about the MACD.
Awesome to hear that.
superb man
Cheers
2 Lagging indicators (MA) + 1 Lagging indicator (MACD) =3 lagging indicators.
I find many posts very helpful, but not too sure about this one.
Your assumption needs to be broken.
Don’t trade based upon one peice of information eg just lagging indicators like macd (=low confidence to open trade)
Do trade with confluence or multiple peices of information to confirm swing turn it more than macd crossover (=high confidence to open right trade)
Rayner is perfectly correct
Do you know the candlestick patterns you see on your charts are lagging too?
I would always wait for the cross-over and then trade. Obviously this is an incorrect way of doing it. And may i say thank you for this eye-opener.
You’re welcome!
Hi i have never use it before but as from now i will start practice n see if i did understand it.Thank you
This gives me a eye-opened insight.
Thank you for your valuable sharing.
My pleasure, Hocheol.
Thank you very much
You’re welcome.
Hi Rayner,
I don’t want to flatter you undeservedly, but all your posts are unique in terms of shared knowledge, clear explanation and your approach
to challenge commonly superficial contents of ‘educational lessons’ of forex trading experts.
After having been misled by the latter very frequently I appreciate
highly whatever you are sharing with your thankful followers.
Thank you for your kind words, Joerg. I appreciate it.
The MACD is a widely followed indicator and most techniques for trading it as an indicator known to many. In this age where the algo and institutional traders have dominated trading, what may be deemed as a good trading signal would be use by these big players to provide liquidity for themselves. In other words, they are likely to trigger your stops when you enter on a valid MACD trigger. I find that divergence is the only signal that may be useful. This in itself does not provide a trading signal but can to a certain extent warn of potential moves to the opposite of the established trend. Becareful though… divergence in macd is also often seen in consolidating prices and interpreting it is more art than science.
Hey Jon,
Mind sharing the names of these trading firms that engage in such trading approach?
I’ve studied how the institution and the bigger players trade, but I don’t know of such firm that employs such method.
I’d be keen to hear more.
Thanks for the detailed explanation – I use MACD extensively and cannot recommend it enough to anyone wanting to learn more about it – it is a very powerful indicator if used correctly as shown in the explanation above.
My question to Rayner is – I have been researching on the use of the DEFAULT values of 12/26 for creating the MACD line – do you have any idea as to why those two numbers are used as default? What is the significance of these two numbers? Just curious for my academic interest. Tried looking for the answer for a long time but haven’t been able to find a satisfactory answer so far. Hope you can throw some light on the significance of these two numbers.
Thanks in advance and hope someone can answer my question 🙂
I’ve no idea why those numbers are the default settings.
And I won’t worry about it because the concept is what matters, not the parameters of an indicator.
Hi Rayner
Hey I have a question. Do you use the MACD in your live real money trading and if so, do you use it as a indicator to make real money trading decisions on or do you just use it for confluence of signals?
Thanks in advance
Stock Trading Blogger
StockTradingBlogger.com
I don’t use the MACD since price action tells me the same thing.
The reason I share this indicator is for newer traders, an indicator might be easier for them to “spot” such patterns that might otherwise not be visible to them.
Thanks for this it is so helpful in understanding the MACD
You’re welcome!
I am fan of MACD as an indicator and love using it for trading.
Thanks a lot Rayner for adding to my MACD stuff.
My pleasure, Vinod.
Hi
There’s a few errors on this article.
For example first chart shows 12ema – 12ema instead of 26ema.
On second chart it shows – 21 – -17 = 4 which should be -4
Please take a look to avoid confusion
Thanks
Thank you for pointing out, Karim.
I’ll fix it.
Thank you Rayner. I mainly use the MACD on day trades, but you mentioning the momentum changes with the Histogram, was something I was not aware of. And as always, pricing action first, indicators second.
You’re welcome, Troy!
Hai Rayner,
I see you used MACD Histogram. where can i get that same indicator like yours? Please let me know. Thanks.
You can get it on Tradingview.
Thanks for your guiding post Mr Rayner !
Cheers Bud
best trading material…thanks Mr Rayner
You’re welcome!
Hi Rayner,
Your video is amazing and the way you explain it, its amazing. May I know does this technique only apply for forex or it could be apply on any stock? Does it work for intraday as well such as 1 min chart?
The concepts can be applied the same as long as it’s a liquid market (and timeframe).
Thanks Rayner for your reply, in regards of the time frame…if i were to apply 1 min chart, does it mean I look at 5 mins chart as the multiple of 5?
I won’t recommend 1 min timeframe since most markets are not liquid enough to trade on it.
And to your question, yes.
thanks rayner for your quick response. may i know if its possible to have your email as Ive just gone thru your support & resistance video. can i check with you whether i have plotted correctly on the support and resistance? Can all these be apply to DJ30? thank you
Hello, which one would you prefer as a trend filter on a higher TF the macd cross or the 200sma? thank you!
200MA for me.
Thanks Rayner. I will save this lesson. Excellent.
My pleasure!
Hi Rayner. Thanks again for sharing and being such a great teacher. I trade stocks and have just gone through dozen of stock charts looking at MACD behaviour after reading this MACD lesson of yours. Wow. I’ve had MACD on my charts for over 12 months but clearly I never really knew how to read it properly. Thanks so much my friend you’re the best.
I’m glad to be of help, Graham!
Thanks..
This is the best illustraion for MACD Indicator and the condition to use it via force sites.
I am going to try.
Awesome, let me know how it works out for you.
Ok.
By God will .In shaallah .
Hi Rayner,
I am still new here.
please how can i download this
you are best.
cheers
I have seen almost your all vedios but how I control my emotions thats my big problem. please do something
You explain it straight and simple to understand. I wanted to compare it with stochastics but they’re not the same. Thanks alot by helping us new retail traders
My pleasure, Billy!
Guy, your awesome in your explanation. I have been your fan since I stumbled on your website. Quite educative.
Hello Rayner. I have been following you for two weeks now and what you do is commendable. I am having issues with the MACD.
I use the 20 and 50 period moving average and I know the MACD is dependent on the moving average. I don’t know how to set the MACD to fit my moving average. I have tried but it looks weird.
I didn’t want to use the 3, 10,16 because it isn’t my moving average setting or the 12, 26,9.
I need your help. Thank you.
Hello rayner my exact problem is not knowing the signal line to use. My setting is 20, 50, 9 but it looks weird. Please help thank you.
Iam using MACD Indicator…
Thank you very very very much..for sharing n teaching us…
My pleasure!
It an amazing post and the way you have explained it is more amazing.. Would you care ti explain MFI and compare that to RSI and VWAP and which one is better
AMAZING WORK RAYNER THANKS
Cheers
Beautiful description of the MACD indicator. Look forward to use it and also looking for many such videos from you man. Awesome…..
Cheers
Thanks so much Rayner,
Honestly, you are a great man. Thanks for your love and kind heart.
This is an eye opener compared to the way I used it before, I will add this great idea to my trading skills.
Thanks.
You’re welcome!
Thanks Rayner for the clear description. The android MT4 platform provides the signal lune and not the MACD line. So we can’t use the crossover to identify trend what can we use in this case
Wow!!! This is an eye opener. This MACD strategy is the best explanation I have come across . Thanks alot for the insight of the correct way to use this amazing tool.
Thank you Rayner, Lot of information sharing, u super.
Glad to help out!
Your explanation is excellent!! Neat, Clear & Easy to understand. Double Thumbs Up for your great efforts. Thank you so much 🙂
Glad to help out!
Hey
I got confused 🙁 maybe it’s cuz of my english or it’s my knowledge . if you add some points on images which shows the spots to when buy or sell maybe i could understand :/
Hi again. i just watched your video about MACD and it was very good detailed explanation. now i understand. thanks for sharing your knowledge with us. wish you best ^^
You’re most welcome!
ill use MACD indicator for trading exactly as told by you …
Hey Srikanth,
I’m glad to hear that. Make sure you do some backtesting.
Cheers.
What an insight into the MACD…….thank you so much Rayner.
Hi Martyn,
It’s my pleasure!
I think that it is also possible to use the MACD histogram to identify the places on the chart where the price levels are important Market Structure. Quite simply, if the extremes of the MACD histogram show a possible price reversal near the market structure, the extremes will repeat themselves more frequently at a given price level. This can help you to more quickly identify price levels that are important for the item. What do you think about it?
Thank you so much Rayner.
Previously I always trade after crossovers of MACD/ signal line… Now after reading your article & watching the videos lots of things are cleared now.. thanks again ! Much helpful info you had provided !!
Hi Amit,
I’m glad to hear that!
Thank you bro you are the best
Hi Bendich,
You are welcome!
hi Rayner been following you for some while always excellent explanations , thx, regarding macd is it better( safer) to go long or short once the macd line is above or below the zero line ? i use 15 min and 2 min ,
Please Rayner help me with the traditional MACD two line
Hello Rayner Teo, it’s been great watching your videos and learning from them. Am a trader and has gained my little experience over the two years but want to do more because am a Nigerian and most of my citizens want to invest in hedgford and I have rich individuals that are ready to start but I seek a professional like yourself I can work with. I have my trade records to show you if you will be interested to do business.Thanks
Rayner i have a question if in daily frame signal is for long then can we trade long in 2 hour frame when macd crossover occur?
I apologize for my ignorance, will this work for trading crypto? I want to draw thousand of lines on a million charts to make a billion dollars but have no clue on how to start. Love your YouTube channel.
Hi Erick,
You should backtest whatever that’s being revealed here.
Cheers.
Thank you sir .
You are welcome, Darshan!
Hi Rayner
For the custom colors of the histogram in tradingview, can you share the link to the codes please.
Appreciate your help,
Thank you, Neil
Thank u so much
Hi Rayner, I do 5 minutes scalping so you say I must look at the higher time frame and let’s say I look at 1 hour timeframe. On the 1 hour timeframe macd has crossed the signal line from the bottom…Does it mean on a 5 minute chart I have to take every macd touching the signal line whether it’s above or below the histogram?
Hey there, Sipho!
Tradingwithrayner Support here!
Don’t “blindly” trade the MACD crossover; it’s a losing strategy. Instead, use it as a trend filter so you can increase your winning rate.
For more info regarding the MACD indicator, you can check it here!
https://www.youtube.com/watch?v=eob4wv2v–k
I hope that helps!
Cheers!
HI Rayner,myself use MACD divergence and crossover below zero line for revrsal.
Thank you for sharing, Amrish!
Cheers!
Sir you are great
I learn gradually but I Learning good
Hey there, Gulshan!
Jarin here from TradingwithRayner Support Team.
That is nice to hear. Enjoy the learning process.
Cheers!
I wonder if I can come to Singapore and train under you directly.
Thanks you very much Rayner I appreciate you I am still a newbie anyway but I believe in
Feature am going to understand you better since you analysed different indicators one day I’ll come across the easiest indicator that will suit my trading thanks again
You are most welcome, Idris!
Use 30 min tf for MACD bullish or bearish crossover it works really well. But you have to take a position on smaller tf like 5min. Once the market opens first check on 30 min tf and then decide whether the market is bullish or bearish . After practicing you will be able to find fantastic trades. If the market is flat for few days then use 4hr tf it works amazingly well. Keep learning keep growing keep minting money.
Thank you for sharing, Rdk!
cheers!
histogram (macd) is flat when the market moves sideways. MACD cannot be use. There is no trend and momentum. Use SR and area pattern instead. When market starts to trend you can use the MACD again.
Thanks for sharing, Edwin!
Thank you!!
You’re welcome, Joe!
Hello Rayner,
Well, I am novice in market so trying to learn more thing and the concept you explain is hitting my brain to learn in simple method. Also your vedios helps me a lot to learn.
Thanks
Keep on learning, Dalip!
Cheers!
Hi Rayner
I have learned from this session that the MACD Indicator is a useful tool for evaluating when to lookout for when to BUY or SELL from the MACD line and the Signal line, first using the Higher Time Frame (HTF) then the Entry Time Frame (ETF) setup.
I have also learned how to use the MACD Histogram to determine likely areas of explosive breakouts from low volatility at Support and Resistance levels. This is when I can lookout when to BUY or SELL to acquire more pips from the Bullish or Bearish peak histogram.
Thank you for sharing your insights, Dr Tunde!
Cheers!