Have you heard of the Golden Cross signal?
If you listen to the media, you’ll hear about the Golden Cross (like how the market is bullish when it occurs).
But is it true?
Well, that’s what you’ll learn today…
Specifically, I’ll cover:
- What is the Golden Cross and how does it work
- How NOT to trade the Golden Cross
- How to use the Golden Cross and improve your winning rate
- Golden Cross: How to better time your entry with this ONE simple technique
- How to ride long-term trends with the Golden Cross
Or if you prefer, you can watch this training video below…
What is a Golden Cross and how does it work?
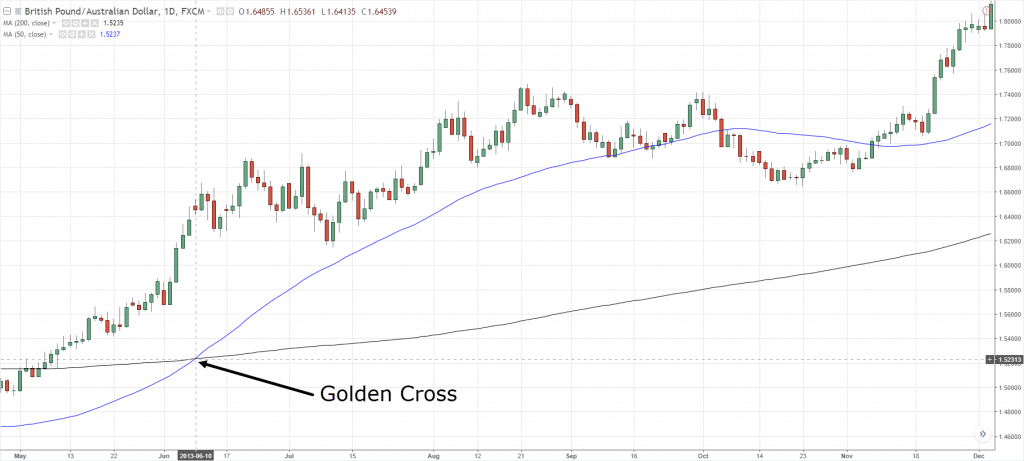
The Golden Cross Pattern is a bullish phenomenon when the 50-day moving average crosses above the 200-day moving average.
Here’s why…
When the market is in a long-term downtrend, the 50-day moving average is below the 200-day moving average.
However, no downtrend lasts forever.
So, when a new uptrend begins, the 50-day moving average must cross above the 200-day moving average — and that’s known as the Golden Cross.
An example of a Golden Cross chart:
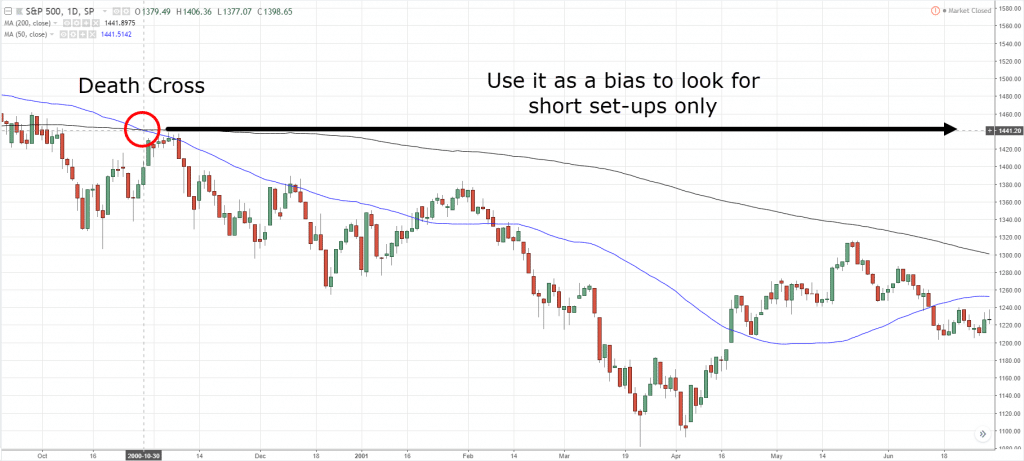
Pro Tip: The opposite is the Death Cross — when the 50-day moving average crosses below the 200-day moving average.
Now some of you are probably wondering:
Is there anything magical about the 50 and 200-day moving average?
Nope.
There’s no magic to it.
You can use the 49-period and 199-period for all you want and it will not matter.
Why?
Because the concept is what matters (which is the short-term trend showing signs of strength against the long-term downtrend).
The moving average is only a tool to define the trend.
Moving on…
How NOT to trade the Golden Cross Pattern
Now I know what you’re thinking…
Let’s go long when the 50MA crosses above the 200MA and sell when it crosses below — and make a ton of money!
Well, not so fast my young padawan.
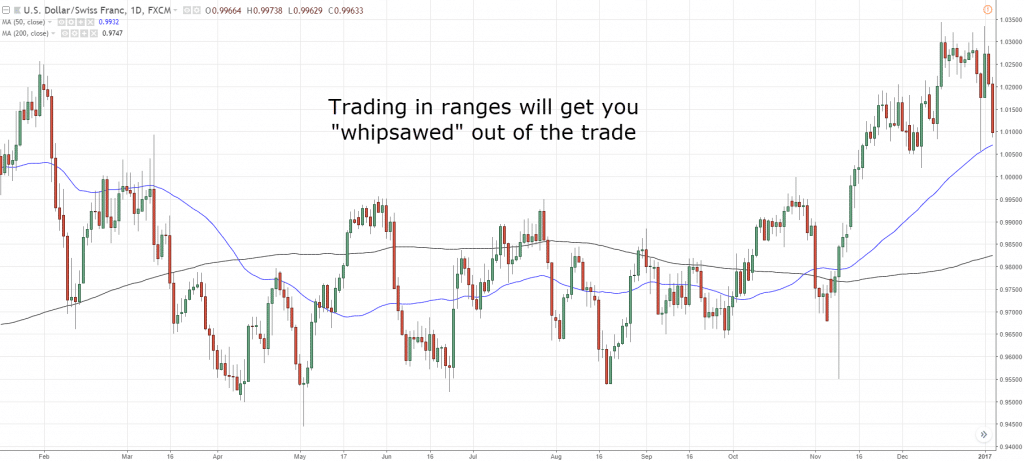
Because in a range market, the Golden Cross will cause many losses (otherwise known as a whipsaw).
Here’s an example:
So…
Unless you know what you’re doing, I don’t suggest “blindly” trading the Golden Cross.
Instead, there are better ways to trade it and I’ll tell you more in the next section.
Read on…
How to use the Golden Crossover Strategy and increase your winning rate
Now…
If you’re the type of trader who always can’t seem to decide whether you should be long or short, then this trading technique is for you.
Because the Golden Cross can act as a trend filter so you can trade on the right side of the markets (and increase your winning rate).
Here’s how it works:
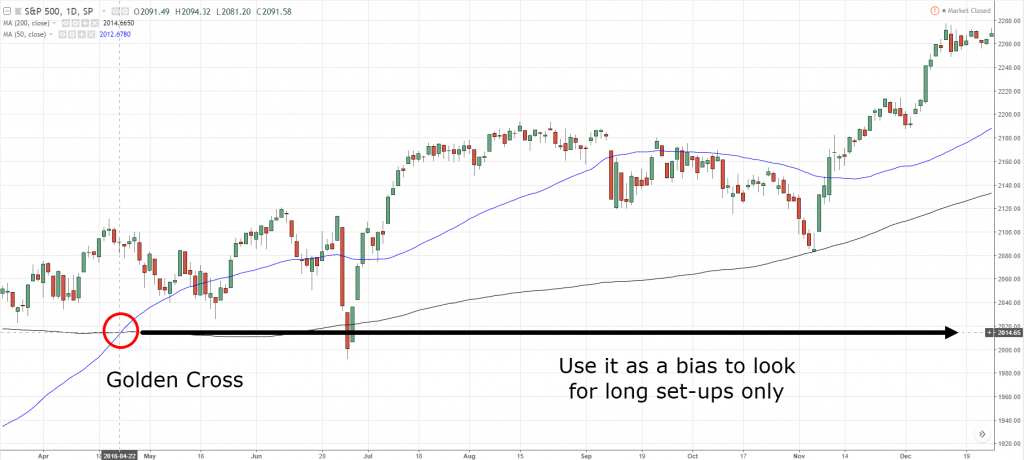
If the 50MA crosses above the 200MA, then you’ll look to long only.
Or if the 50MA crosses below the 200MA, then you’ll look to short only.
Here’s what I mean…
Look for long setups when the 50-day crosses above the 200-day Moving Average:
Look for short setups when the 50-day crosses below the 200-day Moving Average:
Now, don’t get me wrong.
It doesn’t mean go long immediately when the 50MA cuts above the 200MA.
Instead, it means you have the “permission” to look for long trading opportunities when the 50MA cuts above the 200MA — a big difference.
For example:
If a Golden Cross occurs, then you can look for bullish trading setup like a Flag Pattern, False Break, Triangles, etc (which I’ll cover more later).
Does it make sense?
Great!
How to use the Golden Cross and increase your winning rate — for stock trading
Earlier, the examples used were for the Forex and Futures market.
But for stocks, it’s different.
Because individual stocks are “influenced” by its respective stock index.
For example:
Yangzijiang would be affected by what STI is doing rather than S&P 500.
That’s why you get the saying…
“A rising tide lifts all boats.”
In essence, if the index is bullish, then chances are the stock will move higher.
So how do you apply the Golden Cross to stock trading?
Simple.
You overlay the Golden Cross to the stock index.
For example:
If a Golden Cross occurs on the S&P 500, then it means you want to be bullish on stocks within the S&P 500 index.
But does the Golden Cross really work?
Check this out…
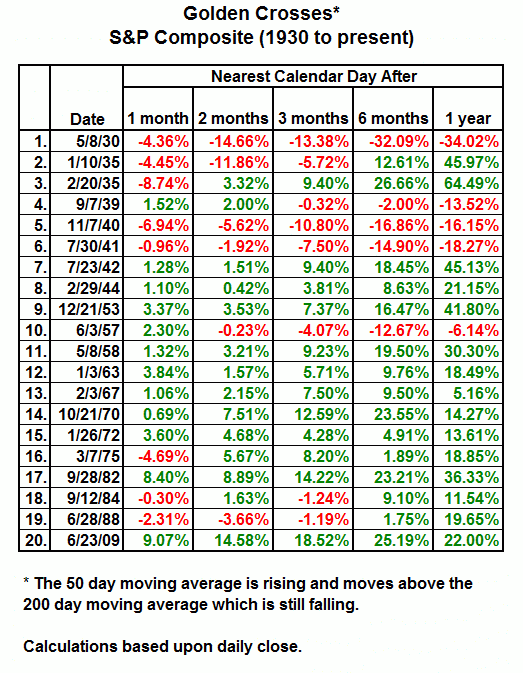
Source: http://ritholtz.com/2012/01/how-bullish-is-the-golden-cross/
This shows the returns after 1 month, 2 months, 3 months, 6 months, and 1 year after the Golden Cross occurs on the S&P.
Clearly, the Golden Cross has a positive bias, and the market is likely to head higher after it occurs.
And in the next section, you’ll learn how to better time your entry when trading the Golden Cross.
Read on…
Golden Cross Trading Strategy: How to better time your entry using this ONE simple technique
Now, you don’t want to go long just because you spot a Golden Cross.
Why?
Because you could be entering when the market is “overextended” — and about to reverse lower.
The solution?
You can use multiple timeframes to better time your entry.
Here’s how it works:
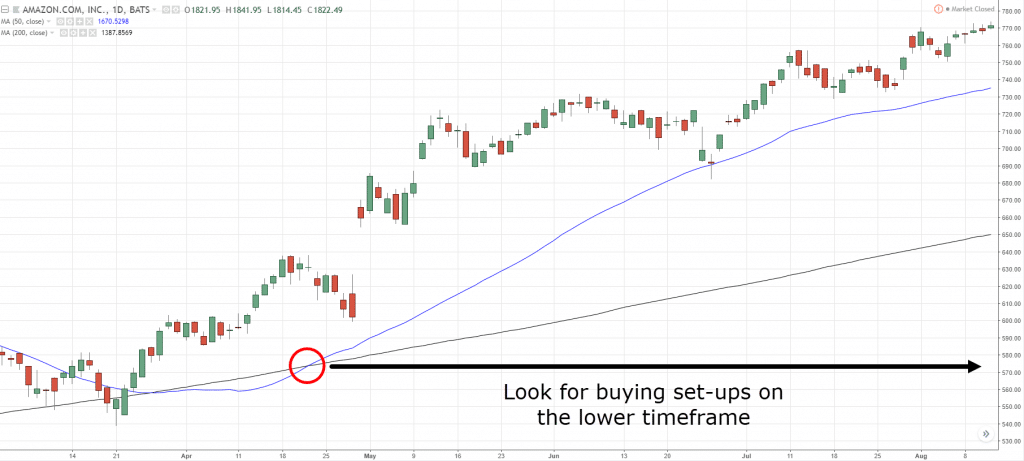
- Identify a Golden Cross on the higher timeframe
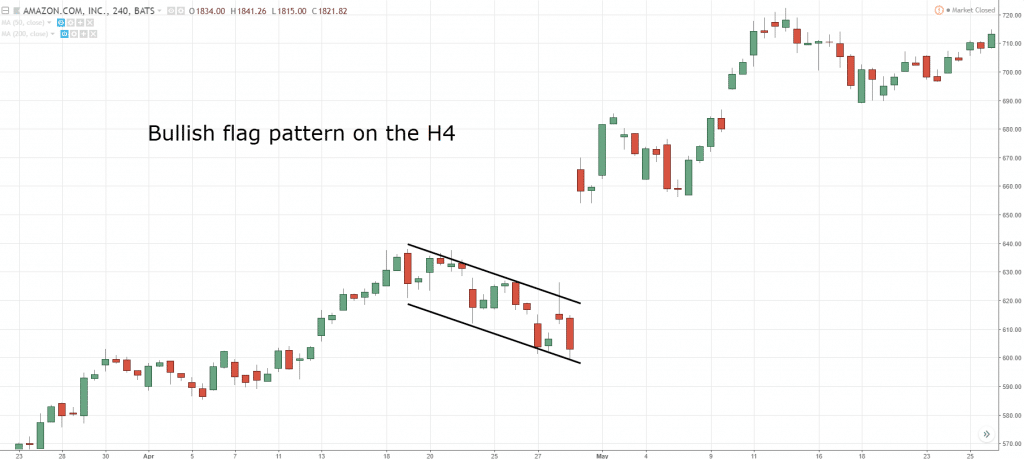
- Look for a trading setup on the lower timeframe (like Ascending Triangle, Bull Flag, etc.)
Here’s an example:
A Golden Cross on Daily timeframe…
A Bull Flag pattern on the 4-hour timeframe…
The beauty of this method is you’ll have a better entry, tighter stop loss and a more favorable risk to reward.
But the downside is you might miss the move if can’t find a valid trading setup.
How to ride MASSIVE trends with the Golden Cross
Here’s a fact:
If you want to ride massive trends in the market, you cannot have a target profit.
Because a target profit limits your profit potential?
It’s like saying…
“Hey Mr. Market, don’t give me too much profits. I’ve had enough.”
Instead…
You must trail your stop loss.
This means as the market moves in your favor, you’ll “lock in” your gains but still give your trade room to breathe — should the price moves further in your favor.
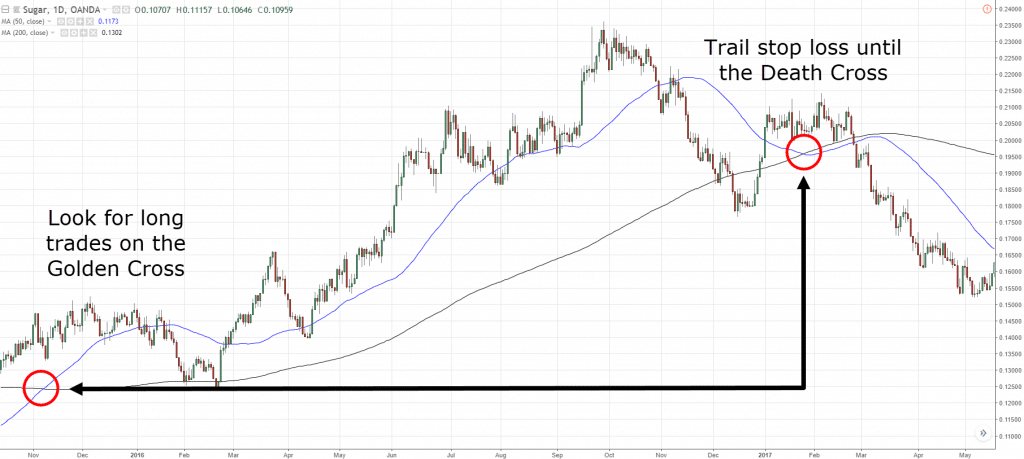
And one way to go about it is using the Golden Cross as a trailing stop loss.
Here’s how…
If you’re in a long trade and the market moves in your favor, then you’ll hold the trade till the 50-day crosses below the 200-day Moving Average.
Here’s what I mean…
Now I’ll be honest.
A trailing stop loss is not easy to execute.
Because often, your winners will become losers as you try to ride the trend — and that’s the price you must pay.
Frequently asked questions
#1: Does the Golden Cross work on lower timeframes like 1-hour or the 15minutes charts?
Yes, the concepts of using the Golden Cross as a trend filter or to trail your stop loss can work on the lower timeframe as well.
However, I would caution against using the Golden Cross to time your entries and exits because you’ll always be one step behind.
#2: Are you using SMA or EMA for the 50 and 200 moving averages? Will the difference affect my trading?
I’m using the EMA for the moving averages.
The difference isn’t much. The only difference is that the EMA is more responsive compared to the SMA. And that’s just my personal preference, there’s no right or wrong style of moving average to use.
#3: How can I know beforehand that the market is in a range so I can avoid getting whipsawed out of my trades when using the Golden Cross strategy (or Golden Crossover strategy)?
You’ll never know ahead of time whether the market is going to be in a range or trending higher, etc.
Conclusion
So, here’s what you’ve learned today:
- A Golden Cross occurs when the 50-day crosses above the 200-day moving average (and vice versa for a Death Cross)
- Be careful of “blindly” trading the Golden Cross because the market can whipsaw you
- You can use the Golden Cross as a trend filter, look to buy only when the 50-day is above the 200-day moving average
- You can ride massive trends with the Golden Cross and exit your trade only when the 50-day crosses below the 200-day moving average
Now over to you…
How do you use the Golden Cross in your trading?
Leave a comment below and share your thoughts with me.


Thanks rayner 🙂
You’re welcome bud!
Thanks Rayner☺️☺️
My pleasure 🙂
Hi Rayner. Thank you for this very simple but very effective strategy. I will go long surely.
Happy trading,
Richard
Let me know how it works out for you, cheers.
Thanks very much Rayner my Golden mentor God bless you
Cheers
Thanks Rayner.
You’re welcome!
thank u so much Rayner
You’re welcome, Ope.
Hi Reyner,
This is superb learning. It will benefit me a lot. Still to learn lot from you,
Thanks
Glad you got value out of it, cheers.
Dear Rayner,
it is a very long term strategy, it applies only if are receiving positive swaps daily.
It’s relative to the timeframe you’re trading. If it’s on the daily, then you’ll ride the trend for a longer period of time.
As for swaps, you need to determine how much negative swap you’ll “tolerate” and still make the trade worth it.
For example, if you lose 0.01R on swaps per day but could ride the trend for 10R over the next 3 months, it will be well worth the trade.
Thanks a lot
cheers
Thanks Rayner. You always provide great information.
I’m glad to be of help!
Thanks Rayner, very good information to always be in favor of the dominant trend
Cheers
Thank you Rayner
Your are great
I appreciate it.
Rayner, you great.
Thanks a million times.
Can you please assist me by sending/alerting me whenever you spot a profitable trade setup on any currency pairs? My telegram/whatsapp line is +2348032599005.
I seriously need such assistance to help me recover from my losses in trading forex.
I don’t offer such a service. And please be careful about sharing personal data online, it’s easy for others to spam you.
I use stochastics with the golden cross
Make sure stochastic is below 20 when X happening for long. Get out when stochastic go above 80.
It works for me.
Thank you for sharing.
Amazing simple golden strategy
Thank you
You’re amazing!
You’re welcome!
Great. Thank you so much.
My pleasure, Archer.
Thank for sharing that with us Rayner. It is very interesting.
Could this also work on the lower timeframes like 1H or 15min?
Hey Sharon
The concept can be applied the same.
Whether you want to use it as a trend filter or ride massive trends. cheers
Ok thank you sir
cheers
Thanks Sir Rayner..
this is very helpful and informative.
Another learnings from you
Awesome to hear that!
Thanks Rayner. As always very informative and helpful.
You’re welcome!
Thk you Rayner (i preferred your videos)
Roger that.
Many thanks Rayner. I’m currently putting together my strategy for swing trading stocks. I really appreciated your comment about using the 50 day above the 200 day as a trend filter. Mate that is pure gold. In a few weeks I’ll start putting my watchlists together and can’t tell you how much direction your insights have given me. Keep up the great work you really keep me on the right track and I suspect many others as well. Enjoy your weekend mate. Cheers from Australia.
Thank you for your kind words, Graham. I appreciate it!
Rayner, you great.
Can you please assist me by sending/alerting me whenever you spot a profitable trade setup on any currency pairs? My telegram/whatsapp line is 919880058083
I seriously need such assistance to help me to learn the forex trading.
I don’t offer such a service and please be careful when posting sensitive information online.
Thank you, Rayner
Your analysis is always in simple language and with lots of illustrations . Keep it up
I will!
Thank you Rayner. You’re really good at making these topics seem so simple, and I appreciate that. Please keep it going!
I will, david!
great my hero master teacher GOD bless you, very long time answer my question golden cross thanks
You’re welcome!
The 50 and 200 moving average is SMA or EMA ?
EMA
Hey Rayner,
Please write one article on stock selection or how to find valid trading setups easily through thousands of stocks.
Thanks,
Jamir
I’ll look into it…
Nice and crisp one. Thanks Rayner.
My pleasure!
Interesting explanation, will enter my list of possible configurations with their respective confirmation. Thank you
My pleasure 🙂
Hi Rayner
Great content as always.
Just wondering if the golden cross can be used for a shorter time frame, ie hourly chart?
I see in the examples given its mainly on daily chart. Would a shorter time frame say hourly chart still be of any use? After seeing a golden cross, then Id try zooming into timing entry say on 15 minute or 5 minute chart.
What are your thoughts?
I’ve not tried it.
But the concept could work.
Would estimate that you are just about a half-step behind the real Superman. You’re a rara avis, and e n o r m o u s l y appreciated. Thank you
Thank you, I appreciate it!
Hi Rayner…just watched this vid on youtube on Golden/Death Cross…interesting!
Thanks Andre!
Is it ok to consider 100 EMA crossing above 200 EMA as Golden Cross and crossing below as Death Cross?
You could do that since the concept is what matters.
Thanx very much for this golden cross
You’re welcome!
Are you using Exponential Mover Average or Simple Moving Average?
I use EMA for the examples…
Am very grateful for this information thanks very much sir
You’re welcome, Samuel!
An excellent explanation, as always! Thanks!
My pleasure!
This really makes sense, but this trailing stop loss is what I don’t get very well. Does it mean you have to be scalping the market?
Nope. It means you shift your stops higher as the market moves in your favor.
So you “lock” in profits and still give the market a chance to trend higher, thereby riding the trend.
This is a fantastic Rayner. Just one question. Can I plot the 50 and 200 on 4hrs chart and take trades on the 1hr and 15mins chart in the direction of the golden cross on the 4hr time frame? OR must it be plotted on the daily chart? which do you think is more reliable and more profitable. Am a swing trader but sometimes I will like to day trade. thanks, cheers.
Both timeframes are fine.
But the 4-hour would be more relevant to entries on the 1-hour and 15mins timeframe.
Great question.
Thanks Rayner. Very good explanation.
You’re welcome!
Thank you sir. You are a star. Go Bless u
Cheers
Very useful article
Can we use golden crossover on 15 min time frame
Good work
Cheers
ya Rayner, I am using this strategy for last 2 years , although it works well, but only when you got your trend directions cleared
Thanks
Cheers
Thanks it was helpful
Hey Omo,
Thank you!
Thank you Rayner. I have been reading your write-ups.
Please can you give out the setup for the golden cross signal. Thank you.
Thanks Rayner. This GC happened to one of my stock trade before. I had a quick decision to take profit when a gap up occurred after a few days of GC, then a whipsaw followed. =)
Excellent presentation.
Thank you, Nurul.
I have learnt a lot from you! as a student i cant afford expensive courses, you teach premium stuff
Great knowledge quotient . Learned a lot from you
Thank you very much for sharing some premium knowledge to the mass for free which was only available to select people earlier.
Hi Pramukh,
You are most welcome!
Much appreciated Rayner.Can I use lesser golden cross for 1hr time frame like 13 and 20 instead of 50 and 200..Please tell me the exact golden cross to use since I trade on 1hr .Thanks
Hello Rayner!! im your subscriber in youtube, I only want to ask if all the lesson you give applicable in cryptotrading? Tnx!
Hi Jin,
It’s more of price action. Do some backtesting
Cheers…
Thanks a lot Rayner…learning a lot from your posts and videos…You are giving away lot of valuable knowledge free of cost…for which I guess, most others would charge huge money…..
Hi Murthy,
You are most welcome!
Cheers…
At times , trailing Stop loss gets hit and we are out of trend catching Rayner. What to do then?
Hi Riju,
When trailing your stop loss, allow some pips to breathe.
Price can be very unpredictable. Don’t leave it an area of value.
Cheers.
Thanks Rayner…..this is definitely enlightening
Hi Temitope,
I’m so glad to hear that!
Cheers.
I’m getting so much techniques for trading from your content, thanks you so much Sir for sharing to me. Hope I will be in touch with your guides for long.
Hi Yam,
You are welcome!
love u bro no homo
Hi Rayner! So I want to ask about when you said “You’ll never know ahead of time whether a market will be in a range.” I remember reading somewhere that incorporating volume-based indicators and Hybrid leading indicators would allow one to see how weak a position is and they wouldn’t get whiplashed. (Admittedly, I don’t know what a hybrid leading indicator is). What’s your take on this?
Hi Akash,
When it comes to the market we are always dealing with probabilities.
Cheers.
I would Identify the golden cross setup on the 4h timeframe, scale down to 30mins tf for a flag or retracement to find entries… Trail stops along the way until a reversal occurs on the 4h to stop the minor trend move
Good Morning my friend Rayner. What I like about the golden cross is that it helps me to stay discipline. Now I only wait for the right time to enter. Now I only look for buy opportunities when the 50MA has crossed above the 200MA. Thanks so much my friend.
You are welcome, Bernard!
Your trading lessons help me so much! Thank you, Rayner!
Thank you, Haosha!
hi……
I’m ,Mohammed uwaish from India
some times golden cross failure and hit stop loss but I follow the rules that teahed by you where any other strategy to win this golden cross pls,,,,.
Hi Mohammed,
You should put into consideration the timeframe from which you are trading off the Golden Cross.
Check this video out.
https://youtu.be/6mckJdktXkc
Cheers.
Hi Rayner. I’d like to ask you about the MA, which one to use? Is it simple MA (SMA) or exponential MA (EMA)? What about double/triple EMA (DEMA/TEMA)? Thanks.
hi Max!
I’m using the EMA for the moving averages.
The difference isn’t much. The only difference is that the EMA is more responsive compared to the SMA. And that’s just my personal preference, there’s no right or wrong style of moving average to use. Hope it helps!
Thanks so much for your reply, really appreciate it
You’re welcome, Max!
Thanks for this remarkable lesson. I really learnt much
Thanks for this remarkable lesson. I really learnt much from this…
We’re glad you learn something from it!