What is a Triple Top Chart Pattern and how does it work?
Now you might be wondering…
“Is the Triple Top bullish or bearish chart pattern?”
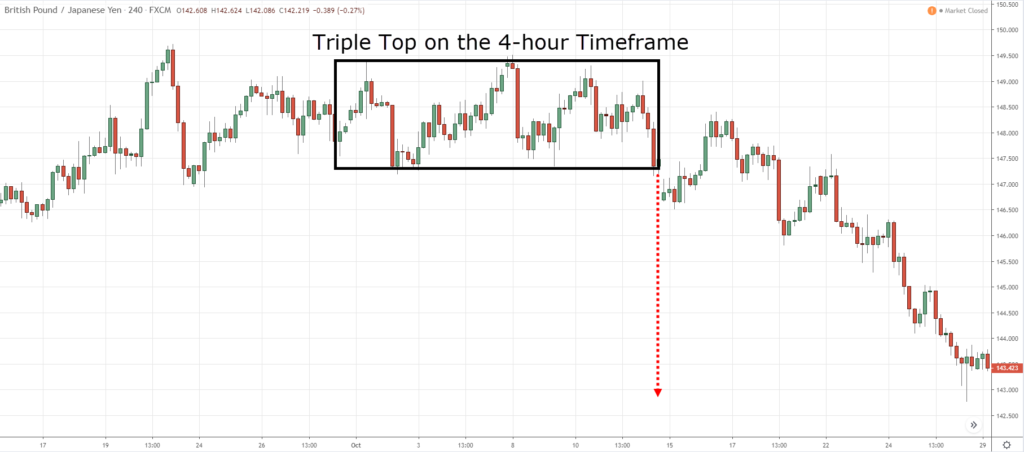
A Triple Top is a bearish reversal chart pattern that signals the sellers are in control (the opposite is called a Triple Bottom pattern).
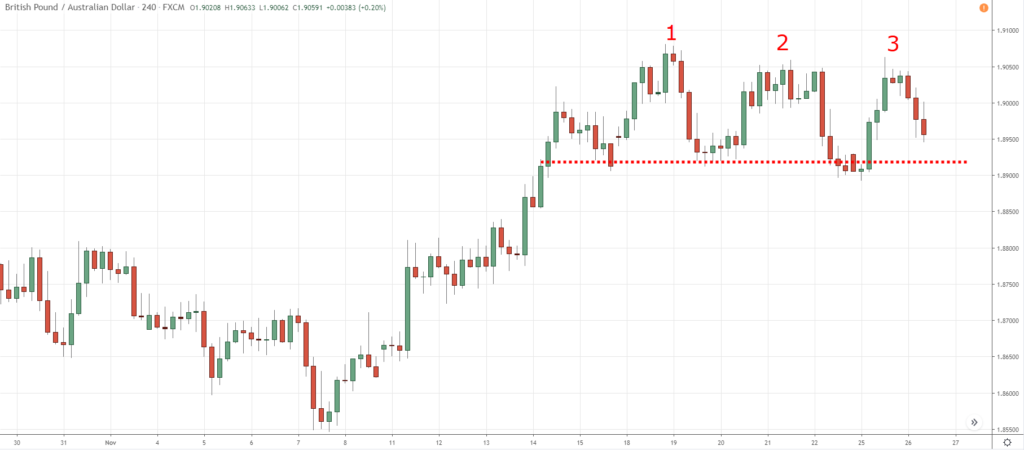
Here’s how it looks like…
Let me explain…
#1: Buyers are in control as the price makes a higher high, followed by a pullback.
#2: The first sign of selling pressure appears as the price fails to break out of the prior high. At this point, the market makes a pullback and forms a consolidation.
#3: Again, the market attempts to break out higher and fails, again. The 3 “spikes” are visible after 3 failed attempts to break out.
#4: The price breaks below the lows of the consolidation and the Triple Top Chart Pattern is completed.
You’re probably thinking…
“That’s easy! Let’s hunt for some Triple Top patterns and short the markets baby!”
Well, not so fast my young padawan…
Mistakes to avoid when trading the Triple Top chart pattern
Yes, the Triple Top chart pattern signals the sellers are in control, but it doesn’t mean you want to sell immediately.
Here’s why…
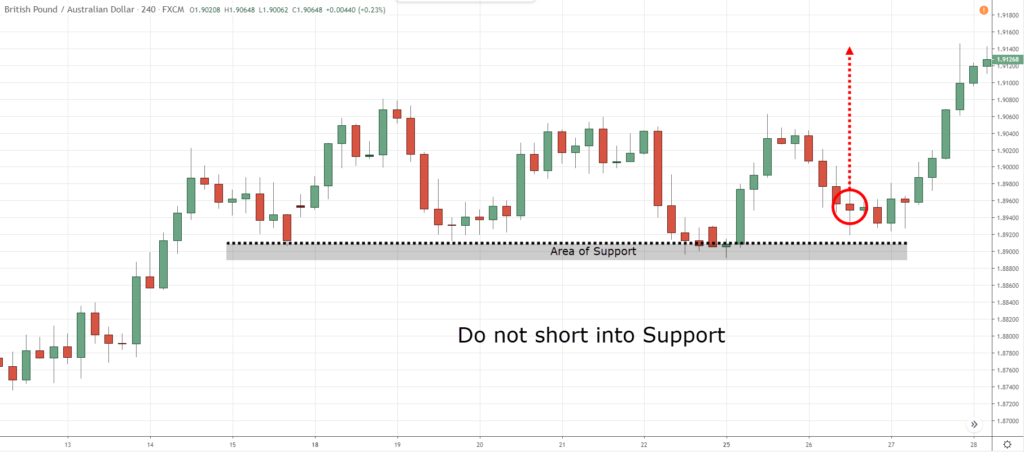
Mistake #1: When the pattern is obvious, it’s too late to enter
Here’s the deal:
When the Triple Top pattern looks obvious on the charts, it’s too late to short the markets.
Why?
Because you’ll likely short into an area of Support where potential buying pressure could push the price higher.
This means you’re selling when buyers are about to step into the markets — not a good idea.
Here’s what I mean…
Next…
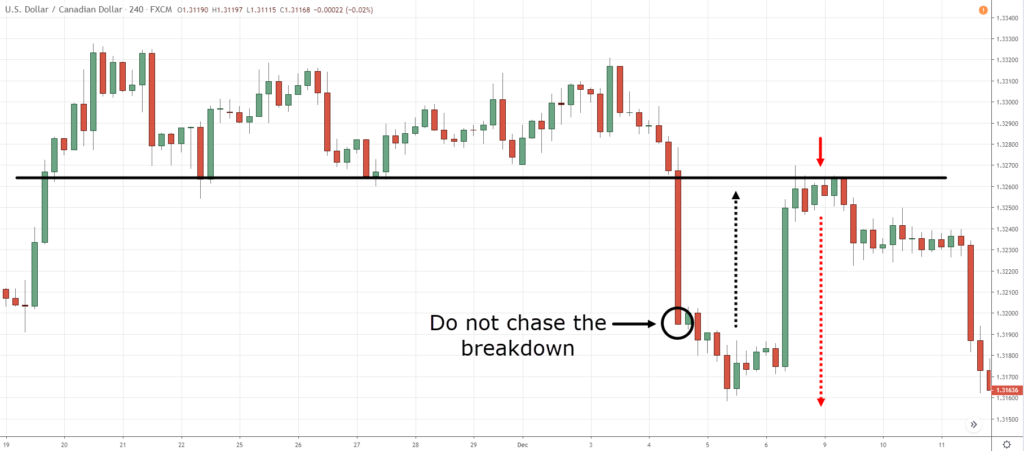
Mistake #2: Chasing the breakdown
Okay, you might be thinking:
“Well, I’ll wait for the break of Support before shorting the markets.”
In theory, that sounds great.
But…
By the time Support breaks, the market has moved lower to a point where it’s about to make a pullback higher.
And if you chase the markets lower, you’ll likely get stopped out on a pullback.
Here’s a Triple Top forex example…
Now, you can’t trade the Triple Top chart pattern when it’s obvious, and you don’t want to chase the market when it breaks below Support.
So, how should you trade this chart pattern?
That’s what you’re about to discover them right now…
How to trade the Triple Top chart pattern (4 entry techniques that work)
Now here are 4 techniques you can use to trade the Triple Top pattern…
- False Break
- Buildup
- First Pullback
- Breakout Re-test
Let me explain…
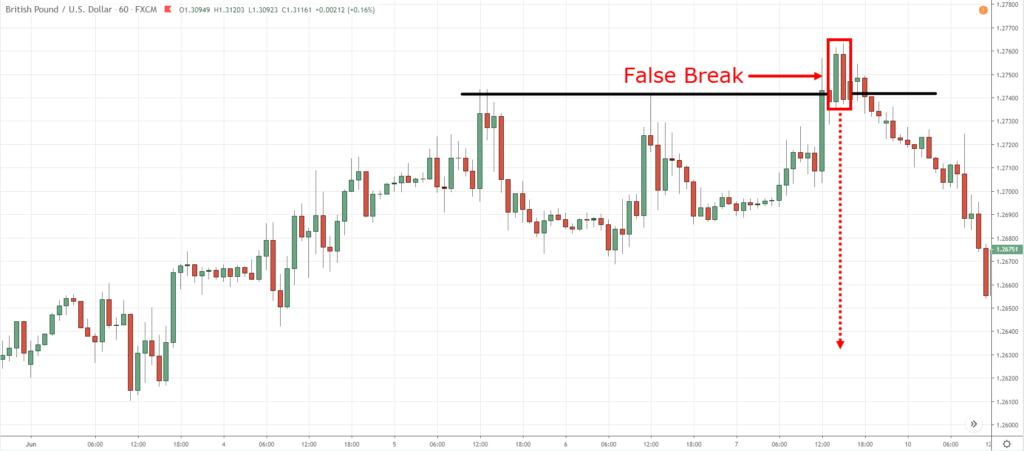
#1 The False Break
The False Break is the earliest timing to short the Triple Top pattern. Here’s how…
You want to pay attention as the price attempts to break out of Resistance for the 3rd time.
If it fails, that’s when a False Break occurs and the market could possibly re-test the lows of Support.
An example:
Your entry can be on the next candle’s open and stop loss 1 ATR above the highs of the False Break setup. Next…
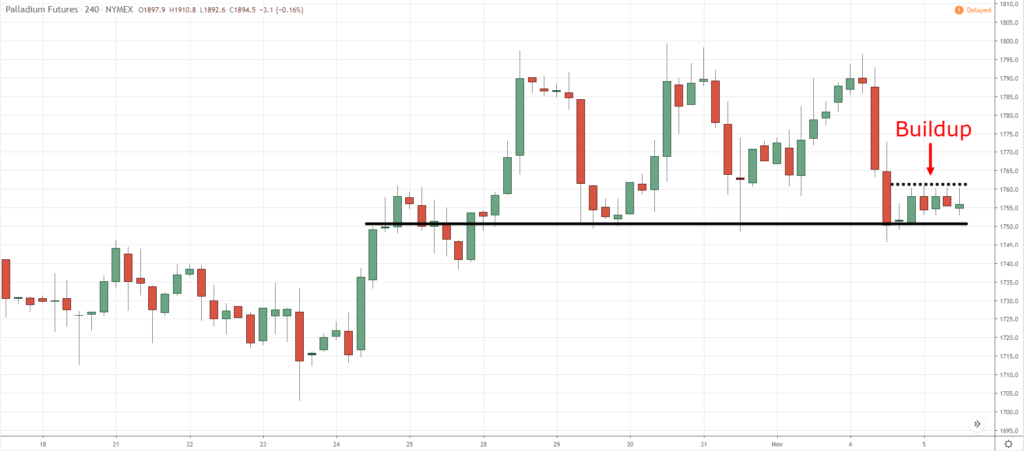
#2 The Buildup
Recall:
When the Triple Top pattern looks obvious, it’s too late to short the markets as the price is near the lows of the consolidation (or Support), and it could reverse higher.
So what you want to do is, look for signs that buying pressure is getting weak, and then short the breakdown of Support.
And one way to tell is to look for a Buildup at Support.
Here’s what I mean…
Now you’re probably wondering:
“But why wait for a Buildup?”
Here’s why…
1. Tighter stop loss which improves your risk to reward
When a Buildup is formed, you can set your stop loss just above the highs of the Buildup which offers you a more favourable risk to reward on your trade (instead of the highs of the Triple Top pattern).
2. Higher probability of a breakdown
The lows of the Buildup attract sell stop orders from traders who are long. So, if the price breaks below the lows of the Buildup, it increases selling pressure which leads to a decline in price.
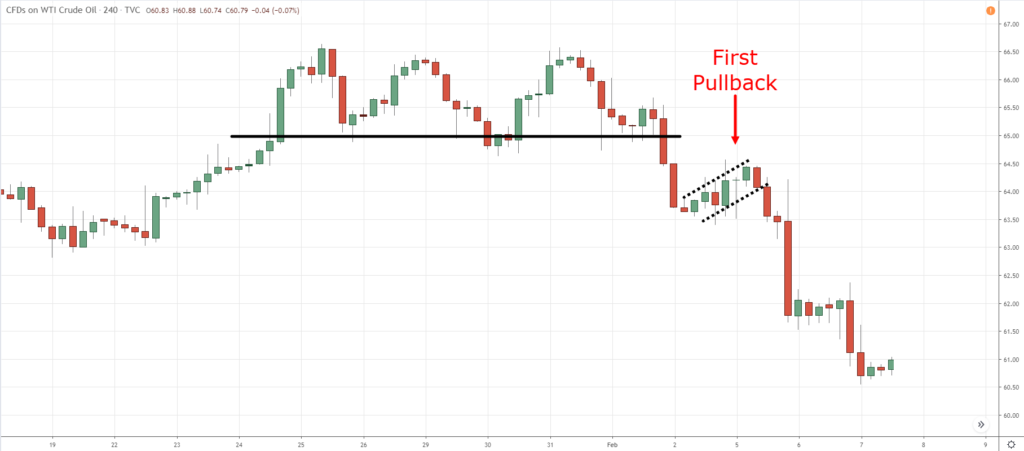
#3 The First Pullback
Now, there are times the market breaks down quickly after forming a Triple Top chart pattern and you’re not fast enough to catch move.
So, what now?
Firstly, you don’t want to chase the market lower because there’s no logical place to set your stop loss. Also, this is where the market is ready to make a pullback or a reversal.
Instead…
You want to trade the first pullback that occurs.
The pullback is usually shallow with small ranged candles (also known as a Bear Flag pattern).
Here’s a Triple Top forex example to trade the first pullback…
But why the First Pullback?
1.When a pullback occurs, it gives you a logical level to set your stop loss. For example, your stop loss can go above the highs of the pullback (instead of the highs of the Triple Top pattern).
2. Many traders would miss the breakdown of Support. So, the First Pullback offers them a low-risk opportunity to catch the next wave of the move.
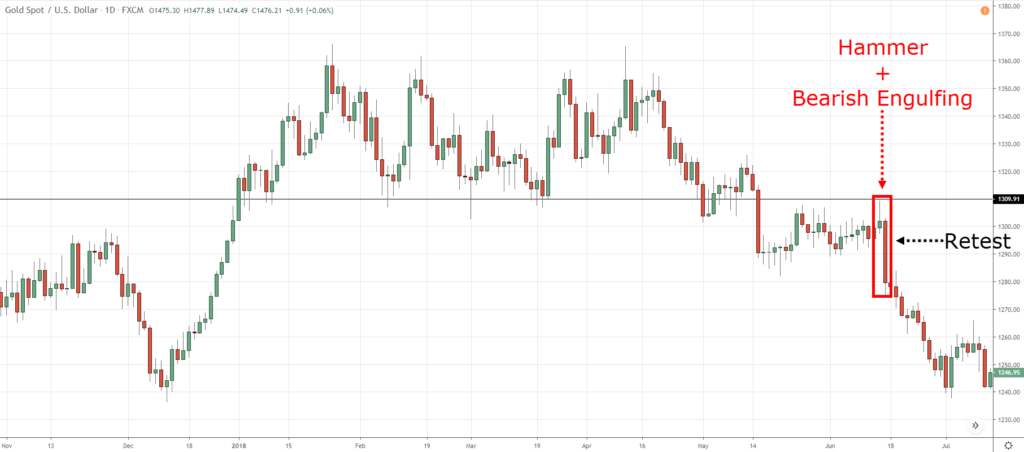
#4 The Breakout Re-test
But what if the pullback goes much deeper?
Then you want to avoid shorting the breakdown because your stop loss is too wide (and the low of the pullback is where buying pressure is lurking which is not a good thing).
However, you can trade the Break-out Re-test. Here’s how it works…
- Wait for the price to re-test the breakout level (where previous Support becomes Resistance)
- Let the market show weakness at this area (you’ll see patterns like Bearish Engulfing, Shooting Star, etc.)
- If weakness is shown, then go short on the next candle’s open
Here’s an example…
At this point:
You’ve learned 4 techniques to trade the Triple Top chart pattern.
The False Break and Buildup can be used before the breakdown. The First Pullback and Breakout Re-test allow you to catch a piece of the move after the breakdown.
Moving on…
How to tell when the Triple Top chart pattern will fail?
I’ll be honest.
No patterns, strategies, or techniques work all the time — this includes the Triple Top pattern.
The good news is, before the Triple Top pattern fails, there are usually clues given by the market.
I’ll explain…
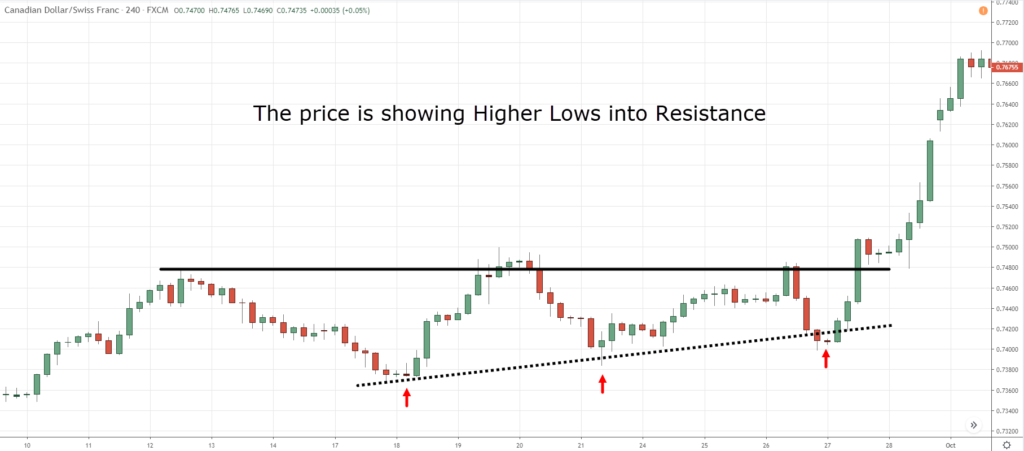
Higher lows into Resistance
When you spot higher lows coming into Resistance (also known as Ascending Triangle), this is a sign of strength as it tells you the buyers are willing to buy at higher prices.
And if the price trades above Resistance, it’ll trigger a cluster of stop orders (from breakout traders and short traders who got stopped out of their trade) and this leads to more buying pressure.
Here’s what I mean…
Next…
The higher timeframe is in an uptrend
This is straightforward.
If the higher timeframe is in an uptrend, then the Triple Top pattern is likely to fail (on the lower timeframe).
Here’s an example:
If there’s a Triple Top pattern on the Daily timeframe, but on the Weekly, it’s in an uptrend — then the market is likely to continue higher.
Make sense?
Bonus: How to identify high probability Triple Top chart patterns and profit from the selloff
This is a trick you can use to trade any reversal chart patterns.
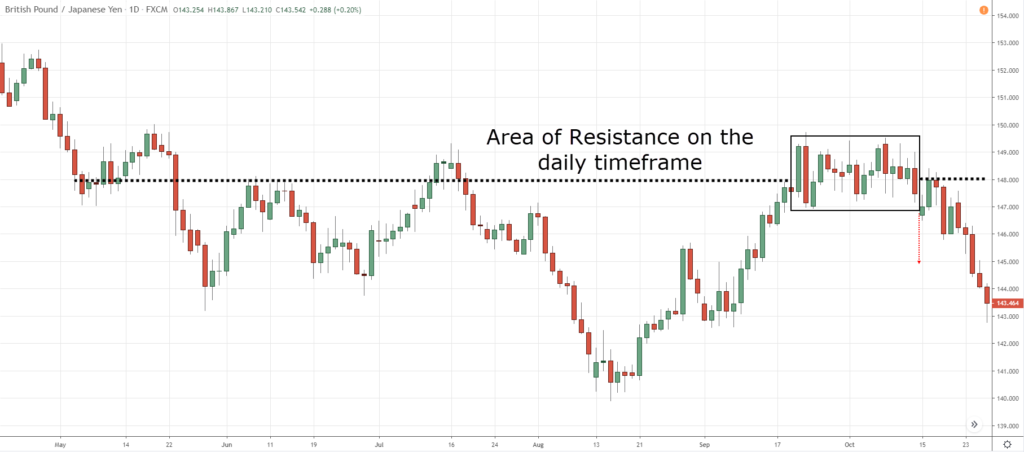
The key here is to have the Triple Top pattern lean against a higher timeframe Resistance.
Here’s an example…
When you look at the higher timeframe, do you notice it’s formed at Resistance area?
This increases the probability of your short trade as selling pressure from the higher timeframe is working in your favour.
Then, you can use any of the 4 entry techniques you’ve learned earlier to short the market.
Cool?
Summary
Here’s what you’ve learned today:
- A Triple Top is a bearish reversal chart pattern that signals the sellers are in control (the opposite is the Triple Bottom pattern)
- It’s not a good idea to short a Triple Top pattern when it’s obvious as you’re likely coming into an area of Support
- Don’t chase the breakdown of a Triple Top pattern as the market is likely to make a pullback
- There are 4 ways to trade the Triple Top pattern: The False Break, Buildup, First Pullback, and Breakout Re-test
- Beware of shorting Triple Top chart patterns when the higher timeframe is in an uptrend, or the price forms higher lows into Resistance
(For the Triple Bottom pattern, you can simply do the opposite of what I’ve shared for the Triple Top pattern.)
Now here’s what I’d like to know…
How do you trade the Triple Top chart pattern?
Leave a comment below and share your thoughts with me.


The trible top trading pattern gives deep insight in the trading strategy. If the content is fully assimilated ,there no doubt that the trading success will be obviously achieved
I love this so much thanks
I hope it helps, cheers.
Please how can I join your signal group and what is the cost?
I don’t have a signal service.
Great job
Cheers Paul
Hey Ray !!!
Can you pls suggest …how much pull back one should wait for ? Any fib level , or number of candles ?
I don’t have a definite answer to it as it’s not an exact science.
But I do look for a pullback towards 20ma or previous support turned resistance.
This info is awesome and the charts are what makes it easier to understand.
Glad to help out!
Thank you for all your help.
Anytime!
Easy to remember the way you explain and visual charts Well done with the Rayner magic talks
Cheers
Cheers
am a beginner n getting this right..am looking forward to learn more from you
Welcome on board!
Rayner you too much,you are the best, very simple to understand and comprehend I to get more useful from you and remain blessed.
Cheers
What can you say about Elliot waves and Harmonic pattern Sir Rayner? is it reliable when combined with your price action strat? Thank you so much sir. Huge fan from Philippines, I’ve been sharing your lessons with my buddies here.
I haven’t found much success with it, but that’s just me.
Thank you sir. I’ll be studying all your stuffs here and use as my trading strategy. Godbless Sir Rayner!
nice.
does the opposite of this (triple bottom) apply to long positioning?i mean can we use the same principles (but in reverse) when we want to go long?
Yes, the triple bottom is just the opposite of triple top.