#1: How to Use Multiple Timeframes
Lesson 1
Hey hey, what's up my friends!
In today's post it's all about understanding multiple timeframe analysis.
Imagine this…
Have you ever, entered off the 1-hour timeframe.
You find a setup on the 1-hour time frame.
And then you think to yourself, "What is the higher timeframe doing?"
Then you start to look at the higher timeframe.
You look at the monthly, the weekly, the daily, you look everything, and you get confused!
You start to doubt your own trading setup on the 1-hour time frame and then you simply don't trade.
Because you have no idea what a higher time frame is doing!
Should you be looking at the monthly, the weekly, the daily, the 4-hour, the 2-hour, what should you be looking at?
I think this is an issue that a lot of traders can’t fix.
In today's video post I will basically break it down for you, and explain to you how to actually define your higher timeframe based on your entry timeframe!
What are multiple timeframes
Let me explain to you in a very layman manner.
Multiple timeframes allow you to put on a pair of lenses to see or zoom in to see what price is currently doing right now.
As well as to put on another pair of lenses to zoom out and see what price is doing in the big picture.
This is basically what multiple timeframes allow you to do.
You can zoom in to see what is the current price action of the market or can zoom out to see what is it doing over the last few months, or the last few years.
All this can be achieved using multiple timeframes.
Just to walk you through to understand how the candles actually form on the different timeframes.
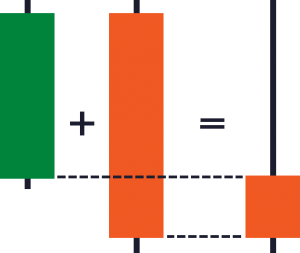
Let's say on the 1-hour chart you can have two candles.
I'm just going to walk you through a very simple example:
The first candle is a bullish candle, it opened on the lows and closed above.
The second bearish candle opened on the highs and closed on the lows.
Now you have two 1-hour candles.
We can combine these two and make it a 2-hour candle, which will look something like a bearish pin bar.
Which is a 2-hour candle.
The 2-hour basically encompass the price action of the first candle and the second candle.
Does that make sense?
I hope now you understand how the candles on the higher timeframe come about.
It's all based on the candle structure or rather the price on the lower timeframe!
If you're unclear, just take some time to digest this piece of information, and to be honest, it took me pretty much a long time to figure this concept out.
I'm a pretty slow learner, to be honest.
Let's move on…
How to select your timeframe to trade
This is an important aspect of trading.
Often, I've seen traders tell me, "Hey Rayner, I'm looking to enter off the five minutes timeframe."
I ask them, "Okay, so which timeframe are you looking at as your higher time frame?"
They say, "Oh, I'm looking at a daily timeframe."
Then to me, that doesn't really make sense, because if you are entering off the five minutes timeframe, then the daily timeframe to you is noise because it's too far away!
You're trading right now, in the now!
But you're looking at the big picture as a higher timeframe.
That is pretty much irrelevant!
Similarly, if you are looking to enter off the say the weekly time frame, and you go down to a lower timeframe to find an entry.
Let's say you go down to the 1-hour timeframe.
Again...
It doesn't make sense!
Because the weekly time timeframe is way too far away from your entry timeframe, which is the 1-hour timeframe.
Now the question is, “Rayner, how do you find the right balance between your entry timeframe and the higher timeframe?”
Let me share with you a technique on how you can actually go about finding the right balance.
It's what I call a factor of four to six.
This is something that I didn't come up with.
I read it from Alexander Elder and he shared this technique that he used to actually classify his timeframes.
Let me explain…
The factor of 4 to 6
Let's say you're entering off the 1-hour timeframe.
A factor of four would be the 4-hour timeframe!
One multiplied by four, it gives you four.
A factor of 6 would then be the 6-hour timeframe.
Needless to say, if you're entering off the 1-hour chart, then the 4-hour timeframe can be your higher timeframe.
Or the 6-hour timeframe can be your higher timeframe or even a 5-hour timeframe can be your higher timeframe.
Because anywhere from a factor of 4 to 6.
This is how you go about selecting your higher timeframe.
Before you can actually select your higher timeframe, you must know which is a timeframe that you want to enter off...
In other words, what is your entry timeframe?
Once you have defined your entry timeframe.
Then, you can define your higher timeframe!
Here are a few examples for you to look at an entry timeframe and higher timeframe:
- 15 mins and 1-hour
- 1-hour and 4-hour
- 4-hour and Daily
I hope you get the concept of the factor of 4 to 6 in selecting your higher timeframe.
I hope this basically clears up on how to go about selecting your higher timeframe.
Don't tell me that you're entering off the 5-minutes timeframe and you trade off the daily timeframe.
That doesn't really make sense.
It's way too far apart.
You need to find the right balance and the right balance is using a factor of 4 to 6.
Let's move on…
What you should focus on
Now that you know what is your higher timeframe, what is the thing that you should focus on the higher timeframe?
You don't focus everything on a higher timeframe rather, you need to look at the current swing on the higher timeframe.
You want to trade with the current swing on the higher timeframe.
What do I mean by this?
Let me explain…
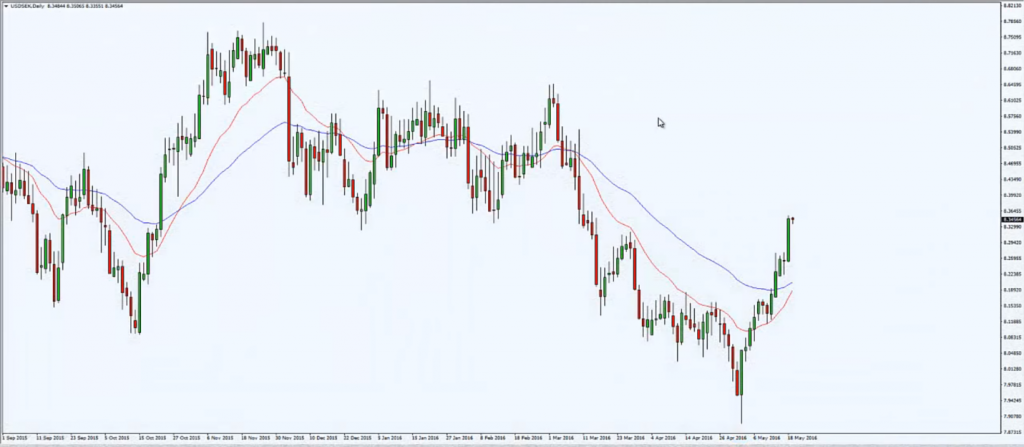
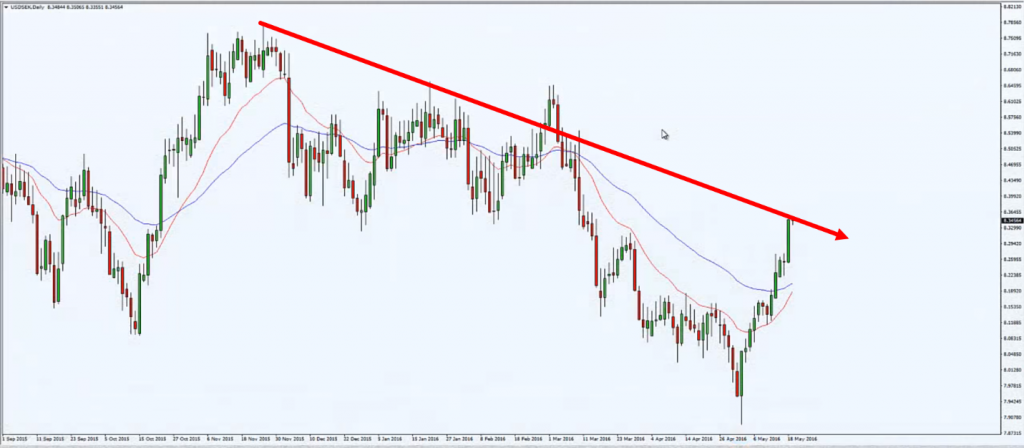
For example, you are looking at this chart over here:
This is the higher timeframe of USD/SEK.
You'll note price that price is looking not too good.
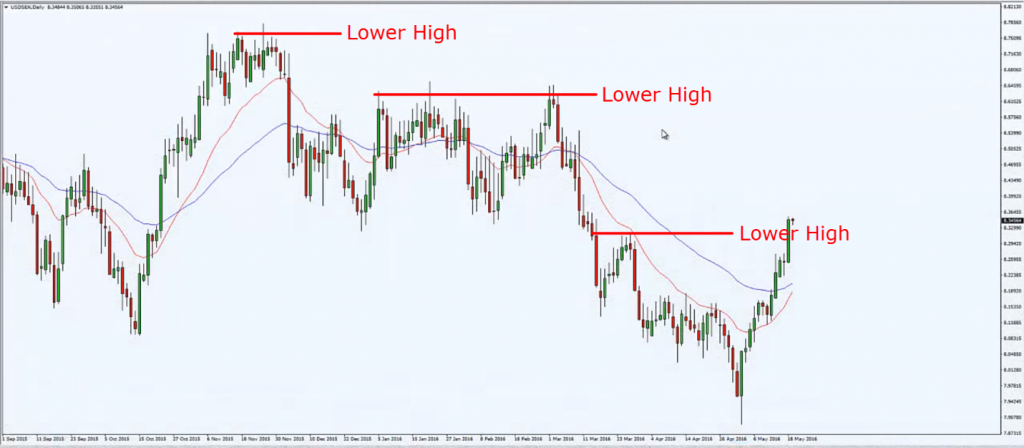
Maybe you'll say it's a long-term down trend because you have lower highs:
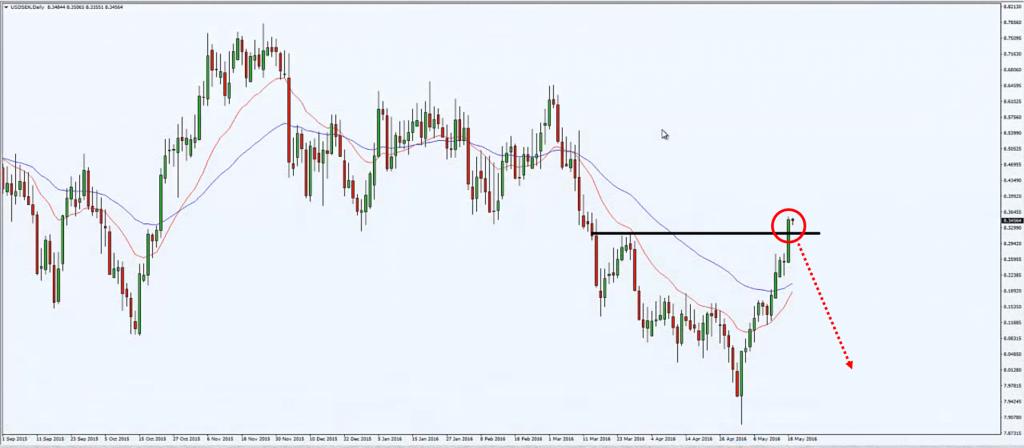
Or maybe the price just retested and swing high over here:
You're still not looking too good, because if we draw a long-term trend line...
It's still pointing lower:
What you'll think is, "Okay, maybe I should be looking to short."
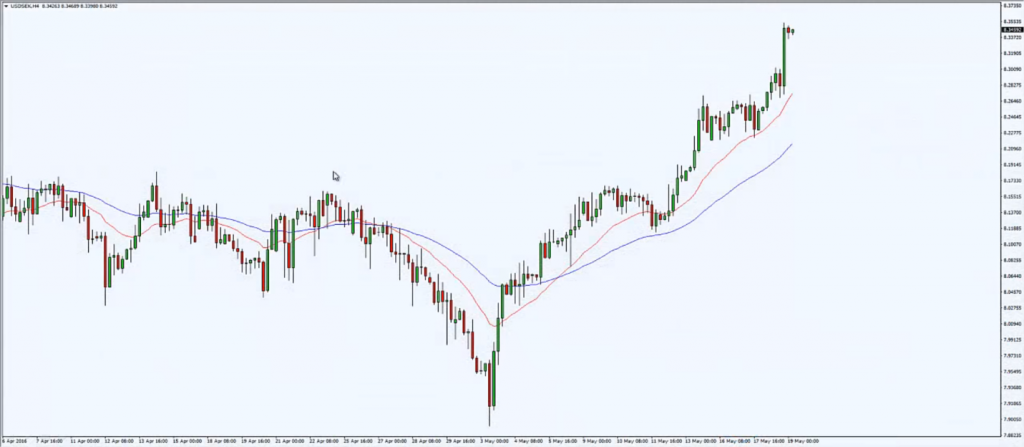
But when you go down to the lower timeframe or rather your entry timeframe, you see this:
Price doesn't look bearish at all, it looks pretty bullish.
Why is that?
Well, remember what I said earlier.
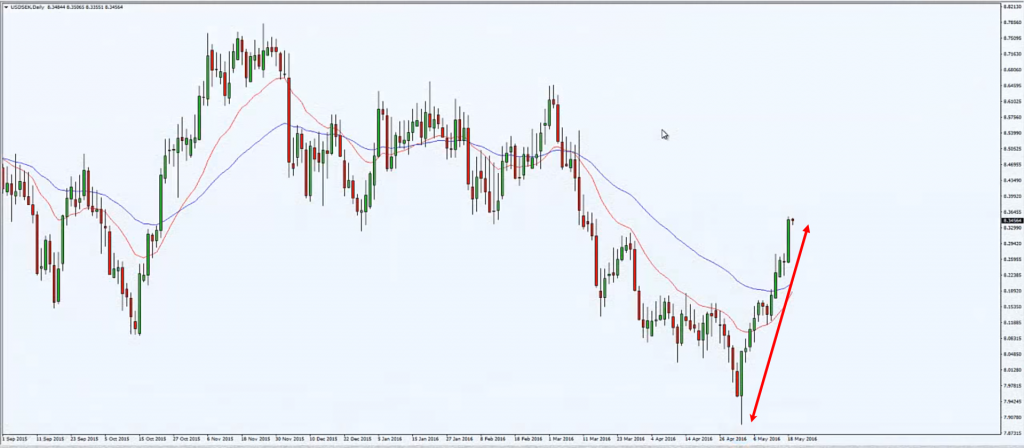
I said that you want to trade with the current swing on the higher timeframe.
The current swing on the higher timeframe is this portion over here:
This is the portion that you want to focus on.
What is this portion doing?
Is it bullish, bearish, or flat?
It's bullish, right?
If it's bullish then on your lower timeframe, you want to be long.
Imagine if you're looking to go short just because you saw that the higher timeframe is looking long-term bearish, and you're looking to go short on the lower timeframe.
Chances are you're going to get stopped out repeatedly over time.
Because you are going counter-trend on your current timeframe.
So, you want to focus on the current swing on the higher timeframe.
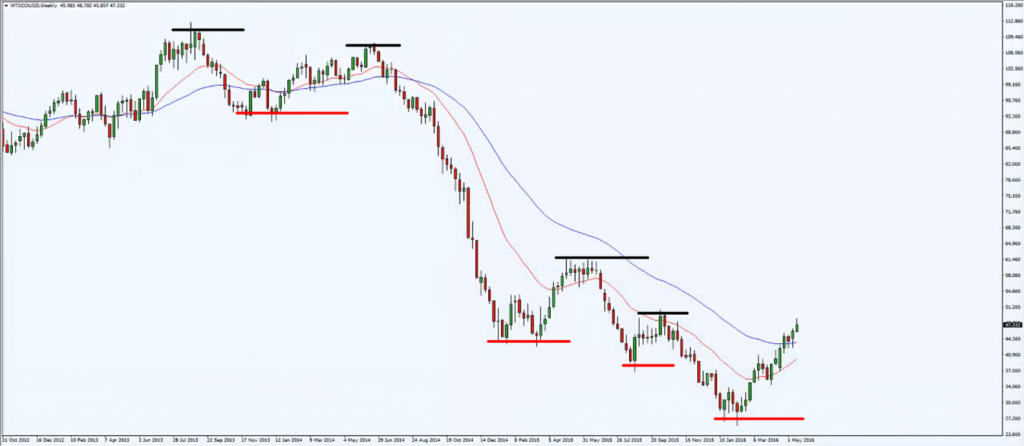
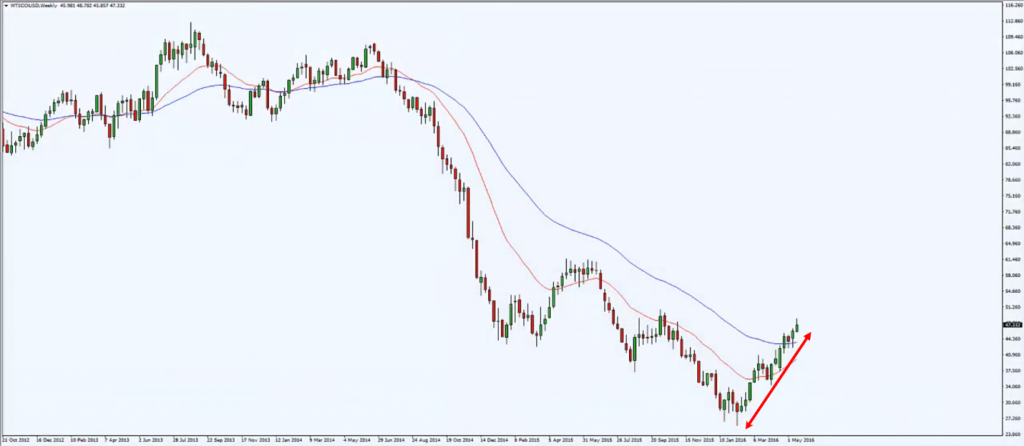
Another example you see over here:
If you look at this chart, I would agree with you, it looks bearish.
You have a series of lower highs and lower lows.
But again, you are not trading the higher timeframe.
You are trading on your entry timeframe.
If you are looking off the higher timeframe, you really want to focus on one thing.
What is the current swing on the higher timeframe?
If you ask me, the current swing on this timeframe is basically this portion over here:
This is the current swing.
What is this current swing doing?
Is it bullish, bearish, or flat?
It's bullish.
The current swing right now is bullish.
What should you be looking for in the lower timeframe or rather your entry timeframe?
You will be looking for longs because on the higher timeframe the current swing is bullish.
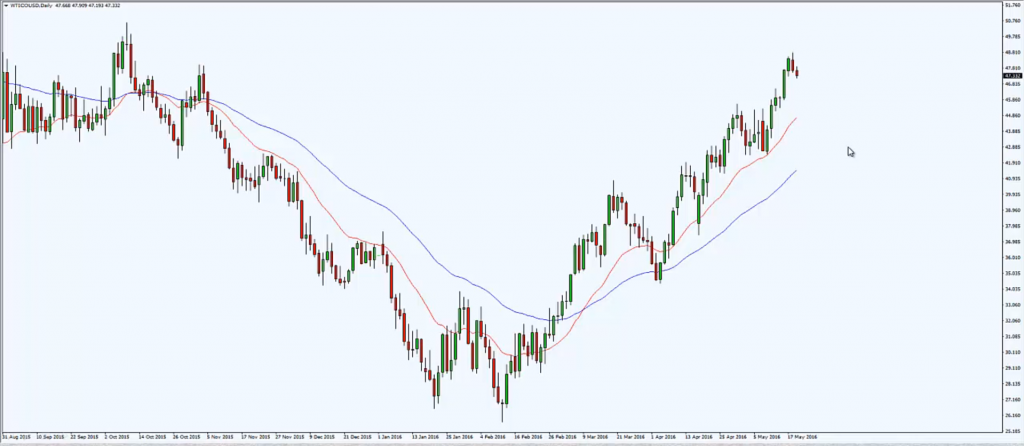
You go down to your entry timeframe:
It is looking bullish.
You're looking for a long setup over here.
So, let's do a quick recap of what you've learned today…
Recap
- What is multiple timeframe analysis and how we actually combined the different candles on the lower timeframes and form a new higher timeframe candle.
- How to use a factor of 4 to 6 to actually define your entry timeframe in higher timeframes.
- Why you need to focus on the current swing on the higher timeframe. You should focus on the higher timeframe is to look at what the current swing is doing.

