The Doji is one of the most misunderstood candlestick patterns.
For example:
1. Do you know there are 4 types of Doji and each has a different meaning to it? (Most traders never figure this out)
2. The most textbook teaches you that a Doji represents indecision in the markets. But do you know it can also “alert” you when the market is about to reverse?
3. Depending on the length of the Doji, it could tell you what the market is likely to do in the near future (this is important)…
Now, don’t worry if you don’t have the answers to these questions with regard to the doji pattern.
Because in this post, I’ll reveal the answers and teach you everything I know about the Doji candlestick pattern — so you can finally trade it like a pro.
Or if you prefer, you can watch this training video below…
What is a Doji and how does it work?
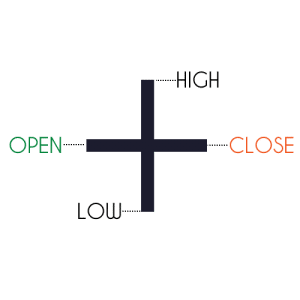
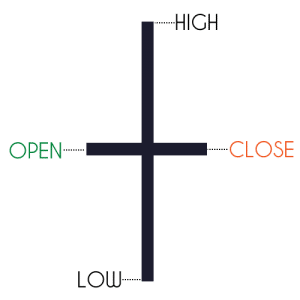
A Doji occurs when the market opens and closes at the same price level.
It means the market is undecided as neither buyers nor sellers are in control.
However, there are variations of Doji with a different meaning to each of them (which I’ll cover later).
For now, here’s how a standard Doji looks like:
On its own, a Doji is a neutral candlestick pattern.
But, if you take it into context with the earlier price action, you’ll have a sense of what the market is likely to do with the doji pattern.
For example:
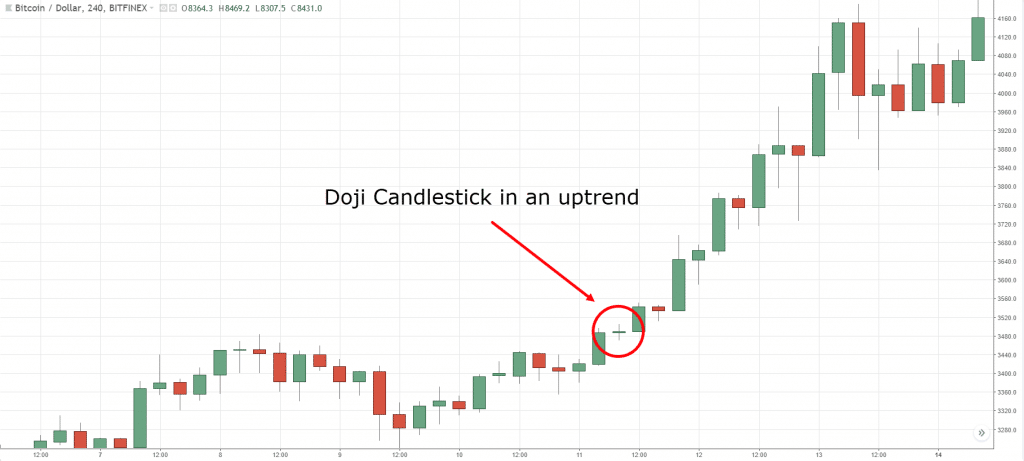
If you spot a Doji in an uptrend, it means the market is temporarily in equilibrium.
Once it “rested” enough, the market is likely to move higher since that’s the path of least resistance.
Here’s what I mean:
But don’t make this mistake…
Here’s the thing:
Most traders spot a Doji in an uptrend and think…
“The trend is about to reverse, time to go short on this doji candle!”
Bad idea.
Why?
Think about it.
A trend is made up of prices that have been moving higher.
How likely is it to “lose” against an individual pattern, like a Doji?
Rome was not built in a day, and no real movement of importance ends in one day or in one week. It takes time for it to run its logical course.–Jesse Livermore
Moving on:
In the next section, you’ll another type of Doji that signals the market is about to bottom out.
Read on…
Dragonfly Doji: How to tell when the market is about to bottom out…
Before I continue, you must know that…
Despite the dragonfly doji being the standard doji candlestick, you’ll rarely get an ideal Dragonfly Doji where the price closes exactly where it opened.
Instead, you’ll get a variation that has a small body with a long lower wick — and the meaning is the same.
What’s important is not to memorize the pattern but understand the meaning behind it.
If you do, you’ll never have to memorize a single candlestick pattern again.
Moving on…
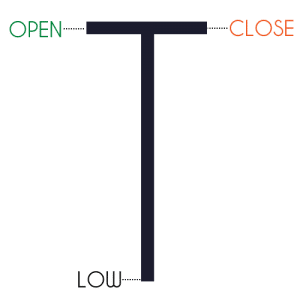
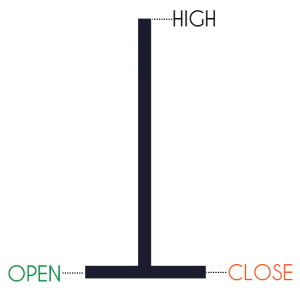
A Dragonfly Doji occurs when the opening and closing price is at the same level but, with a long lower wick.
It’s a bullish Doji and here’s how it looks like:
This tells you when the market opens, sellers came in and pushed the price lower.
However, it’s not long before the buyers took control and fought their way back higher.
And finally, the market closed at the same price where it opened.
This is a sign of strength as the buyers are in control.
And here’s how you can trade the Dragonfly Doji…
How to trade the Dragonfly Doji in a range market
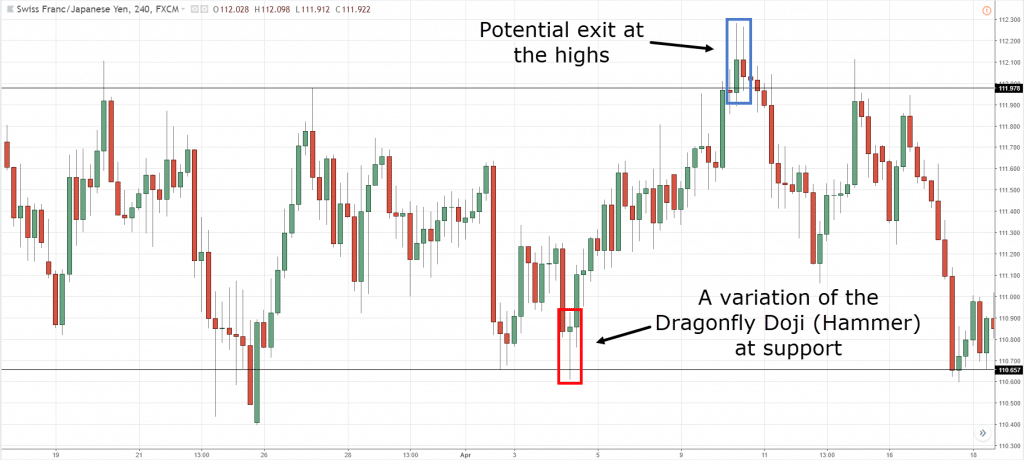
You know Support is an area where possible buying pressure could come in.
So, what you want to do is go long when the price comes to Support and forms a Dragonfly Doji.
Why?
Because the market is telling you it has rejected lower prices and it could reverse higher.
Here’s what I mean:
Next…
How to trade the Dragonfly Doji in a trending market
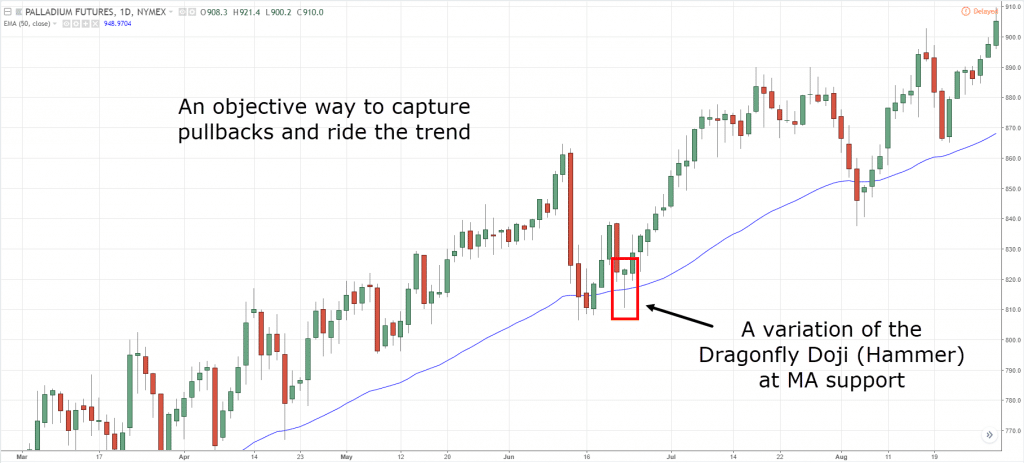
In a strong trend or healthy trend, a doji candle is likely to “bounce off” the Moving Average.
Thus, you’ll look to go long when the price does a pullback towards a key Moving Average and forms a Dragonfly Doji.
Here’s an example:
Now, you’ve learned what the Dragonfly Doji is and how it works.
In the next section, you’ll learn another type of Doji that signals the market is about to reverse lower…
Gravestone Doji: How to tell when the market is about to reverse lower…
A Gravestone Doji occurs when the open and close is the same price but, with a long upper wick.
It’s a bearish Doji and here’s how it looks like:
This tells you when the market opens, buyers came in and pushed the price higher as the doji candle closes.
However, it’s not long before the sellers took control and fought their way back lower.
And finally, the market closed at the same price where it opened.
This is a sign of weakness as the sellers are in control.
And here’s how you can trade the Gravestone Doji…
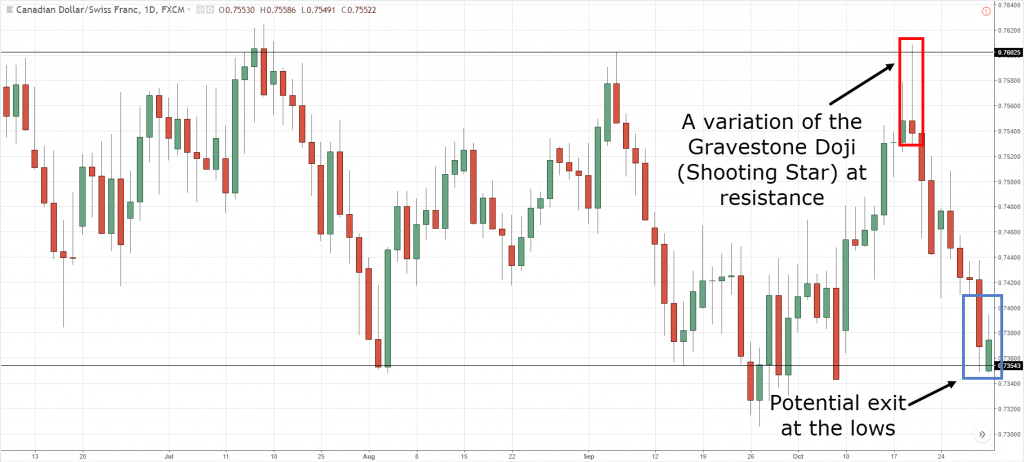
How to trade the Gravestone Doji in a range market
You know Resistance is an area where possible selling pressure could come in.
So, what you want to do is go short when the price comes to Resistance and forms a Gravestone Doji.
Why?
Because the market is telling you it has rejected higher prices and it could reverse lower.
Here’s what I mean:
Next…
How to trade the Gravestone Doji in a trending market
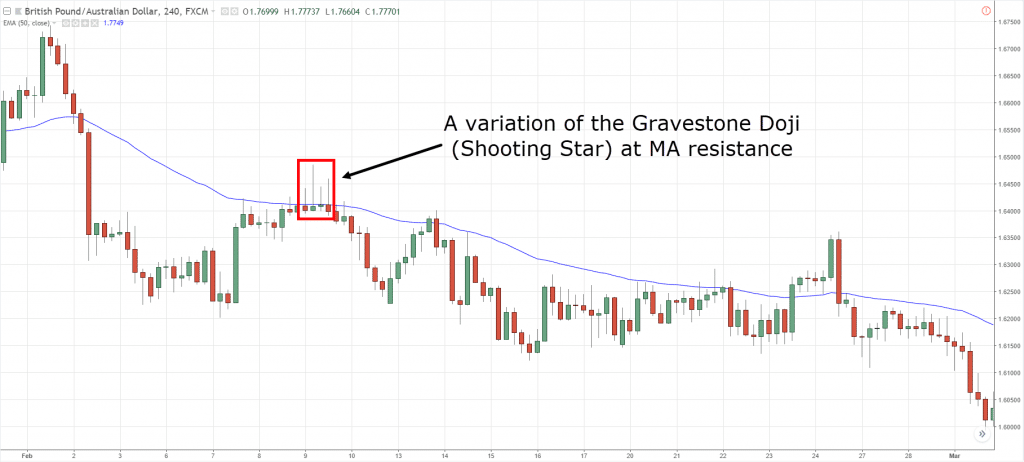
In a strong trend or healthy trend, the market is likely to “bounce off” the Moving Average.
Thus, you’ll look to go short when the price does a pullback towards a key Moving Average and forms a Gravestone Doji.
Here’s an example:
Long Legged Doji: A rare candlestick pattern and the meaning behind it…
A Long Legged Doji is a standard doji candlestick that occurs when the open and close is the same price but, with a long upper and lower wick (relative to the earlier candles).
Here’s how it looks like…
This means the market is undecided after a huge expansion in volatility (which usually occurs after a big news event).
You’ll seldom see this candlestick pattern, but if you do, expect volatility to “die out” for a while before it picks up again.
So here are 2 techniques to trade the Long Legged Doji…
1. Fade the first test
After a huge expansion in volatility, the market needs to take “a break” before it can continue.
Meanwhile, the market is likely to be in a range to accumulate orders before it breaks out
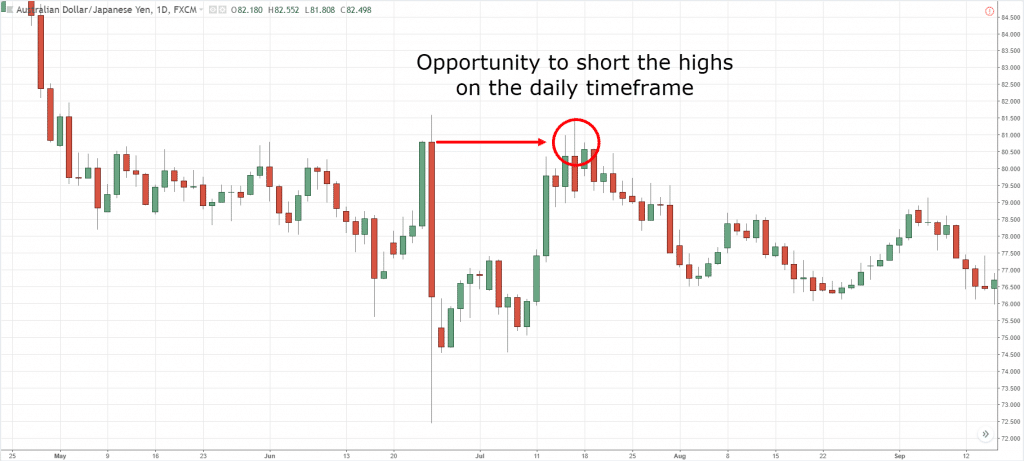
This means you can long the lows (or short the highs) of the Long-Legged Doji — ideally on the first test.
Here’s an example:
AUDJPY Weekly: A Long Legged Doji
AUDJPY Daily: An opportunity to short the highs on the first test
2. Trade the breakout
Now…
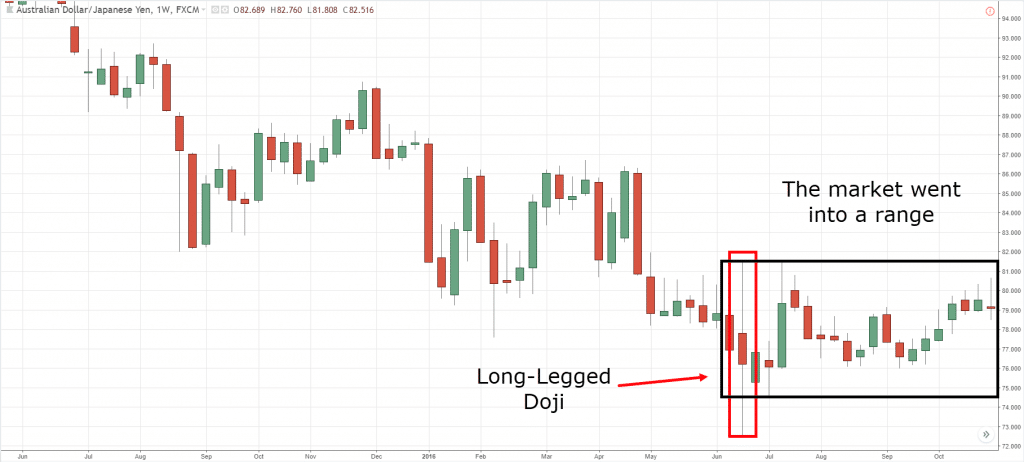
If the price has tested the highs/lows (of the Long-Legged Doji) multiple times, then it’s likely to break out.
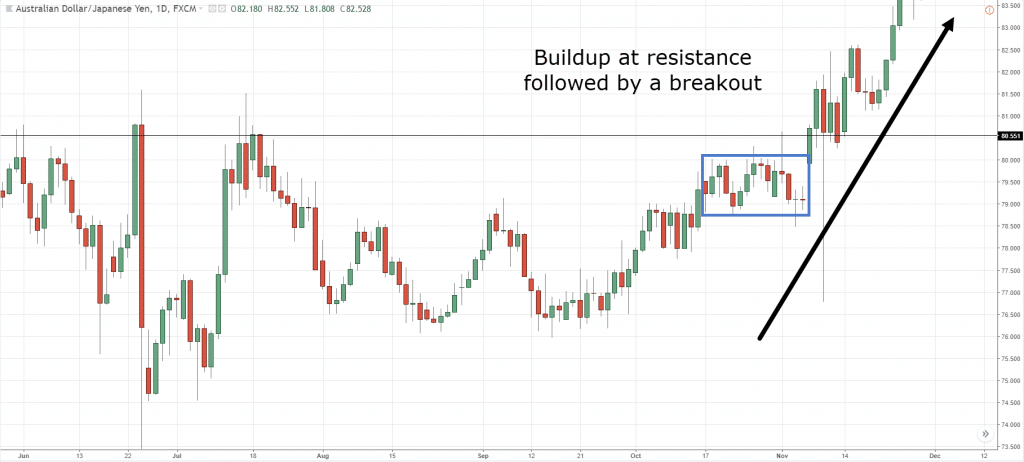
So, look for a buildup to form (as an entry trigger) and trade the breakout.
Here’s an example:
AUDJPY Weekly: The market went into a range after it formed a Long-Legged Doji
AUDJPY Daily: A buildup at Resistance that led to a breakout
If you want to learn more about buildup, go watch this training video below…
Four-Price Doji: How to tell if you should stay out of the market
A Four-Price Doji occurs when the open, close, high and low prices are the same.
It’s essentially a horizontal line:
This means that the price did not change at all during the period of a candlestick.
It’s common to see the Four-Price Doji in markets where trading volume and liquidity is extremely low.
Now…
If you see many Four-Price Dojis on the chart – stay out of this market.
Because liquidity is so low, you won’t be able to get in and out of your trades easily.
And there won’t be any meaningful patterns for you to trade in this market condition.
Frequently asked questions
#1: What’s the significance of a candlestick with a tail?
A tail on a candlestick signifies price rejection.
If the tail is a:
- Long upper wick, it signifies rejection of higher prices
- Long lower wick, it signifies rejection of lower prices
#2: Hey Rayner, do all these Doji candlestick patterns apply to all timeframes?
The concept of these Doji candlestick patterns can be seen across different timeframes.
#3: Can you also do a post on the other candlestick patterns?
If you want to discover the other candlestick patterns (like the bullish engulfing, bearish engulfing, shooting star, hammer, etc) strategy guides, then head over here for a full list of them.
Conclusion
So here’s what you’ve learned:
- A Doji represents indecision in the markets as buying and selling pressure is equal
- A Dragonfly Doji is a sign of strength as the buying pressure overcame the selling pressure
- A Gravestone Doji is a sign of weakness as the selling pressure overcame the buying pressure
- You can trade both the Dragonfly and Gravestone Doji in a range or trending markets
- A Long Legged Doji presents strong indecision, and the market is likely to be “dull” for the next few candles
Now I’ve got a question for you…
How do you use Doji in your trading?
Leave a comment below and share your thoughts with me.




If a Doji hammer forms in a down trend on the 4 hr I will look at the 30 minute chart to look at the next candle formation to see if it is bullish and how far that candle is from the 4 hr 50 MA to see if there is a chance of pullback. To test that region The rest is fairly similar to how you describe especially at S and R however I look at the close of the next candle as in a trend a doji can also mean a rest. Love your work Man keep it up
Thank you for sharing, Greg.
Thanks for the beautiful write up Rayner. Very clear and succinct. Much appreciated.
The pleasure is mine, cheers.
As always to the points and through the points
I appreciate it.
Hello Rayner, since I knew a while ago the real meaning of the Doji has been trading with very good results, especially in trend markets( Work D and 4H). His super excellent explanation and clarifies more the concept he had. Thank you Illustrious.
Translated by Google
You’re welcome, Hernando.
Thanks Rayner, I will watch out fro Doji from now on.
Let me know how it works out for you.
Hi, can you pls help out in this scenario . uptrend with THREE fairly green candles (moderate body ). I spot a dragon fly doji after consecutive three green candles being a RED dragonfly doji. How can I go further here ? is it a likely bearish or bullish
If its an uptrend then it is likely to continue as sellers tried to push market lower but buyers didnt allow them to….BTW area of value is important so make sure to take that into consideration.
Thank you. Soham!
EXCELLENT
EXPECTING MORE EXPLANATIONS ON OTHER TYPE CANDLES
cheers
Nice one sir.The doji can it also be a long candlestick with a tail?.If not,what does a long candlestick with a tail signify? The tail could be either up or down or both.Thank u
A tail signifies price rejection. The longer it is, the stronger the price rejection.
Thank you so much Rayner, i have been following only you since more than a month. All your videos are very helpful explained beautifully and to the point.
However i just want to know if you can help out for screening stocks with any application which will help in identifying breakouts and swing trading
I scan my trades manually.
This post might help… https://www.youtube.com/watch?v=4G1fIVPlX_w
Great info as per usual Rayner!
Thank you, Troy.
hey hey my friend, is this applicable in all timeframes ?
The concepts and principles can be applied the same, as long as the market has sufficient liquidity.
nice , clear and working strategy…thxs!!!
You’re welcome!
Thank you Man…Now I started to study about Trading…I am watching your videos…I can understand all of them… I’ll start trading as soon as possible…
Cheers Abid!
You have explained it so well that I have no confusion about doji.
Glad to hear it!
Thank you, its very useful and your teaching is simple and straightforward.
Awesome to hear that!
Rayner,I am a beginner I like your teaching and your write-ups I wish I can understand them and put it into practice. I will like you to be my mentor, Will you?
Useful!
cheers
Much thanks for what you are doing for us the young traders
Anytime!
Very smiple you made it..
cheers
Even though I just started to learn a few days ago, it is very helpful. It makes sense. Thank you.
Thank you, Shukui!
Thank you for the explanations, very clear and to the point. I will apply them to my analysis on the candle chart patterns. Truly appreciated!
You are most welcome, Caridad!
Thank you so much for your time to teach us ,