
This post is written by Jet Toyco, a trader and trading coach.
Support and resistance levels are probably the very first thing you learned in technical analysis.
But as you try to apply the concept consistently…
You can’t help yourself and ask:
“Am I plotting my levels right?”
“Am I plotting too many support and resistance levels?”
Or how about this…
“Do support and resistance levels have an edge in the markets or are they just rubbish?”
If you think that’s you then you’ve come into the right place.
Because this training guide is dedicated to answering those questions!
By the time you reach the end of this guide…
You’ll never see support and resistance levels the same way again.
Excited?
Then let’s get started!
What are the two types of support and resistance levels and when to use them
At this point…
I’m sure that whenever you hear support and resistance, it looks something like this:

Which is great!
It tells you where potential selling and buyer pressures are!
However…
Horizontal support and resistance mostly cater to one market condition:
Range markets.
So, what would you do if a market is at an all-time high?

Where would you take your profits?

Would you wait for the price to reverse back to your nearest “support?”

The answer to those questions is:
Of course not!
Because you would then be left out of the trend.
Even if you have a trade on this market, you’re not sure where or when to take your profits!
So, what’s the solution?
That’s right.
Dynamic support and resistance
This type of support and resistance can come in different forms such as being able to identify it using:
- Trend lines
- Moving averages
But the bottom line is that in trending markets, finding support and resistance levels this way can be powerful.


Makes sense?
So, if you see a range market and you tend to buy low and sell high and take fixed target profits…
Use horizontal support and resistance levels:

If you see a trending market and you wish to trail your stop loss…
Use dynamic support and resistance levels:

This is the key to finding support and resistance levels, my friend.
Determine the current market condition and plot support and resistance levels relevant to the current market condition.
Pretty cool, right?
Now, I have a confession to make…
All of these charts are cherry-picked.
So, finding support and resistance levels in the real world can be a different story.
That’s why in the next section…
I’ll share with you the common pitfalls when trying to plot support and resistance levels.
So make sure to keep on reading.
Still with me?
Good.
The right and wrong ways how to find support and resistance levels
Here’s the truth:
Just because you have lines on your chart doesn’t mean that the markets will respect them.
Sometimes, horizontal and dynamic support and resistance levels fail:

And sometimes, they suddenly reverse back in your favor:

What?
This is madness!
This is the institution’s fault!
Nope.
What’s happening here is that you’re treating support and resistance levels as:
- A single line
- A holy grail level the markets must reverse from
So, what’s the solution?
Simple, two things:
- Treat support and resistance levels as an area
- Constantly re-adjust your support and resistance levels
Let me explain…
Treat support and resistance levels as an area
Yes.
Support and resistance levels are areas on your chart where potential buying and selling pressure can come in.
However, there will be times when those buying and selling pressures can come in too late or too early!
Just like how some students arrive on time for their class, while some arrive an hour late!
This is what we call undershooting:

And overshooting:

While we can’t exactly avoid this in our trading, there are ways you can reduce it.
Which is to plot horizontal and dynamic support and resistance using a box:


Remember, what we are doing here is to find a historical “battlefield” where buyers and sellers have previously fought for a level.
Next.
Constantly re-adjust your support and resistance levels
Keep this in mind:
Support and resistance levels can be invalidated and created.
So as market conditions change, so should your support and resistance levels.
It makes sense, right?
Now you might be thinking…
“Okay, so how exactly can we re-adjust our levels and know when a new one is created?”
Two things, my friend:
- Previous resistance turns to support and previous support turns resistance
- Swing highs and swing lows
Mind you…
These two will take some time and practice to identify.
So if you’re not sure what you’re plotting is correct, let me know which chart you are looking at in the comments section and I’ll do my best to help.
Sounds good?
Now let’s get back to it…
Previous resistance turns to support and previous support turns resistance
At this point, I assume you already know how important it is to plot boxes in your support and resistance levels instead of a single line.
So, if the price breaks out of that horizontal resistance area:

There’s a chance that it can become support:

At the same time…
If the price breaks a dynamic area of resistance:

There’s a chance that the uptrend is now transitioning from a downtrend:

Yes, not all the time the market will have these clean retests.
So this leads me to my next point.
Swing highs and swing lows
Swing highs and swing lows are pivot points where a price has reversed at some point in time.
Here’s what they look like:

Swing highs or lows are areas where it hasn’t been tested before.
However, they can be very powerful levels when referencing your stop loss and take profit:

There you go!
Can you see how important this is?
It teaches you how to identify your support and resistance levels no matter what the market does!
Now…
If you’ve practiced plotting support and resistance for some time, I’m sure you’ve experienced this at some point:
Analysis paralysis.
That’s right.
There are thousands of lines on your chart, minor and major support and resistance levels.
With all of these levels on your chart, what would you do…
Long, or short?

I know I’m exaggerating but can you see what I mean?
But don’t worry…
In the next section, I’ll teach you an easy way how to plot your levels clean and fast.
Excited?
Then read on…
A simple technique on how to find support and resistance levels fast
Let’s have a test.
I’m going to show you a chart and I want you to tell me:
- How many support and resistance levels can you see
- How many seconds did it take you to find them
Ready?
Set?
Go.

Done?
Great!
Now, unfortunately, I can’t see what you’ve plotted right at this moment.
So I’ll let you choose…
Does your chart look something like chart A?

Or something like chart B?

Next, how long did it take you?
30 seconds?
20 seconds?
10 seconds?
So, do you want to know how many support and resistance levels should you plot when looking at a blank chart and how long?
Let me tell you:
1-3 support and resistance levels, plotted in less than 8 seconds
That’s right.
You see…
Plotting your support and resistance levels should never be complicated.
It should be fast and simple as much as possible.
Why?
Because we’re traders and not analysts!
You want to make sure that each trading decision you make is simple and doesn’t use too much of your (limited) mental capital!
So how do you achieve just that while maintaining effectiveness?
Listen closely because this is going to be important:
- Determine the market condition
- Determine your trade management
Let’s get right to it…
Determine the market condition
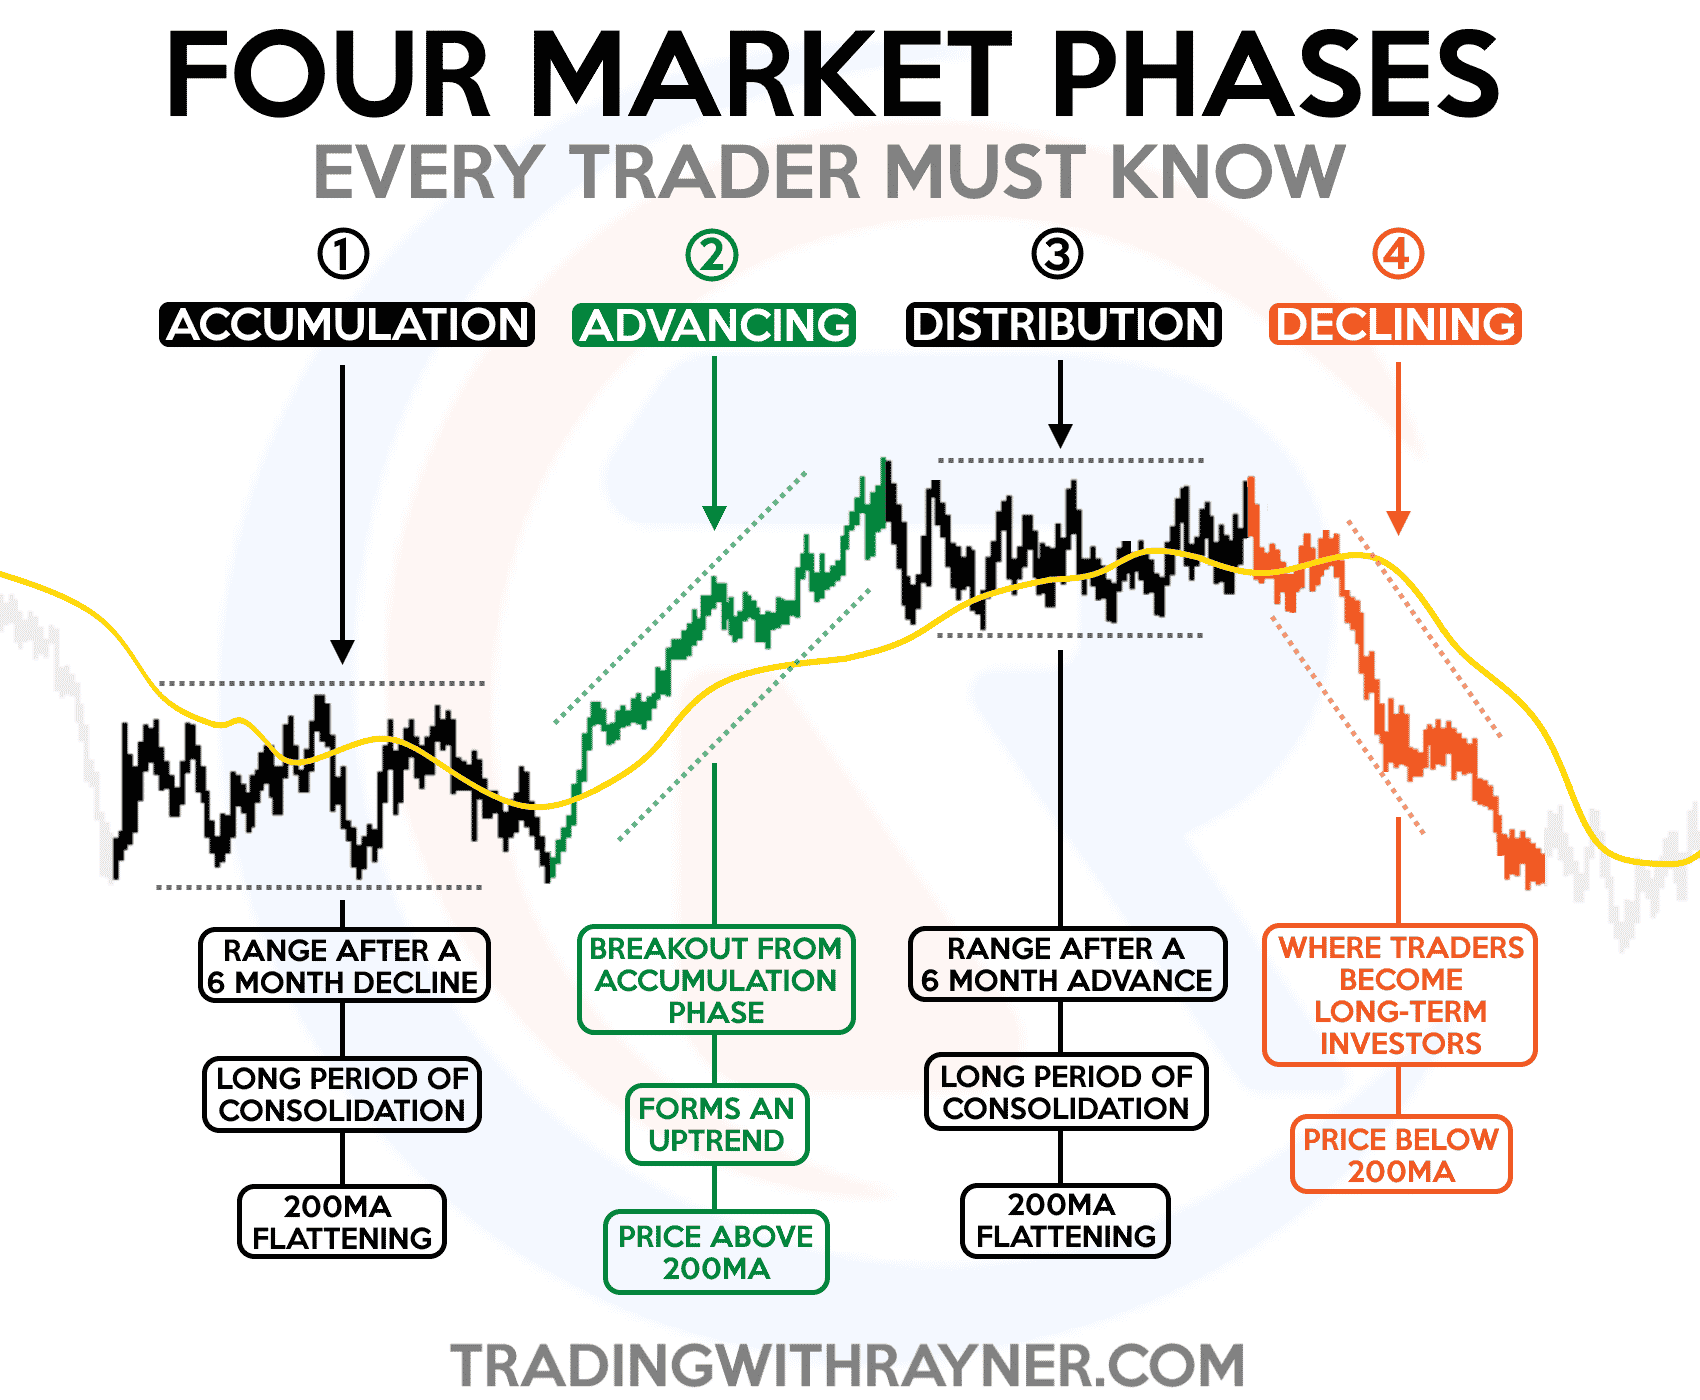
There are only three types of market conditions out there:
- Uptrend (advancing)
- Downtrend (declining)
- Range (accumulation/distribution)
Here’s what I mean…
There could be many ways how to determine this, but one simple way to do so is by using a 100-period moving average.
If the price is above it, then it’s in an uptrend!
If the price is below it, then it’s a downtrend!
If the moving average is in-between prices, then it’s a range!
Let me show you what I mean:

Next.
Determine your trade management
Here’s what this means:
You know the purpose of every support and resistance level you’ve plotted.
Once you’ve determined that the market is a down trending market, you need you only need two:
- Dynamic resistance 1 – To reference your initial and trailing stop loss
- Horizontal support 1 – To reference your breakout entry point

Note: Horizontal support 1 isn’t needed if you’re not looking to trade pullbacks instead of breakouts.
If the market is in a ranging market, you only need three:
- Horizontal support 1 – To reference your entry point and stop loss
- Horizontal resistance 1 – To reference your take profit
- Horizontal resistance 2 – To reference your second take profit level

Note: Dynamic resistance 2 isn’t needed if you’re not looking to take partial take profits
That’s it!
Pretty awesome, right?
So at this point…
You’ve learned two different types of support and resistance and how to plot them efficiently.
But have you ever wondered…
Do support and resistance work?
I mean, you wouldn’t want to execute something that doesn’t work, right?
But here’s a more important question:
Have you questioned whether the indicators and concepts you use work?
Does it have an edge in the markets?
You see…
We spend more time experimenting than verifying, and that’s what gets other traders stuck in a loop of inconsistency.
Now, to test whether or not support and resistance levels work…
I will be performing historical testing with a trading robot (EA) using this rule:
- If a market makes a new weekly high, you enter the trade
- If a market keeps making new weekly highs, you hold the trade
- If a market makes a new weekly low, you exit the trade and open a short position
Vice versa for shorts:
- If a market makes a new weekly low, you enter the trade
- If a market keeps making new weekly lows, you hold the trade
- If a market makes a new weekly high, you exit the trade and open a short position
So, what do you expect to see?
If the system is profitable, then the market tends to break support and resistance levels (weekly highs/lows).
If the system is unprofitable, that means the market statistically tends to respect its support and resistance levels.
Makes sense?
Then let’s start testing!
Test #1: EURUSD (2007 – 2022)

Based on this report, you can see how the system has lost money with a profit factor of 0.83
It means that this pair tends to reverse from its weekly highs and lows, therefore making it a suitable market to use horizontal support and resistance levels to buy low and sell high.
Test #2: GOLD (2006-2022)

In the duration of the test, the system has made money with a profit factor of 1.01
What does this tell you?
It means that this market tends to break its weekly highs and lows, therefore making it a suitable market to use dynamic support and resistance levels to buy high and sell higher.
Last one…
Test #3: BTCUSD (2014-2022)

The chart is very clear!
The system has been profitable with a profit factor of 1.46
So, if you want to trade this market…
Then using dynamic support and resistance to buy high and sell higher would be better.
And there you go!
If I were to ask you this time:
Do support and resistance levels work?
The answer is that it depends.
Certain types of support and resistance levels work in some markets, while in some markets it doesn’t.
Now, before I end this guide here are some disclaimers…
Disclaimer
I know that I’ve recently spit out some tests on certain markets.
However…
It’s very important that you still do the testing and see the numbers yourself.
But the principle that I wish to impart to you is that you must verify everything you see and hear.
Don’t take anything for granted.
So if you wish to do the same test that I did, then you are free to download my open-source expert advisor through this link here.
Sounds good?
Then let’s have a quick recap on what you’ve learned in today’s guide.
Conclusion
- There are two types of support and resistance levels: horizontal, and dynamic (to buy high and sell higher)
- Support and resistance levels must be treated as an area of buying and selling pressure, and you must be aware that these levels can be retested or invalidated
- To find support and resistance levels efficiently, you must determine the market condition first and then support and resistance levels for your entries, stop loss and take profits
- Certain types of support and resistance levels work depending on the market condition
Over to you now…
Do you think support and resistance levels work?
Perhaps there are more than two types of support and resistance levels?
Let me know what you think in the comments below!
Thank you! This article is huge informative and I really learned a lot from this article and also refer to my friends. https://www.tradingwithrayner.com/
Hey Matthias, awesome to hear that!
If a market makes a new weekly high, you enter the trade
If a market keeps making new weekly highs, you hold the trade
If a market makes a new weekly low, you exit the trade and open a short position
Can you please explain this for me? How is this possible for profitable trade? If I hold long position still new weekly low, it will be in loss or profit?
Hey there Atchaya, this is meant to “test” the market’s behavior and is by no means a valid trading strategy!
Please I have a question. In using multiple timeframe analysis, do you draw your trendlines/support & resistance lines on your entry timeframe or on the higher timeframe?
I do suggest placing them on your higher timeframe, Ejike!
It seems interesting to know, since I’m a bigginer trader. I’ve lost a lot of money trading. I really need more help from you Rayner I just need your help.
Thanks
Hey Jacob, our trading academy (free) will help you out!
https://www.tradingwithrayner.com/academy/
Please make a full guide on Fibonacci retracement
Hey there Prince, we did!
You can check it out here: https://www.tradingwithrayner.com/fibonacci-trading/
I love reading your article because it open my eyes more for deeper understanding about trading…. I’m happy to know you. I understood everything you explained sir thanks
Great to hear that, Okamma!
I have come to realise that support and resistance have to be the important element of my strategy. Thank you
Definitely, you’re welcome Mohammed!
Support and resistance work.
Yes, that is right, Fury!