Multiple timeframes trading allows you to gain insight into the higher and lower timeframes.
This means you can make better trading decisions and better time your entries & exits.
I’ll explain…
Do you make this mistake when trading multiple timeframes?
Imagine:
You want to spy on your neighbour for god knows what reason.
Perhaps they are doing illegal activities, you’re a nosy park, whatever.
But there’s a fence built between you and your neighbour so you each have your privacy.
How do you overcome this?
Do you take a trip to space and spy down on your neighbour’s house?
Of course not!
Why?
Because you are “too far” out and the sights (or images) you see will not be relevant to your needs.
You’re probably wondering:
“What has this got to do with trading?”
Well, it’s the same concept.
If you want to glean insights from the higher timeframe, you can’t zoom out too far because the information you’ll get is not relevant for you.
So now the question is…
How do you use multiple timeframes the correct way?
Read on…
The secret to using multiple timeframes like a professional trader
I’ll be honest.
I didn’t figure it out on my own.
Instead, I learned it from Adam Grimes and Alexander Elder.
So here’s the “secret”….
When you trade with multiple timeframes, your higher timeframe should be between a factor of 4 to 6 of your entry timeframe.
Confused?
No worries, I’ll explain…
Let’s say for example your trading timeframe is the 1-hour timeframe.
So, which should you reference as your higher timeframe?
1. Take 1-hour multiply by 4, you get a 4-hour timeframe
2. Then, take 1-hour multiply by 6, you get a 6-hour timeframe
3. This means your higher timeframe can be between 4 and 6-hour
Does it make sense?
Here’s another example:
Let’s say your trading timeframe is the 5-mins timeframe.
Which should you reference as your higher timeframe?
1. Take the 5-mins multiply by 4, you get 20-mins
2. Then, take 5-mins multiply by 6, you get 30-mins
3. This means your higher timeframe can be between 20 and 30mins
Pro Tip:
You can apply this concept to identify your lower timeframe (if you wished to).
So if your entry timeframe is 60-mins, then your lower timeframe can be between 10 and 15-mins.
How to use multiple timeframes and quickly improve your winning rate
Here’s the deal:
Just because your trading timeframe is in an uptrend doesn’t mean your higher timeframe is in an uptrend.
There’s a possibility the higher timeframe trend is against your trading timeframe—and that puts the odds against you.
The solution?
You want to trade in the direction of the higher timeframe trend—not against it.
Here’s how…
1. Identify your higher timeframe using a factor of 4 to 6
2. Make sure the trend on your trading timeframe is aligned with the higher timeframe
Let me give you an example…
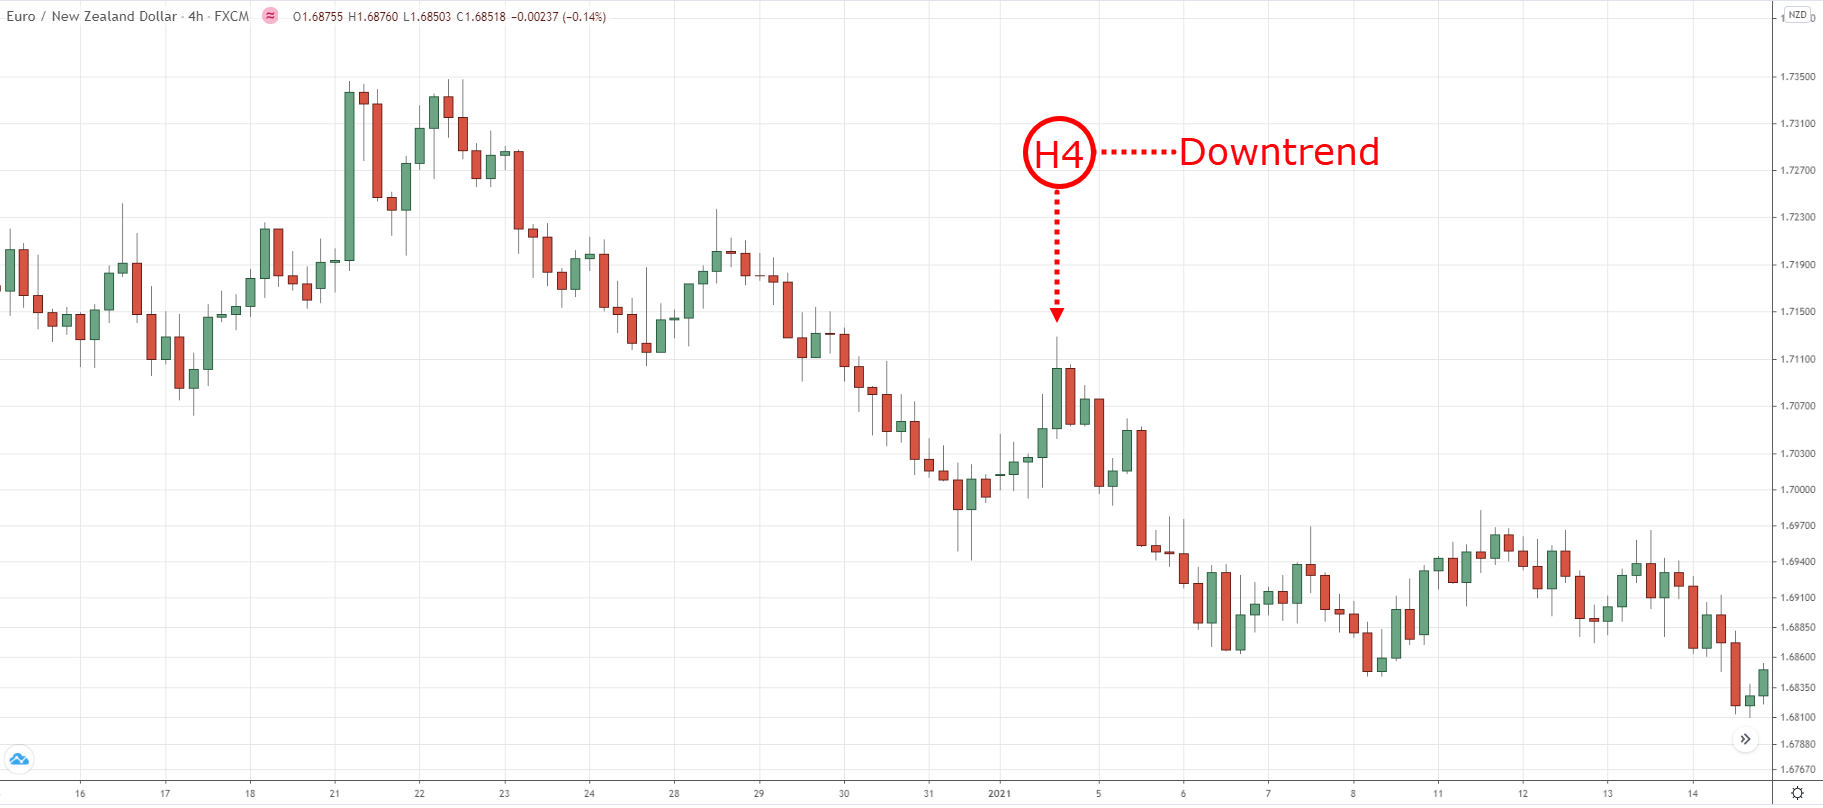
EURNZD 4-hour:
As you can see, the 4-hour chart on EURNZD is in a downtrend (as shown above)…
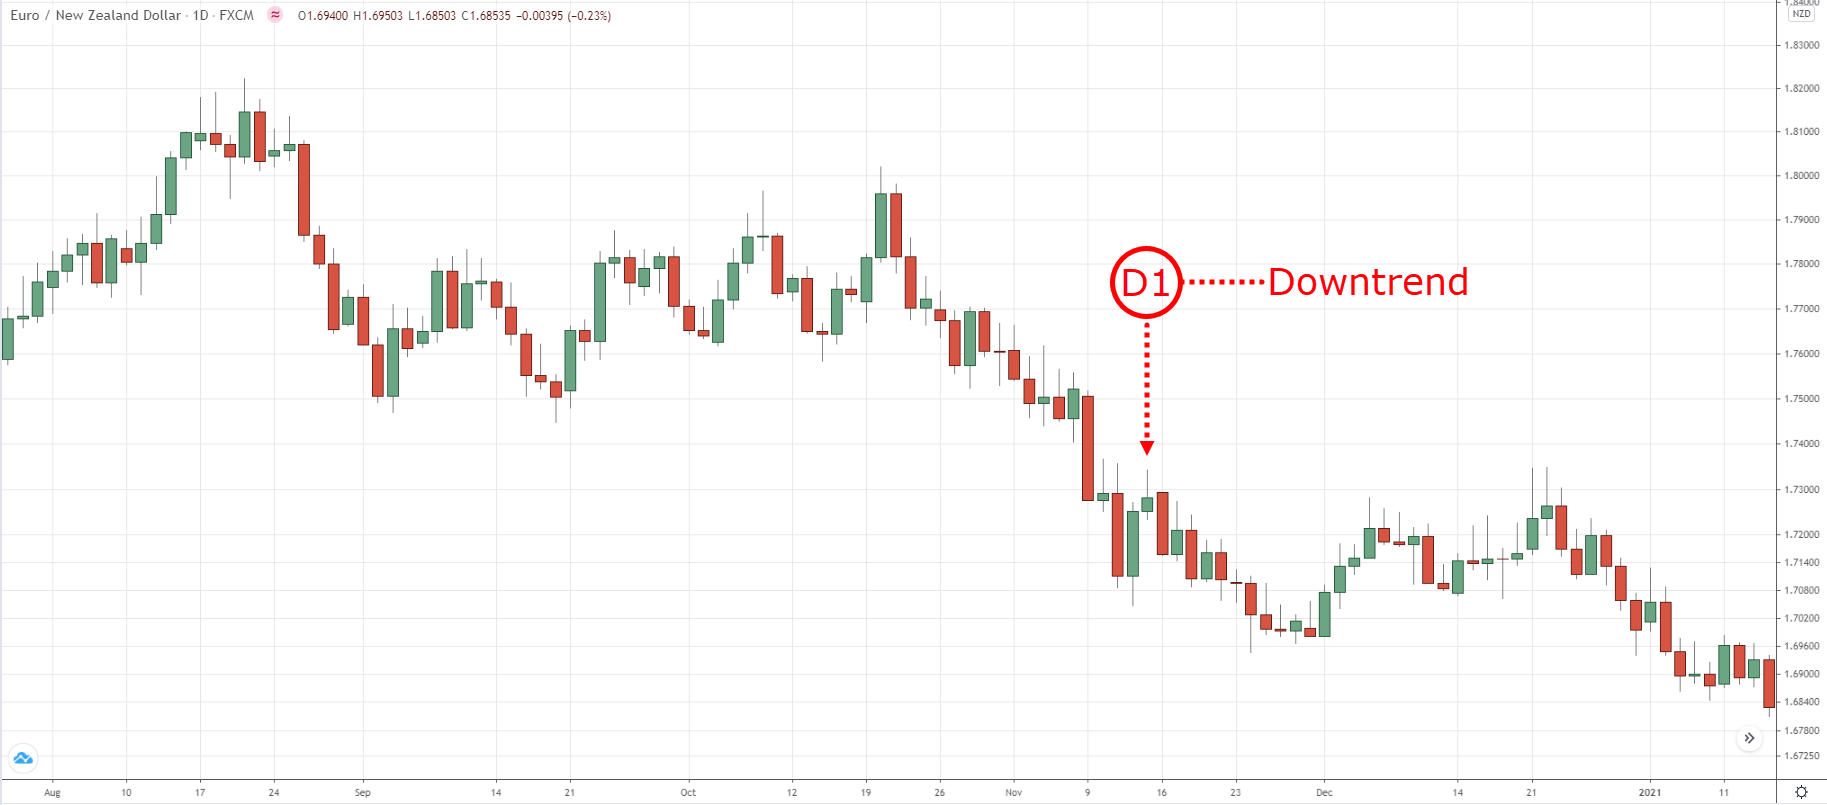
Next, let’s check the daily timeframe and see if it’s in a downtrend…
EURNZD Daily:
Yes, it is!
So if you are looking for selling opportunities on EURNZD, you’ll know both the 4-hour and daily timeframe are aligned.
Moving on…
Multiple timeframes trading: How to “predict” market turning points with deadly accuracy
Support is an area on your chart where buying pressure could step in and push the price higher.
Still, you know support doesn’t always hold because the price could break down lower.
Now…
What if I tell you there’s a technique to identify the “best of the best” area of support—where the price has a good chance of reversing higher.
Want to learn more?
Here’s how…
1. Identify support on your trading timeframe
2. Make sure this area coincides with a higher timeframe price structure (like support, moving average, trendline, etc.)
Here’s an example…
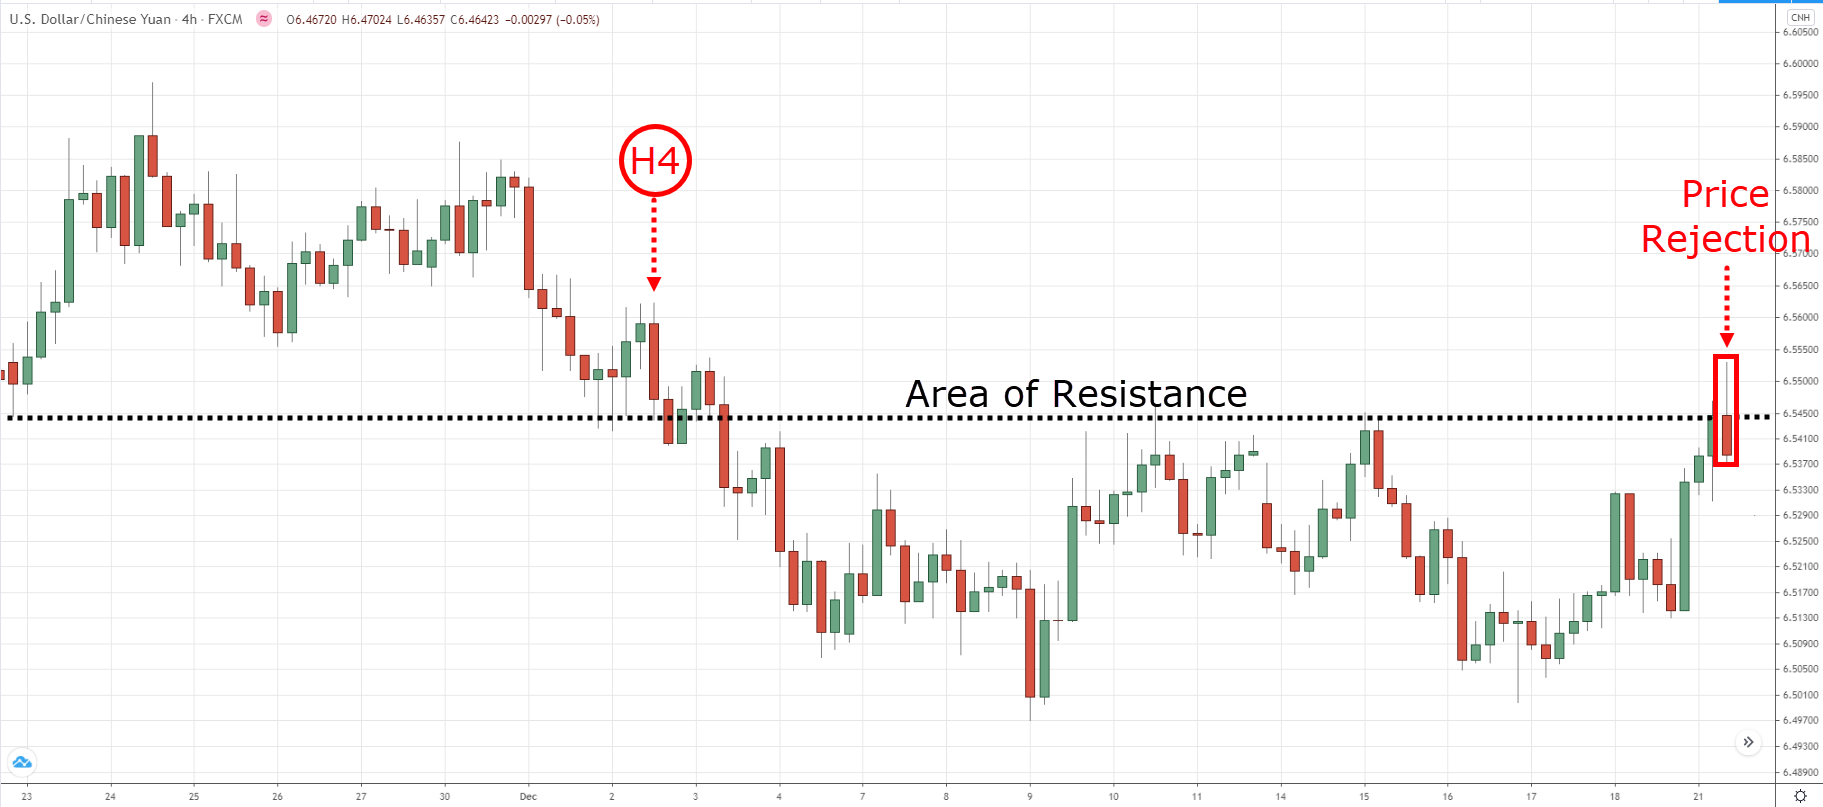
USDCNH 4-hour:
On the 4-hour timeframe, USDCNH is in a downtrend and made a pullback towards resistance.
Next, you saw a bearish price rejection as the market closed lower (and formed a shooting star pattern).
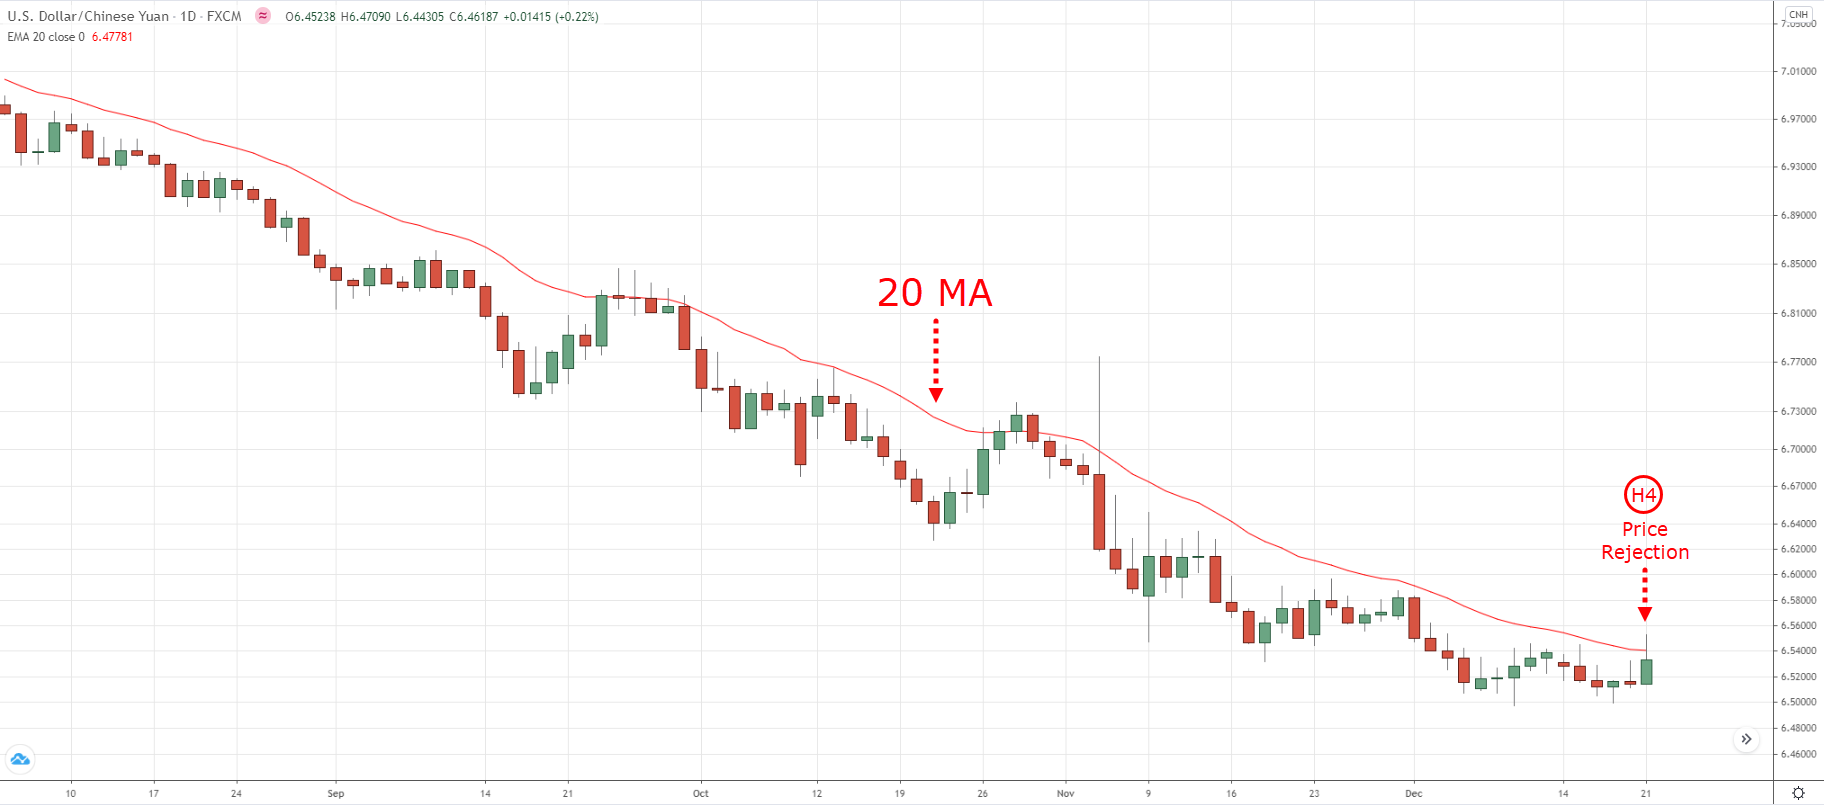
But that’s not all because the area of resistance on the 4-hour timeframe also coincides with a price structure (the 20-day moving average) on the Daily timeframe.
Here’s what I mean…
USDCNH Daily:
Does it make sense?
In other words…
The resistance area on the 4-hour chart is more significant because it “overlaps” with a respected moving average on the Daily timeframe (in this case, it’s the 20 MA).
Pro Tip:
The higher timeframe price structure can also be things like support, trendline, etc.
How to use multiple timeframes to better time your exits—and ride massive trends
Have you ever taken profit on a trade, only to watch the market explode higher in your favour?
Or perhaps you tried to ride a trend but the market ended up making a 180-degree reversal—and your winning trade becomes a loser.
Does any of the above sound like you?
Well, don’t worry.
Because you’re about to learn a simple framework to help you better time your exits so you don’t give back your open profits—and know when to ride a trend to maximize your profits.
Here’s how it works…
Capture a swing if trading against the direction of the higher timeframe trend
A swing refers to capturing “one move” in a trade, that’s it.
You might be wondering:
“But why capture a swing?”
Here’s why…
1. The higher timeframe trend is likely to resume itself
2. This means your profit potential is limited as you’re against the higher timeframe trend
3. If you’re not quick to take profits, you’ll likely lose it when the trend resumes
Make sense?
So how do you capture a swing?
Simple.
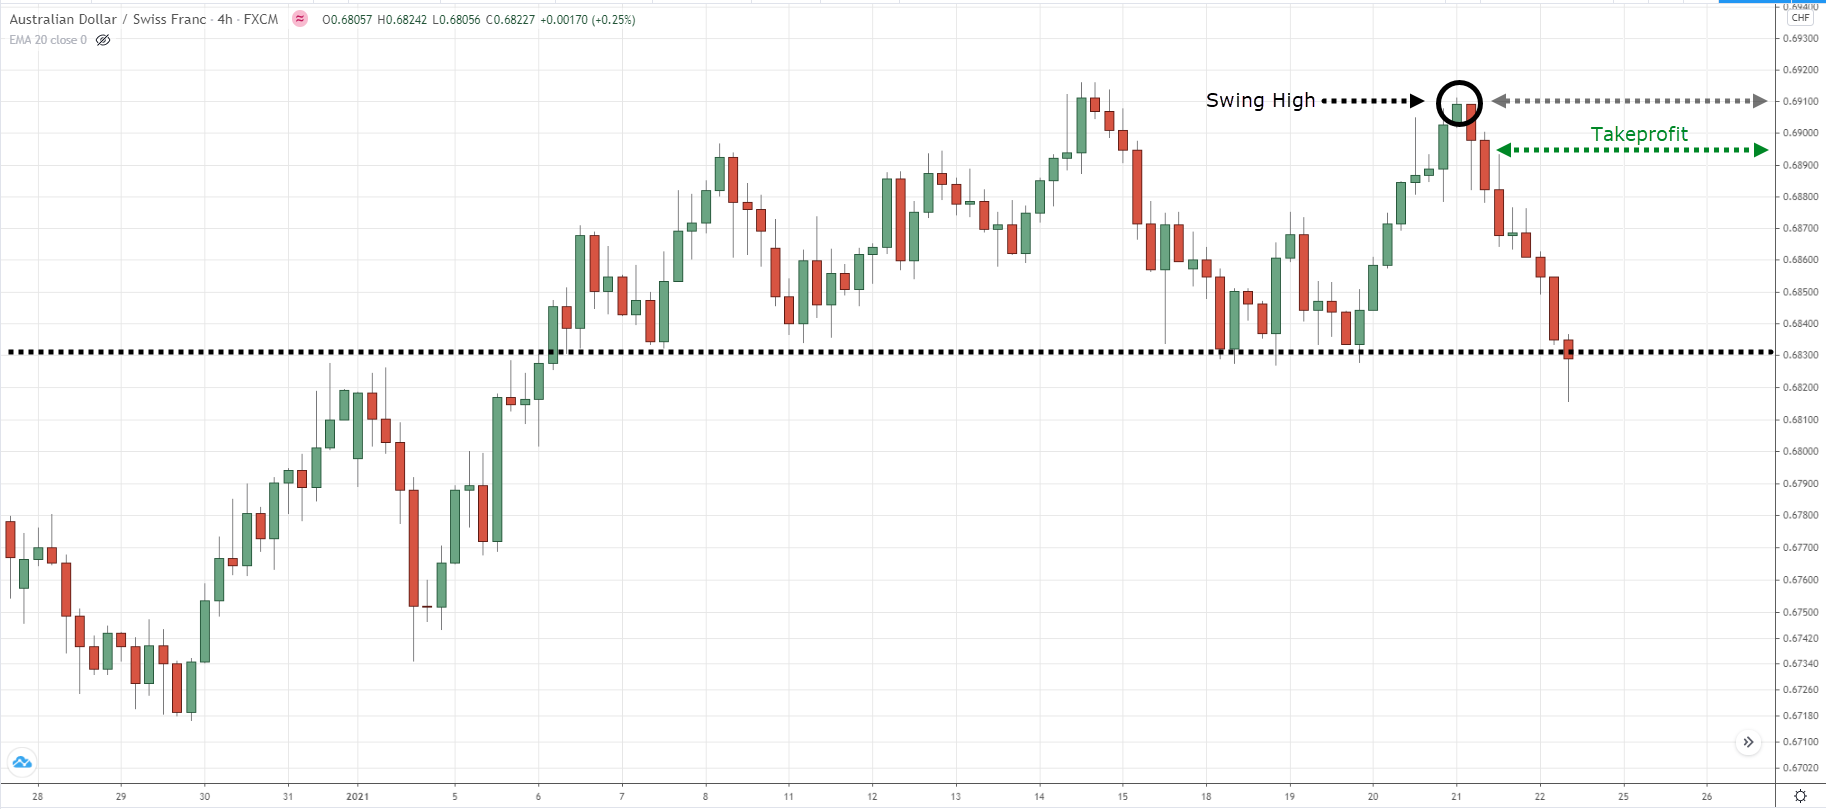
You want to exit your trade before opposing pressure steps in.
So if you’re in a long trade, then you want your trade before resistance, swing high, etc.
An example…
(And vice versa for short trades. You’ll look to exit before the price reaches support, swing low, etc.)
Now, what if you’re trading in the direction of the higher timeframe trend?
Trail your stop loss if trading in the direction of the higher timeframe trend
Now, you can still capture a swing if that’s your preferred approach.
But you can also trail your stop loss to ride the trend and maximize your profits.
Here’s how it works…
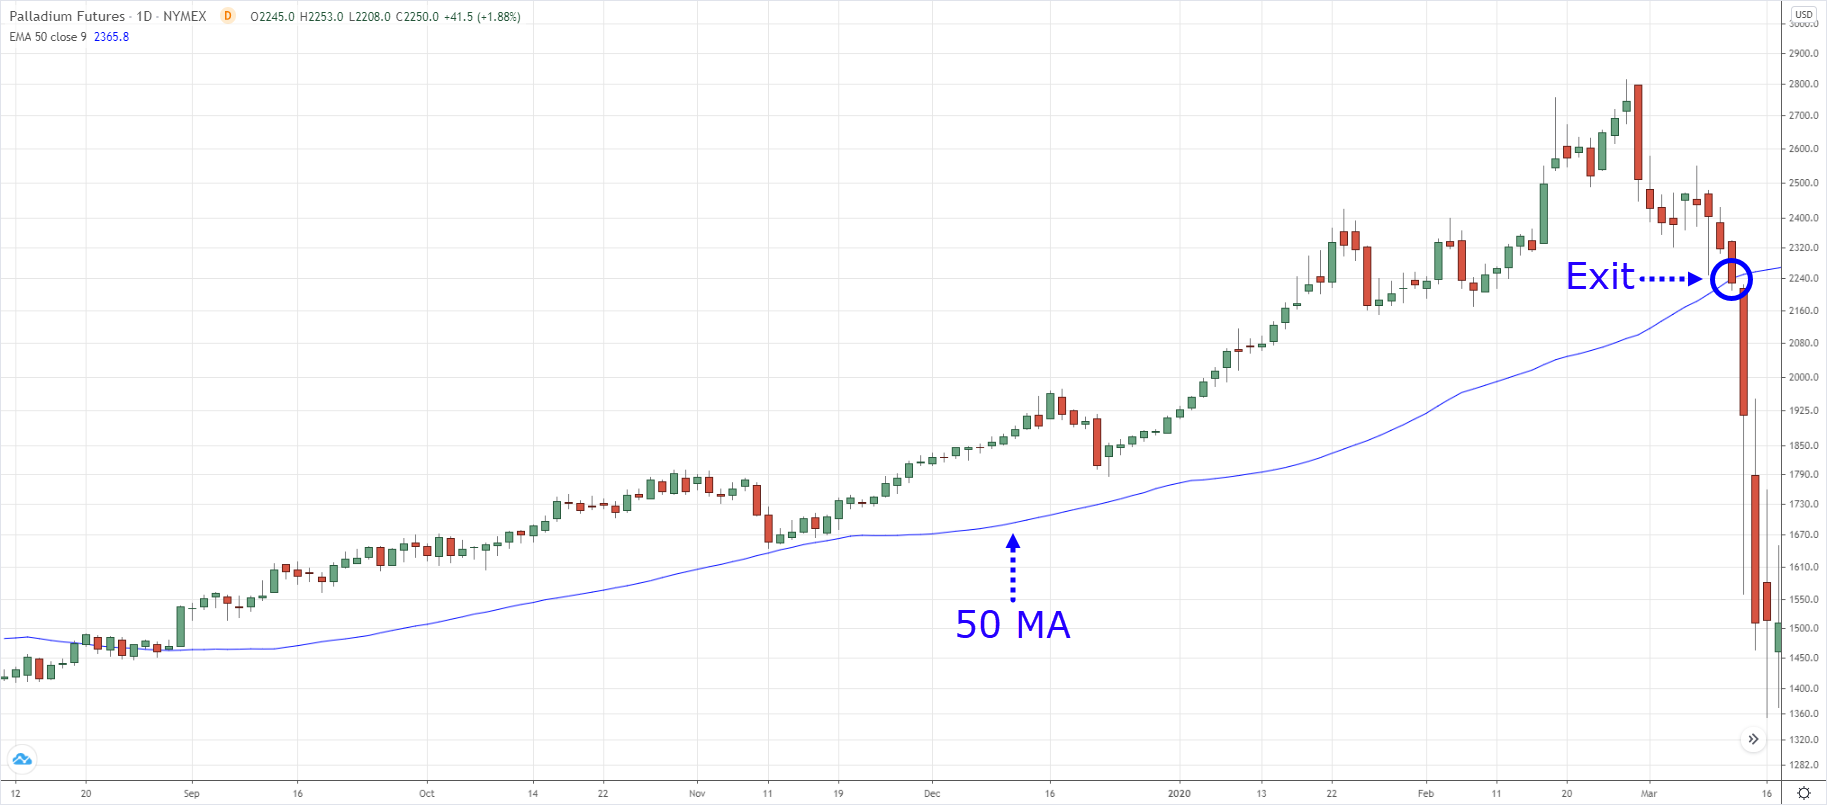
- Decide on your trailing stop loss technique (it could be moving average, price structure, chandelier kroll, etc.)
- Trail your stop loss as the market moves in your direction
- Exit the trade when it hits your trailing stop loss
Here’s an example using the 50-period moving average…
Pro Tip:
The wider your trailing stop loss, the better you can withstand pullbacks to capture a bigger trend. However, you risk giving back more open profits.
(And vice versa for a tighter trailing stop loss.)
Conclusion
So here’s what you’ve learned:
- If you want to use multiple timeframes, use a factor of 4 to 6 to identify your relevant timeframes
- Trade in the direction of the higher timeframe trend to improve the odds on your trade
- An area of value becomes more significant when it coincides with a higher timeframe price structure (like support, moving average, etc.)
- Look to capture a swing if you’re trading against the higher timeframe trend
- You can use a trailing stop loss if you’re trading in the direction of the higher timeframe trend (with the hopes of riding a trend)
Now here’s what I’d like to know…
How do you use multiple timeframes in your trading?
Leave a comment below and share your thoughts with me.


Yes sir ..
I always thanks and really appreciate ur lesson… You are such a great mentor
Yes sir… Can u pls give our your signal group link for us to join… If available sir
Thanks
I don’t offer signals. Cheers
Real traders never do. Only those who can’t trade sell signals, because that is how they make money, not by actual trading.
This is true because, when I confirm their signal with my analysis theirs is always wrong and right sometimes.
Awesome!
Lovely concept. Thx
Anytime!
Wow….working effectively
Cheers Raj!
Thank you so much for this wonderful tip
Hi,I would like to use my multiple time frame :
Trading timeframe 5 min
Higher Time frame 30 mins.
Align the trend of both time frame and enter the trade at support and exit at capturing one swing as it reaches near the resistance, if against the higher time frame
If along with the trend in both time frame , then trail the Stop and exit as it reaches trail stop loss on moving avg.
Please suggest if I am mistaken.
thanks.
Hello, in the section “The secret to using multiple timeframes like a professional trader”, you have 3 points:
1. Take 1-hour multiply by 4, you get a 4-hour timeframe
2. Then, take 1-hour multiply by 6, you get a 6-hour timeframe
3. This means your higher timeframe can be between 16 and 24-hour
I don’t understand point 3, should it between 4-hour and 6-hour and not as shown above?
Hey Jo
Yes you’re right. It’s a mistake and we’ve fixed it.
Thanks!
Nice article,thanks alot Rayner
You’re most welcome!
Thanks for the explanation. It indeed helped me
You are welcome. Teddy!
Yes sir ..
I always thanks and really appreciate ur lesson… You are such a great
You are most welcome, Shankar!
You such a great mentor sir
Your lessons are inspiring
Thanks
You’re much welcome, James!
Hi, is all of this covered in the “PRICE ACTION TRADING SECRETS” book. I just bought the. pdf and received it, but have not yet had a chance to check. Browsing through your topics on the web now and was just wondering if all this is in the book.
Thanks and cheers. Very clear teaching, love it