A subscriber recently asked me…
"Rayner, what’s the one indicator you can’t do without?"
Without a doubt, I replied, “Moving Average” (MA).
To be honest, I wasn’t a moving average trading strategy fan in my early years of trading. I had thoughts like…
"Indicators are useless because it's lagging."
"Indicators are for newbies."
8 years later... I can tell you, I’m wrong.
The moving average is one of the most versatile trading indicators I’ve come across, and it can be used in different ways you never thought possible.
So, here’s what you’ll learn today:
- How to use MA to trade with the trend
- How to use MA to identify value on your chart
- How to use MA to set your stop loss
- How to use MA to better time your entries
- How to use MA to ride massive trends in any markets
- How to use MA to identify the best markets to trade
- A moving average trading strategy to capture big trends
Warning:
This isn’t a basic guide where you’ll learn the difference between simple, exponential, or weighted MA (you can google them yourself).
These are advanced moving average trading strategies that I’m using to trade the markets (and some of them you’ve probably not seen before).
Are you ready?
Let’s go.
How to use moving average to trade with the trend
I’m sure you’ll agree with me when I say that a downtrend consists of lower highs and lows, right?
But… sometimes you get a higher high in a downtrend, so does it mean the trend is over?
An example:
Rome was not built in a day, and no real movement of importance ends in one day or in one week. It takes time for it to run its logical course. – Jesse Livermore
Here’s the thing…
Just because you get lower high (and lower low) in an uptrend, doesn’t mean the trend is over.
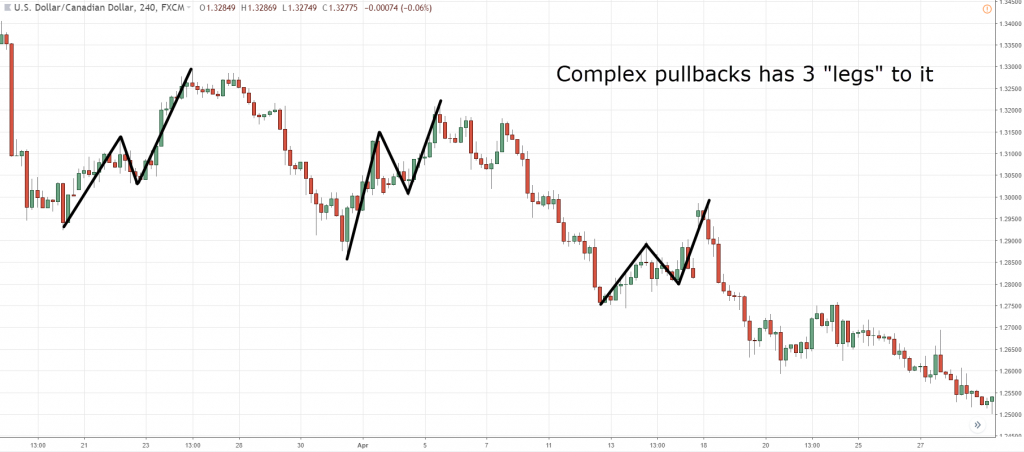
It could be a complex pullback, before the resumption of the trend.
Here’s an example:
So, you’re probably thinking:
"How can I better define a trend objectively?"
Well, you could use the MA indicator to help you.
Here’s how to read moving average and use it to trade with the trend…
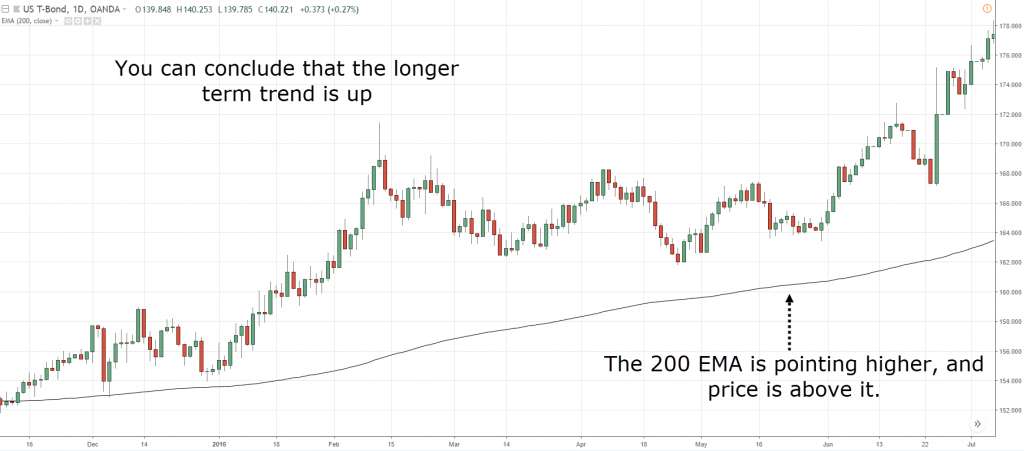
If the price is above the 200 EMA and 200 EMA is pointing higher, then the market is in a long-term uptrend (of your given timeframe).
And... if the price is above the 20 EMA and 20 EMA is pointing higher, then the market is in a short-term uptrend (of your given timeframe).
Does it make sense?
Next…
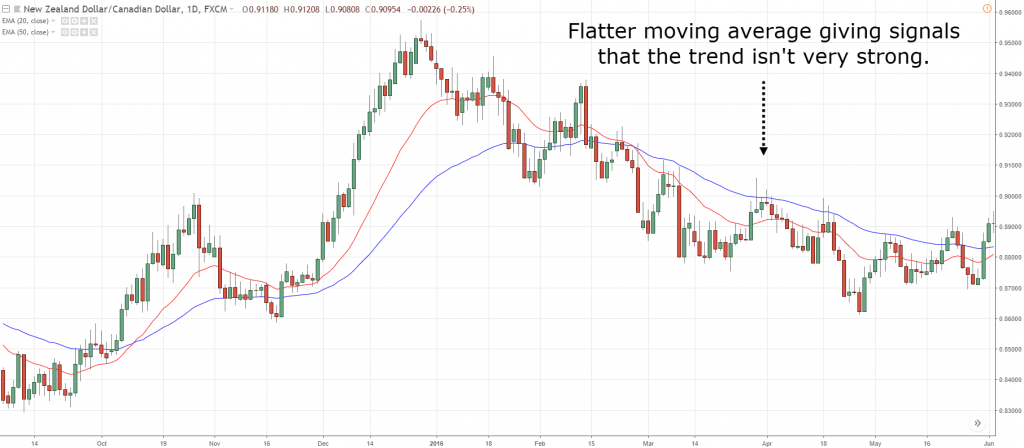
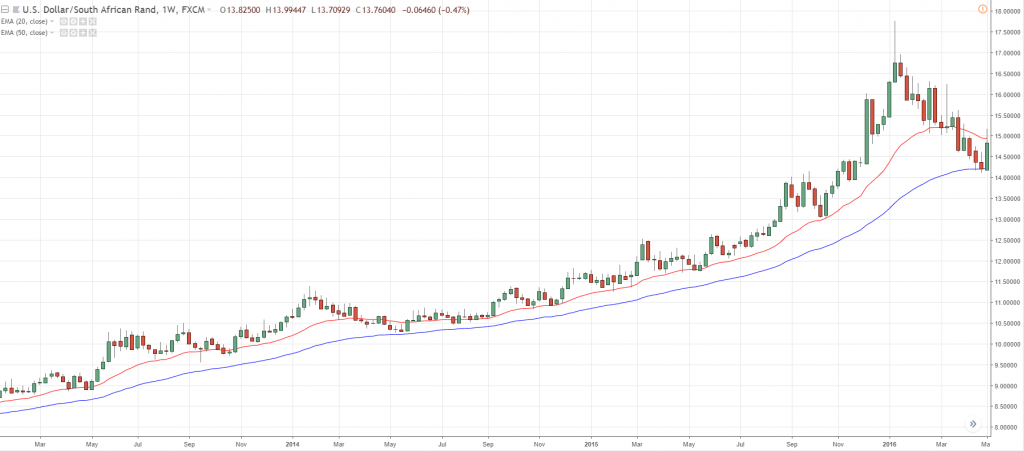
You can gauge the strength of a trend by looking at the steepness of the MA.
The steeper the MA, the stronger the trend. And the flatter the MA, the weaker the trend.
Here's what I mean:
If you want to learn more, go watch this training video below:
How to use the moving average to identify value on your chart
You’ve probably heard the saying “buy low and sell high”.
But the question is… how do you define what’s low and high?
This is where the MA indicator can help.
Now, you’re wondering:
"Which MA should I use?"
Here’s the thing…
There’s no best MA out there.
Rather, you need to find something that's aligned with your trading approach.
If you’re trying to trade long-term trends (on your given timeframe), then the 200 EMA would suit you.
If you’re trying to trade mid-term trends (on your given timeframe), then the 50 EMA would suit you.
Personally, I use the “space” between 20 & 50 EMA to define the area of value.
Here’s an example:
MA works best in trending markets. Avoid using them in range markets.
How to use the moving average to set your stop loss
Another term you need to understand is dynamic Support & Resistance (SR).
These are areas of value on your chart that's identified using MA (what you’ve learned earlier).
And this can be a powerful technique to set your stop loss.
Let me explain:
When the market is trending, price tends to bounce off at dynamic SR (which is an area of value).
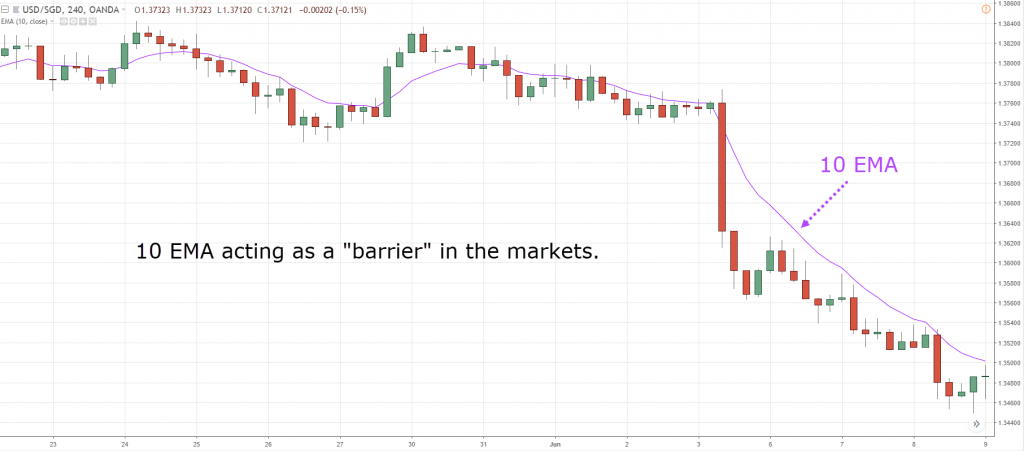
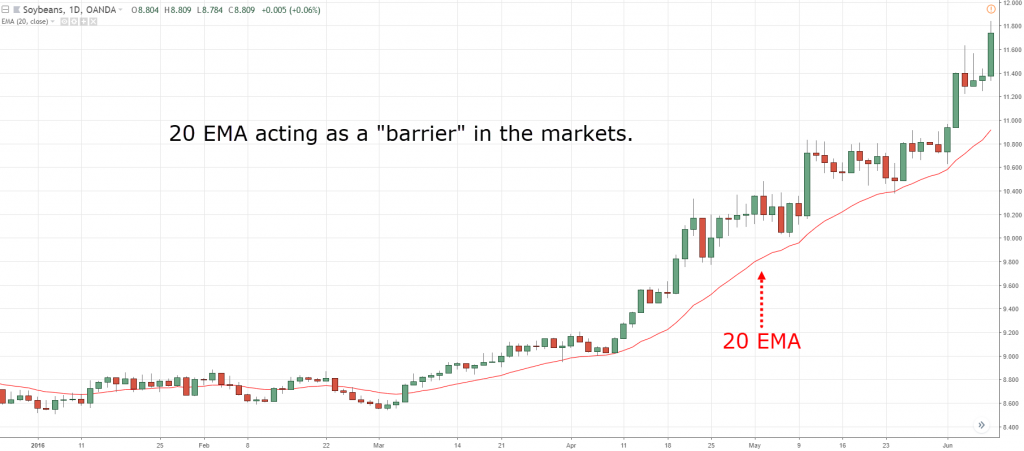
You can think of it as a “barrier” that prevents the price from going through it.
Thus, if you were to set your stop loss just beyond the dynamic SR, wouldn't it make sense?
Your trade will be protected by the “barrier” which reduce the likelihood of your stops being triggered.
Here are a few examples...
Dynamic resistance at (USD/SGD):
Dynamic support at (SOYBNUSD):
Dynamic support at (DE10YBEUR):
Does it make sense?
Great let's move on...
How to use the moving average indicator to better time your entries
Now:
What I’m about to share with you will greatly improve your trading entries.
You’ve learned that in a trending market, MA can act as dynamic Support & Resistance (SR), which is an area of value to trade from.
And, if you haven’t realized…
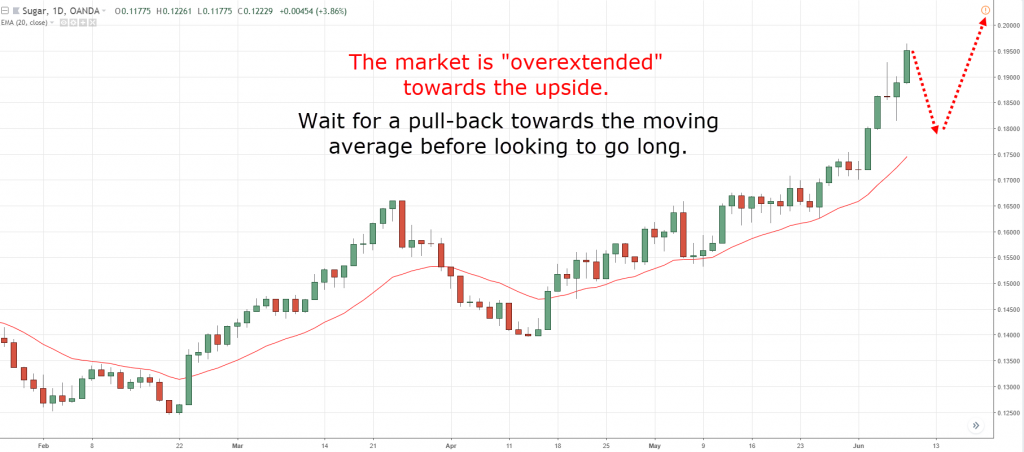
The market is like a "rubber-band". It will snap back if it's stretched too far away from the dynamic SR.
Now you’re probably wondering:
"How does this help with my trading entries?"
Well, think about this.
If the market “overextended”, then chances are it will pull back towards the MA.
Thus, if you’re looking to enter your trades, you’ll probably get stopped out as the market retraces against you.
So…
If you want to better time your entries, look to enter your trades at an area of value (like dynamic SR), and not when it’s far from the MA.
Makes sense, right?
Exercise:
Look at your past trades and notice how many of your losers are derived from trading far away from the MA.
You’d be surprised at your findings.
How to use moving average indicator to ride massive trends
Let me tell you a secret.
The only way for you to ride a trend is to have no profit targets. Why?
Think about this… if you have a profit target, what you’re doing is putting a limit on your profits.
And, how are you going to ride a trend if you limit your profits?
Now... I’m not saying having a profit target is wrong because swing traders do fine with a fixed profit target.
But if you want to ride a trend, then having a profit target is contradicting.
Now you’re probably thinking:
"Okay, Rayner. I understand I cannot have a profit target if I want to ride a trend. So, how to read moving average to ride the trend then?"
Simple.
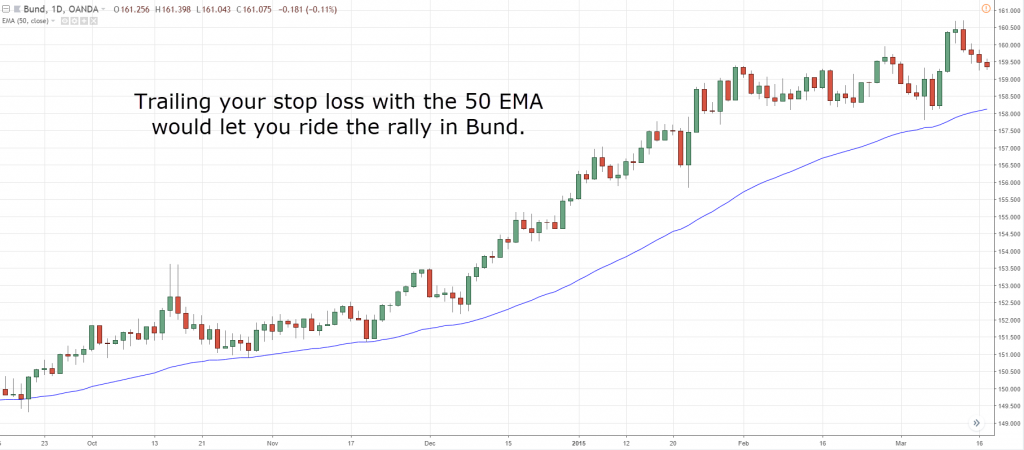
By trailing your stop loss. And the MA indicator allows you to do just that.
Also…
You’re probably aware that in a trending market, MA can act as dynamic SR.
And once in a while, it can be respected by the markets for a long period of time (and I mean really long).
Here are a few examples...
Riding the rally at (DE10YBEUR):
Riding the rally at (USD/ZAR):
Riding the sell-off at (BCOUSD):
Pro Tip:
The parameter of your MA will dictate the type of trends you’ll capture.
A short-term MA (like 5 EMA) will let you ride short-term trends. Whereas a long-term MA (like 200 EMA) will let you ride long-term trends.
How to use the moving average to identify the best markets to trade
Imagine…
You’re going to compete in a drag race, with a top prize of $100,000.
You’ve got two choices of cars. Bugatti Veyron or Toyota Vios.
Which will you pick?
You’re obviously going to select the Bugatti Veyron, right?
It has more horsepower, it's faster, and with a better braking system.
Now you’re probably wondering:
"What does it have to do with trading?"
Well, it’s the same.
If you want to long, you’d want to long the strongest market. And if you want to go short, you’d want to short the weakest market.
This allows you to pick the best market and have a higher probability of the trade working out.
So, how do you pick the best market?
By using a concept called, relative strength.
There are various methods to determine relative strength. But one of the easiest ways is to use MA.
Here’s my 3 step process…
Step 1: Pick the markets which are within the same sector.
If you’re looking at indices, then compare markets like S&P, Nasdaq, Dow etc.
If you’re looking at USD, then compare currency pairs like AUD/USD, NZD/USD, USD/CAD, USD/JPY, EUR/USD etc.
Step 2: Plot the 20 & 50 EMA on your charts.
Step 3: Compare the steepness of the MA. The steeper it is, the stronger/weaker the market
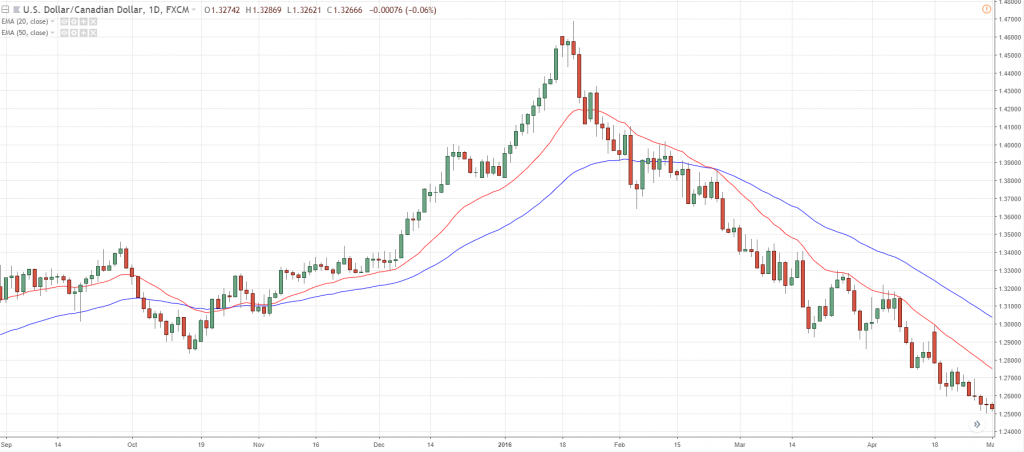
In this example, let’s compare the relative strength between USD/CAD and USD/JPY:
For USD/CAD, the MAs are steep and clearly pointing downwards at the moment.
So you want to be shorting USD/CAD instead of USD/JPY (because it's a relatively weaker market).
This is powerful stuff, right?
Let's move on...
A moving average trading strategy that lets you capture big trends
This is not an MA crossover strategy.
Instead…
You’re going to use the MA indicator to identify areas of value on your chart.
Then you’ll get an entry into an existing trend and ride it for all it’s worth.
Sounds good?
Here are 7 questions you need to ask yourself:
- Which time frame are you trading
- How much are you risking on each trade
- Which markets are you trading
- What are the conditions of your trading strategy
- Where will you enter
- Where will you exit if you’re wrong
- Where will you exit if you’re right
Timeframe
You must choose a time frame that suits your personality and schedule.
If you’re someone who holds a day job, trading the 4 hour and daily charts would be suitable.
Risk management
You must risk a fraction of your equity on each trade to survive the inherent drawdowns. Keep your risk to no more than 1% of your trading account.
Markets universe
You should be able to trade about 60 markets from these 5 sectors.
- Agriculture commodities
- Currencies
- Equities
- Rates
- Non-Agriculture Commodities
Here’s the exact moving average trading strategy you can use…
If 200 EMA is pointing higher and the price is above it, then it’s an uptrend (trading conditions).
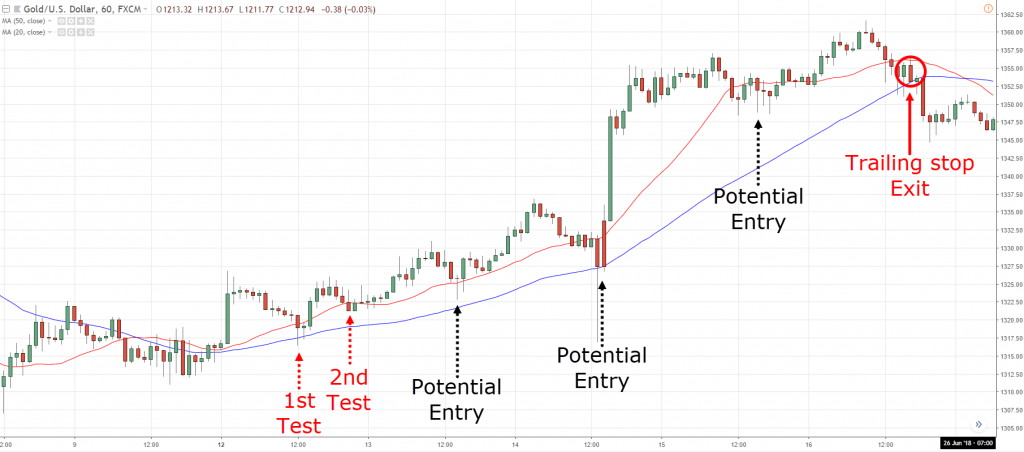
If it’s an uptrend, then wait for “two test” at the dynamic support (using 20 & 50-period MA).
If price test dynamic support twice, then go long on the third test (your entry).
If long, then place a stop loss of 2 ATR from your entry (your exit if you’re wrong).
If the price goes in your favor, then take profits when candle close beyond 50 EMA (your exit if you’re right).
Vice versa for a downtrend
Here are a few moving average trading strategy examples...
A winning trade set-up at (XAU/USD):
A winning trade set-up at (BCOUSD):
A losing trade set-up at (AUD/USD):
Some important considerations to ask yourself:
- Do you wait for price “confirmation” before entry?
- What markets are you trading?
- Which timeframes are you trading?
- How much will you risk on each trade?
There are no hard and fast rules for this trading strategy.
Instead, you’ll tweak the MA trading strategy according to your own personality and time commitment.
If you want to learn more Moving Average SECRETS, then check out this video here:
Frequently asked questions
#1: Hey Rayner, I see that you’re always using EMAs. But is EMA or SMA better for trend trading?
To be honest, there’s no best type of moving average to use. EMA is simply more responsive compared to SMA, because of the way the EMA is calculated.
But in the grand scheme of things, the concept is what matters more and not whether you should use EMA, SMA, WMA, etc.
#2: When you use the space between 20 & 50EMA to define the area of value, do you use that space to signal that the trend is going to continue? Or do you use that space to signal a change in trend?
The space between the 20 and 50EMA is to define an area of value, I don’t use it to determine if the trend is coming to an end or not.
But what’s for sure is this:
- If the two MAs start to converge, the market is going through a pullback
- If the two MAs start to diverge, it’s when the trend is continuing
#3: Can you elaborate on what you consider as short term, medium term and long term trend?
How the price respects the moving average is useful to help you define the type of trend (whether it’s a strong, healthy or weak trend).
But whether you consider a trend to be a short term, medium term or long term trend, will depend on your timeframe:
- For short term trends, you can look at timeframes below the 1-hour timeframe
- For short to medium term trends, you can look at the 1-hour to 4-hour timeframe
- For medium term trends, you can look at the 4-hour to daily timeframe
- For long term trends, you can look at any timeframe above the daily timeframe
#4: Should I change the MA’s period according to the timeframe I am trading on?
It’s not necessary. I’ll usually have 3 different moving averages to define the 3 types of trends:
- 20MA to identify strong trends
- 50MA to identify healthy trends
- 200MA to identify weak trends
So even when you change the timeframe, you can use those 3 moving averages to identify the type of trend the market is exhibiting. If the market respects none of the above moving averages, then you can just remove those moving averages.
If you want to discover more on how to read moving average and learn about different types of trends to level up your trend trading game, you can read all about them here.
To recap, here's what you've learned today...
The Moving Average indicator helps you:
- Identify the path of least resistance
- Identify areas of value on your chart
- Set your stop loss
- Better time your entries
- Ride massive trends
- Pick the best markets to trade
I hope this opens your eyes to how powerful MA can be, and you've managed to pick up a thing or two along the way.
Now here's the next step...










Just wanna give you a big shoutout Rayner for all your help and sharing thank you so much man.
Hey John,
You’re most welcome. Glad to be of help!
Don’t hesitate to let me know if you’ve got any questions, I’ll be glad to help.
Rayner
Hi Rayner, mind explaining a bit about 2 test. why the 3rd graphs example, the initial touches were not counted and until about half of the graphs goes on, only you consider the 2 test?
I hope you can clarify. Awesome job btw.
thanks.
Hi Kam, because price broke through the moving average.
Rayner. Question..If I’m trading futures on a 3min chart, would it be good for me to use the 9 Ema and the 20 EMA as a scalper. Also, would it make sense to have my 9-moving average as “exponential” and my 20-moving average as “Simple” Please let me know. I really enjoyed reading your article. Man you know your stuff
I’m afraid there isn’t a best moving average out there.
It boils down to what you want from your own trading and having the tools to meet your needs.
nicce bro
Thanks!
Considering each of the tests still penetrated a little bit, how much tolerance do you leave for the test to be still valid?
If it breaches the 20 EMA but not the 50?
You’re a good teacher.
Thanks, Johnson!
Thank you for the support!
Cheers!
Great concept and eye opener. Thanks buddy
Cheers
Thanks
Excellent stuff Rayner
Thank you!
You’re welcome, Karl.
Cheers!
Rayner
Rayner this is an eye opener I have read many books about moving average but the way explained urs its awesome thanks
My pleasure!
Hi rayner u r doig grt job by helpg ppl in tradg, u snt moving avrg trade importnce detls jus wannu knw, to see dt abve 200 sma line in 2 ‘o clk directn or min 4’oclock in downward directns. Which charts we shud use daily wekly or monthly to knw d directn of 200sma 50 sma n 20sma. Thx. God bless. Mandeep.
Hi Mandeep,
It depends on the timeframe you’re trading.
When I use 200 EMA, I’m referring to the long term trend of your given timeframe. It could be 5mins, daily or weekly.
Rayner
Thank you from Italy Rayner, inspiring as usual! Just a question: what do you think about Moving average crossover strategy? could you please write a post or a guide about it? thank you very much
Hi Tom,
For the moving average crossover strategy to work, it needs to be traded across a wide variety of markets, proper risk management, and willingness to ride the trend.
It’s actually a trend following strategy just that the entries and exits are based on moving average crossover.
I don’t trade it myself so I won’t be able to write a detailed post on it.
Rayner
One big disadvantage I’ve seen with crossover strategy is the wide stop loss that can potentially result in poor money management , by the time EMA cross the price has already moved a great deal of like 4 to 5 candles. I always trade crossover with 0.01 lot to minimize risk. My opinion, crossover to too much risk.
Thanks for sharing, Melusi.
Thanks Rayner
Don’t mention it, Thor 🙂
Rayner
Great stuff
Thank you, Faisal! 🙂
Don’t hesitate to let me know if there’s anything, I’ll be glad to help.
Hi Rayner; My name is Gordy and I am just getting starting in the trend following investment I would like to know which is the best free website for chart analysis you recommend.
Thanks, Gordy.
Hi Gordy,
Tradingview and MT4 are decent charting platforms.
You can check them out.
Rayner
Hi Rayner,
Why is USD/CAD weaker than USD/JPY?
I see that USD/JPY is more in downtrend than USD/CAD?
Can you please comment on that?
Anyway thanks for your support.
I am an old trader still turning in circles with no big success.
Andrzej
Hi Andrzej,
By looking at the steepness of the moving average, and the slope of the “price action”, I would conclude that USD/CAD is a weaker market.
Does it make sense?
Rayner
Dear Rayner,
I never came across MA got so much fuction.In naked platform with MA i think good enough to trade.Thanks
Hey Thooshiva,
Yes, I trade with just moving average myself.
I hope it can help you the same.
Rayner
One of the best articles of yours I’ve read Rayner. Thank you!
One question. I see you always use ema’s. Do you have any opinion about the merits of ema’s vs sma’s for trend trading?
Brett,
There isn’t much difference between EMA’s and SMA’s. Actually SMA’s tested out to be better when used in real time vs EMA’s. BUT it really comes down to preference since the difference is so minute.
I hope that helps.
Rayner do you make use of priceaction when determining your entries
Hey Brett,
I use EMA because it is more responsive.
But to be honest, it’s not going to matter a lot.
Rayner
these are great stuff. thank you Rayner
You’re welcome, Alvin.
Great to hear that! 🙂
Hello Rayner, from London, Ontario, Canada
Hi David,
Thank you for stopping by.
Cheers!
Rayner
Big thanks to you, Rayner! In the last part regarding possible entries in the chart pictures, are they short entries?
Hey Andrew,
Yes, the last few charts are short entries.
Hope that clears up 🙂
Rayner
Confession time 🙁
I have been learning so much from you about trend following and MAs but I get caught up with other Indicators and have saved various Templates each with a combination of Indicators. Result CONFUSION AND MORE CONFUSION
I end up staring at the screen and not being sure what to do!!!! And when I do, I end up in a mess and just wanted to give up almost every few days!!!!
After reading this post I changed all the charts to this simple MA strategy and they look so clean and amazingly given clear indication of what’s happening!!!
I will report the progress, hopefully a great one 😉
As always thank you Rayner And God bless!!!
Hey Nat,
I know what you mean. I did the same thing before too.
But what I’ve learned is… KISS.
Looking forward to hear your updates!
Rayner
Dear Rayner, thank you for your generous sharing.
You mentioned “Personally, I use the “space” between 20 & 50 EMA to define the area of value.”.
I don’t quite understand this remark. Does it mean when price falls in the space between 20 & 50 EMA, it gives you a clearer signal of either continuation of trend? or transiting to change trend?
Thank you very much.
Hi Promise,
The space between 20 & 50 EMA acts as dynamic Support & Resistance.
So this could be an area for trading opportunity.
Rayner
Hi Rayner. If I trade on TF5min and i set my sma10 and sma20 for my support and resistance is this recommended as i am a day trader. Thanks.
Hey Nazda,
Yes, it works fine for day trading.
Rayner
Hi Rayner, I have to admit that my trading development over the years was similar to yours. MA (actually I’m using Exponential) I have to admit is my only indicator I utilize.
One tip to you – I have observed that the 10th is some kind of MAGIC number as long as the MA is concerned starting with 10 month, 10 week, 10 day, and so on drilling down to the smaller time frames. Frankly I do not use the typical 5, 20, 50, 200 MAs but only 10th however plotting it on different time frames.
One more thing is that as every rule also the 10EMA has its peculiarities. Most tradable assets usually obey the 10 EMA (month/week/day/hour) however, some of them tend to deviate from it. So to speak, they have their own manner and slightly differ – e.g instead of 10 they obey 12, 15, or something around.
Hope it is to be an useful tip for trading improvement.
All the best,
Emil
Hi Emil,
Thank you for sharing.
Yes, the 10MA is useful when the market goes parabolic.
I use it myself in such a scenario.
Rayner
Hello Rayner,
How do you use the 10 MA for parabolic? How were you guided?
Thanks a lot!
Hi Bethel
I don’t trade parabolic moves. But if you do, the 10ma would be useful.
Thanks Rayner; Another great trading secret from you again . May you be blessed more
Tom
You’re welcome, Tom.
Cheers!
Hi Rayner, thanks for sharing the complete guide to trend following
appreciate your guidance cheers mate
You’re welcome, Khan.
Don’t hesitate to let me know if you’ve got any questions, I’ll be glad to help.
Combine MA , CCI with price action and knowledge of market structure then you have an awesome trend following method that you can use to extract from the financial markets. This can be used on any instruments. Rayner has just shown you a simple way to trend trade, that only can improve your trading drastically. Do your homework, do your backtest, develop confidence in your trading ability then patience will follow and you are good to go. Forget about the get rich quick strategy sold by scammers. This is the way to trend trade, all traders I known who are successful trend follow.
hey Joe,
Thanks for sharing, that’s a good process to follow.
Cheers!
Thanks Rayner for sharing how to use MAs indicators to trade in particular the complex pullbacks (not quite sure at this moment how to identify when exactly the trend is continuing or reversing) ‘cos the price bars may be fluctuating up and down around the 20 EMA. When you wait for the pullback and trade in the direction of the medium and long term trend, the price may go the opposite direction right?
Also, can you elaborate what you consider as short term, medium and long term trend? e.g If I trade the D1 timeframe, does short term refers to number of duration in days? and medium refers to weeks and long term refers to months? A bit confused here.
Hi Rae,
Yes, anything can happen in the markets, it’s never 100%.
Short term is relative since it depends which timeframe you’re looking. What I’ll do is pay attention to the 20ma.
I did read the Adam H Grimes site that you had a link to on the complex pullbacks, unfortunately the explanation is rather confusing for me to understand.
Which part of it confuse you?
What are the qualifications for you to say that the trend have changed? Like with the video where you presented the head and shoulder, the head part made at least 3 HH and looked like the with the MA the trend is changing. what made it not qualify as trend of change? thanks Rayner!
Hi Kelvin,
I use a simple 200ma to help define the trend.
If it’s pointing higher and the market is above it, I conclude the trend is up.
Rayner thank you for sharing ,
I also use MA’s but use the 8/20 short term charts( 6renko,5 min and 15min) and 8/50 ema longer charts(60min, daily weekly).
I daytrade, always out at eod, done overnites ,longer term and burn me bad, no more for me.
I still not consistent trader but the KISS system I am using with MA’s is working little better for me.
I also use dynamic S/R an, a momentum indicator and the RSI for direccion confirmation, because I am unsure sometimes of what I am seeing.
Do you recommend different different indicators or none, and just MA’s angle for daytrade trend?
Thank you for all your help
Jay
Hi Jay,
I stick to 20, 50 and 200ma and use it across all timeframes.
There’s no best moving average out there, it depends on your trading goals (like how long you want to ride a trend etc).
Great introduction to moving averages. I personally like to trade using 5 EMA with 50 SMA and confirm the trend with a 200 SMA. I copied this set up from a trend indicator based on MAs and ADX (http://mt4trendindicator.com) . I use ADX to filter crossover signals but my personal best result is trading of simple pullbacks on 1H charts. Don’t rely on MAs on very low time frames. I would say 1H and above is best
Hi Pete,
Thanks for sharing your insight, appreciate it!
“Indicators are for newbies.”
That is exactly how I thought as well so I binned all of them. I have always been drawn back to averages and reading your article has convinced me to look into them again.
Great article Rayner thank you.
Hey Grant,
Glad you see them in a different light now.
Don’t hesitate to let me know if there’s anything, I’ll be glad to help.
Hi Rayner, i would like to ask you if you ever tried to trade with renko or range bars.Please share with opinion about them
Hi Shohruh,
I’ve not used them in my trading so I can’t comment on it.
Hello Rayner. I base my entries off the 5 min charts, and use the 4 hr and 30 min higher time frames to spot the overall trend. Also with that, I use the 20 ema. Thank you for sharing your insight. I love seeing what experienced traders are doing.
Hi Greg,
Thanks for reaching out. Glad to know it helps. Cheers!
Thanks Rayner
Great help to those traders who really interested in trading like me. Thanks Rayner, I am learning a lot in all your articles.
Awesome to hear that my friend!
Don’t hesitate to let me know if you’ve got any questions, I’ll be glad to help.
You have made excellent points on this post – very useful – thank you for sharing.
I use slow moving EMA’s and Fast moving EMA’s looking for crosses (to enter trades) and as dynamic resistance.
Hi Andrew,
Thank you for sharing your thoughts, cheers
Hi. Thanks for your help. That was a good explanation. What’s your opinion on custom indicators based on moving averages. For example the one on mt4trendindicator.com. Do you think it’s worth the money?
Hi Marta,
I’ve not used it… so I cant’ comment on it.
Great post. More in this article than in many paid for trading systems! Thanks for sharing your knowledge.
Awesome to hear that Tim!
Don’t hesitate to let me know if you’ve got any questions, I’ll be glad to help.
Hello Rayner,
Thank you for this valuable post …
in the USD/JPY daily, there is 3 EMA crossover , the second one 20 cross over 50 showing an up trend ( looks the down trend is over ? ) and even 20 EMA become dynamic support
after some days the trend came back again to the original downtrend..
i felt many times in this trap and trade long at the second cross over…. trade against the main trend.
HOW to filter out this false signal and do not fall in this trap again??
Regards, thank you for your time
Paradise_in
Hey Paradise
You can use 200ma as a filter. If it’s pointing higher, you look to long. If it’s pointing lower, you look to short.
Hope that helps!
Thank you, sounds very logic, another question please,
how to scan the market for a pair with a strong Trend..
i am a day job Employee, i can not look long time for charts
This will be very helpful
Thank you in advance
Paradisein
I don’t use any scanner. Everything I do is manual.
thanks a lot sir.very good strategy of MA
You’re welcome, Rahman.
Cheers
Thanks very for your comprehensive , excellent article. I have to read this article many times and paper trade it. Is there a direct link to download the proprietary trading spread sheet. ?
Wari
Hi Wari
You can drop me an email and I’ll send it over.
cheers
Hello Rayner
I like your video, simple and concise. Keep up the good works. As I am trying to work on my risk management and strategy, I have a few questions which I hope you can assist:
1. price often stick on the 20ema trend line instead of clearly abv or below it. So in that case, how do we determine the entry point?
2. In one of your video on Stop Loss, you said that we must not have a stop loss value, say 100 dollars but let the price action determines where to put our SL. If I use Moving average strategy, where would the SL be? Once it is set, must I then fall back into my risk management to ensure it is within the limit? I often find on chart , it is much higher than the preset SL i want in risk mangement.
Thank you !
Hi Desmond
To set your stop loss you first need to know what is the price you’ll get out.
Then have a position size that suits your stop loss level so you don’t risk too much.
Here’s a post that explains more…
https://www.tradingwithrayner.com/forex-risk-management/
Thanks as always, your kindness is awasome
Cheers Themba
Another exceptional lesson from Superman :). Keep up the good work Rayner
Thanks Mike!
Hi R ayner, thanks for the indepth Moving Average sessions. Keep rocking as always. Have you ever used the Hull Moving Average (200HMA & 10HMA) in your trading. Please kindly give me a feedback when you can.
Hey Josef
I’ve not used it myself.
Hello Rayner ,
should we change the MA ” number ” ?
let say we use / change Time Frame 1 day , 4 hour , 1 hour , 15 minutes , 5 minutes and how to calculate it ?
thanks
Hi Hendrie
I don’t change them.
But if you want to have a 200MA appearing on the 15mins chart, then it would be 800MA on the 15mins timeframe.
Hey, Reyner.
How would you identify a trend when using weekly candle charts.
If there is a downtrend in daily charts and the uptrend is still shown up on weekly charts, which one should be considered for decision making?
Hi Sai
My approach is simple.
If price is above 200ma on daily, I stay long. And vice versa for shorts.
I don’t look at weekly moving average.
cheers
Hi Reynar
I like using the 5 and 10 minute timeframe. which MAs are suitable for these timeframes. cheers.
Hey KB
There’s no best MA to be honest.
I explain more in this video here… https://www.tradingwithrayner.com/which-is-the-best-moving-average-to-trade-with/
Great insights as always! I discarded most of the indicators I kept on using before (with no great success) and used mainly MA for entries and exits, and it works a whole lot better! Thanks Rayner 🙂
Awesome to hear that, Francis!
Hi, My Super Trade Prof.
I’m enjoying my studies so far. All this info. you’re sharing is so enormous I get this need to learn more before rushing to start my live trade. In 4 to 5 months I hope to be ready to make my lecturer proud.
1000 Blessings, Peace & Health!!!
Awesome to hear that, Raymond!
Looking forward to seeing your progress bud.
Awesome Stuff Rayner!!!
Thanks a lot for sharing those really valuable tips. Your detailed post are increasing confident in us day by day.
You Rock!
Cheers,
I’m happy to hear that, Ram
Hi Rayner my friend,
Thanks a lot. It makes things look very easy . Thanks and have nice trading week. Zahl.
You’re welcome, Zahl.
cheers
Hello Rayner
I have been using EMAs to set my stop losses and sometimes Take profit targets, especially in down trends.
Successfully or not ? It’s a mixed bag at the moment. I am still trying to figure out why I am not consistent.
Simango
Thank you for sharing, Simango.
thanks a lot for all the information it is very helpful
you’re welcome, albert
Hello Rayner
I think I saw a comment to say the 20 EMA is good for USD/ZAR market but can’t find the comment.
Can you comment on that again please?
What comment was it?
Hi Rayner,
I’ve been using the 10 and 20 EMA. When the two start diverging, I would take it the trend is becoming stronger and that’s when I would go long/short.
After becoming a member of your community and watching a few of your videos, I’ve just recently added the 200 EMA and realised that it’s been great help. Thanks to your can now see long-term trends.
Awesome to hear that, Thami.
best!
beautiful stuff, my man
thanks bud!
Awesome Rayner!, after reading your strategy and trading Plan, it has made my day
Thanks very much, lookin forward to have more support from u
Awesome to hear that!
thanks alot man. i wish i knew how to read the MA a long time ago as i have suffered serious losses so bad that it even affected my physical health. however it still has not deterd me from trading in the future i just take it is an extremely tough lesson. maybe im stubborn or stupid but i refuse to quit. i only fail if i quit. thanks ryaneer
Keep on going Adel!
Rayner- You are the champion for trading, never seen a person who could put these in simple terms as you have done
Do or die, I threw my all other indicators from my screen beliving you as my god father, ( you are too young to say that mate..lol)
thanks a lot for being so generous, hats off with lot of respect, every dollar we earn we owe you
I appreciate the kind words, Darshana.
Don’t hesitate to let me know if you’ve got any questions, I’ll be glad to help.
Thanks rayner for simplifying the use of MA..you are a great coach.
Hi Lawrence,
You are welcome!
Hey Rayner,
great article, I am Roy from London england.
Man i had so many indicators on my chart and was losing money, so i now have a clean chart with just ma’s and trade higher time frames and i must say no more stress and i just follow the rules and now i am consistent in making money…i still lose trades but i win most.
thank Rayner. leep teaching bruh!
I’m stoked to hear that, Roy!
cheers
Hey Rayner,
I actually don’t use the MA at all in my strategy anymore. I don’t use any indicators now. I like my charts completely naked and only trade using lines of support and resistance. Thanks for your tips on entries by the way. It has greatly improved my recent trades!
awesome to hear that bud!
Hi Rayner , A big thanks for sharing your info.
One of the things I picked up on “You should be able to trade about 60 markets from these 5 sectors.” Currently I follow 20 markets but have only traded 8, obviously I could be missing something. Could you please send me the list of the 60 you trade
I trade commodities (soft and hard), bonds, currencies, indices, energy. You should get 50+ easily from these lists.
it is impossible that an MA acts as a barrier. MA’s are lagging indicators
Impossible is a strong word.
Dear Rayner, You explained it nicely. I am also following same strategy since last year and making potential profit after wasted too much pips by using other strategies since last 7 years. Finally came to know that this is the best strategy. Only need to be careful while trend is choppy.
cheers bud
Was not able to download the MA Bundle. Thanks
Feel free to drop me an email and I’ll send it over.
Hi Rayner, thanks for your explanation here.
May I know if there is any meaning for gap between MA20 & MA50? Does it mean area of value?
And for the following statement:
“Personally, I use the “space” between 20 & 50 EMA to define the area of value.””
What does it really mean?
Yes, an area of value. Just like Support and Resistance.
Hi Rayner, thanks for the article, its mind booming. For long term, can we use 200 MA instead of 200 EMA? Whats the different between these two indicator. Thank you.
Not much difference except the way they are being calculated. You can use sma.
Hi Rayner,
I learned a ton today on MA strategy. Great stuff!!!
Thanks for sharing your knowledge and experience. Very well appreciated.
Happy New Year!!!
You’re welcome bud!
Happy new year!
Hi Rayner, great guide on MA.
I might missed something on using MA to gauge which market to trade via relative strength.
What do you mean by the steeper the MA, the better market to trade?
It means if the moving average is pointing sharply in one direction, chances are there is momentum and strength in that market.
I have been a price action student for 2 years now and I could not fine tune my trading strategy.
Your MA post is real big AHA moment for me.
God bless you Rainer for sharing such detailed knowledge.
Awesome to hear that!
Hi Rayner, I would like to know if I want to make my entries in a 15 Minutes chart, do I still use the 20 ema 50ema and 200ema? Or first I confirm the overall trend in 1 hour time frame and then I come to lower time frame 15 Minutes chart with the same settings of MA for timing entries?
There’s no right or wrong to it.
Generally, I look at the higher timeframe for trend bias then wait for setup on my entry timeframe.
A enormous and fruitful knowledge providing with which we can trade with the enough , required confidence. A heartly many many thanks to you.
You’re welcome, Harsh!
Hello my friend in your video you are saying about 2 0clock and 4 o clock for MA for strong or week to find the trend…
what is means by that? where i can find the 2 oclock and 4 o clock ?
I’m referring to the steepness of the moving average.
Using the clock direction as a guideline.
hi rayner i love you so much i cant believe you give out this information free to people you dont know even including me habaa i never come across somebody like you before ,you are one in a million and i count myself so bless to be one of your student …..but i have one question sir what trading platform are you using for trading is it MT4 OR MT5 OR TRADINGVIEW or IQ-OPTION….because i want to trade commodities (soft and hard), bonds, currencies, indices, energy and futures but i cant found it in MT4 and MT5…PLEASE I NEED YOUR REPLY……..Which platform you think is the best for trading please i need your opinion …thank you my mentor
I’m using tradingview for charts, not for trade execution.
Thanks Rayner
You’re welcome!
Great stuff. Thank you Rayner
Regards
You’re welcome!
Thanks Rayner, I am learning a lot in all your articles.
I’m glad to hear that!
Rayner you are a king man!!!!! Thankyou so much to you!!! This I wanted for so many years but now you a gift from God!!! May he bless you more and more!
You’re welcome bud!
Hi Rayner,
Thank you for adding the Comments Column to your Teachings, as these are a valuable source of information, and confirmation, in helping traders confidence, and decisions . There is so many Variables in trading .
I Value your Advise.
I’m glad to help, cheers.
i was charged 500$ for these strategy… Thanks Rey
You’re welcome bud!
hi Rey, thx for your tutorials.
if the 200MA is trending down but the 50 MA and 20 MA keep crossing each other, is that a weak trend?
I don’t just a weak trend based on moving average crossover.
I look at the depth of the pullback. If it’s beyond 50MA, chances are, it’s a weak trend.
Rayner ,you’re simply the best teacher I’ve met in years. Thanks for the illumination,I am blessed meeting you.
The pleasure is mine!
You’re simply the best teacher I’ve met in years. I benefit immensely from your wealth of knowledge, I feel really blessed meeting you. Thanks a bunch Rayner!
You’re welcome!
Why have to wait the price test dynamic support twice.
To “confirm” the market respects that area of value.
Thank alots..
cheers
When trading non-currency pairs, are we violating the 3 day PDT rule if we do not have more than 25K in our account?
I’m not familiar with that rule since I don’t trade stocks at a high frequency.
U are the best teacher ever.ur articles are mind blowing, well simplified, clear and precised. I have learnt a lot within a short period I stumbled upon ur site and for free. Thank you so much. May God reward you. Ur fan from Nigeria.
I’m happy to hear that!
The way you teach with absolute clarity and precision blows my mind. Thank you for simplifying forex trading with the priceless information you share for free. I’ve learnt so much from you . God bless you. From Nigeria.
Awesome to hear that, cheers.
What timeframe do you recommend If I want to be a daytrader. Open and close a trade the same day.
Possibly 15mins and below.
And what should be EMA for day trading?
There’s no best or specific ema for day trading. The concept is what matters.
Thank you Super teacher’
Cheers Jp
Really outstanding article. Well done!
Thank you, Lawrence!
Rayner,you are simply the best forex trading teacher I have ever met online.Andy from Nigeria.
Cheers Andy
Rayner! you’re the Ultimate source of guidance in trading! thank-you! 🙂
I’m glad to be of help!
thanks Dr Rayner im humbled to have meet you online ,these leasons are opening my mind ,im a new trader and i have learnt alot thanks i will continue reading you podting and videos they are very helpful.
You’re welcome!
Hi Rayner, love the explanations and clarity. One quick question are you saying to add the 200EMA, 20 EMA and 50 EMA to each chart? I have been using the 15m timeframe. Is the rukle the same for the 1HR etc? Cheers Gareth
Nope.
Focus on the concept, not the moving average.
Ask yourself, what’s the purpose of the moving average, and then add the relevant MA that suits your needs.
Very insightful!! Thanks a ton Rayner!!
My pleasure!
Thankyou Theo for all those pro advice nothing but the best Andre G
You’re welcome, Andre!
The angle of the MAs is dependent upon the aspect ratio of the chart display which depends on the extent of time displayed and extent of price. By changing these parameters, the angles can be anything that you choose, i.e., arbitrary. So, how do you set up your charts so as to be consistent and display the correct angle of the MAs?
I use the default settings on Tradingview.
than you i have learnt something
Awesome!
Hate the fact I have to wait days and days to see if I get a third touch on the dynamic SR, only for it to potentially stop out
That’s the cost of doing business.
Or else, you can adopt other strategies that compliment you.
Great teachings, you’ve actually made me understand the MA better. Thank you Rayner.
I’m happy to hear that, Richie!
Hi Rayner, Its amazing how your training videos and emails has opened my eyes in my quest to learn trading forex. I believe very soon I shall become a better trader learning from you. I started trading without proper training and that resulted me losing my equity. Your training has opened my eyes to why I was having series of loses in my trades. I have stopped live trading for now and has committed to study and demo trade and perfect the art trading before going live again. Thank you so much for being so open to educate people like us. I eagerly look forward to joining your trading community
I’m happy to be of help, Emmanuel!
cheers
Hi Rayner, thanks for all the wonderful tutoring. As a beginner, I am learning and discovering. However, so many questions come up in my mind but as I keep on reading I get answers. I hope all will be answered, but what’s the difference between EMA and MA.
Also, please tell me the what trending and range markets are.
Thank you.
The difference is the way the moving average is calculated.
EMA is more responsive compared to SMA.
Hey Hey what’s up my Friend,
Thanks for the post Rayner, awesome stuff!
Please regarding setting the stop loss away from market structure and having an R:R that gives one an edge in the market.
If the stop loss is placed away from market structure, how can one get an appropriate profit target that still gives one an egde in the market?
I ask this because when the stop loss is away from structure, the risk of the trade would be pretty high compared with the profit target.
And so if the stop loss is hit, a larger part of the trade capital will be affected; and not sustainable longer term.
Just to be sure, I believe having an edge in the market means a combination of having an R:R of say 1:2, and, using a fraction of one’s capital in the trade.
Cheers.
Hey Rex
1. You should use proper position size to reduce your risk if you have wide stops
2. You can have a risk to reward of 1: 2, but if your winrate is 10%, you still lose money in the long run.
Your risk-reward ratio is only half the equation, your winning rate is the other.
I explain more here… https://www.tradingwithrayner.com/risk-reward-ratio/
Thanks Rayner. I appreciate.
Thank you Rayner for a great work done, do you have telegram group that we join?
Yup, the link is on the top menu.
Hey Rayner
Thanks for this article.
I usually use 20/50 EMA. They help a lot.
Thanks for sharing, Sandeep!
Hi Rayner
I got a question: while using MA, do we have to give importance on closing price or candle as it will be clear sign of trend change?
I’m not quite sure what you mean, could you elaborate?
What I mean to say here: sometimes there is a spike which violates the stop loss however at the end of the day, the price doesn’t close near or at stop loss price. Just a violation of the level.
In that case, you can wait for a candle close before making your exit.
However, if the price close strong against you or gaps against you, you could lose more than 1R on the trade.
please teach on stock my request indian stock market
nse
how do i get that pdf please Rayner
Very good
Cheers
Awsome
cheers
Great mentor of all time
He explain everything in trading for understanding
Thanks boss
Glad to be of help!
I felt alot of hesitations during my entry and exits from trades .Now i have a clear idea regarding MA .Rayner thanks for this
You’re welcome!
Hi Rayner!
First of all, thanks for all the quality stuff you share for free on your website!
Much better that some paying stuff found elsewhere on the web!!!
Concerning your trend following method using the moving averages.
Often you’re talking about 20MA, 50MA and 200MA.
But sometimes you’re talking about EMAs instead, like on this page.
By experience, which ones you think are the “better” ones when using this method? Is there an advantage to use EMA instead of MA?
It doesn’t matter.
The concept is what matters, not the exact parameters.
Best!
Sir,
Your analysing is amazing , who don’t know market, they can easily understand after reading your articles, you are the best analyser to market beginners.
And can you explain about the option trading ….
I’ll look into it, cheers
Nice article man…. Always love your explanations. I was wondering, once you set your EMA 20 and 50, what is the signal to trade? I don’t seem to see any signal that I can use to initiate the trade because from my experience the price mostly don’t respect the EMA areas but they still come back in that direction. Thanks
First, I define the type of trend the market is in, whether it’s strong, healthy or weak trend.
In a strong trend, the price tends to respect 20ma, for healthy trend it’s 50ma, and for weak trend 200ma.
You can learn more here… https://www.tradingwithrayner.com/trend-trading-strategy/
Ultimate piece of knowledge
Hi Rayner my mentor really the staff I have learned from you today and the past days is very powerful . I strongly believe that my trading career will definitely going to reach the new heights , I feel that I have acquired the knowledge which I have been looking for a very long time . I am going to practice this staff so that I can be a better a trader than before. And I feel I am a better trader from what I have learned from your staff my mentor. I thank you very much.
You’re welcome! Let me know how it works out for you, cheers.
Hey Rayner, you are really good, since I started watching your videos, my skills have improved, but I want to do more
Thank you very much for the tutorial …from Nigeria
I always don’t get it,i follow the trend but keep losing
Nicely explained rayner
Thank you, Laxman!
I just want to say a big thank you for opening my eyes of understanding in trading forex, am so grateful…
You’re welcome!
Thank you Rayner for all the materials that you are sharing. I just started binge watching all your youtube videos and reading all your posts and I like to say that I like them very much. Very clear and simple to understand. Thank you 🙂
You’re welcome!
Thank you very much Rayner, I have never been this addicted the way am addicted to your blog, the reason is because it is littered with values. May God bless you daily more and more.
Please can you find time and talk about “Elliott Wave Theory ”
? Thanks
Ijakpa from Nigeria
I’ll look into it, cheers.
NIiice information Rayner
Thank you, Manoj!
A very very useful article! Thanks a lot!
My pleasure!
Hi Rayner
Was thinking of giving up trading thinking that its a time waster. thank you for all the lessons and videos they are eye openers too much info. you such a great Mentor KISS….God bless!!!Am pretty sure by mid year i will be right on track, practice, practice and practicing…
Yes it is helpful for me according newbie and more interesting when u plan out big bcoz I believe in wrt mentorship
Hi sir it high probability chance system & moving avg system is superb Iam from INDIA plz tell me one intraday 5 Min tf with rsi system plz sir
Sir,
I am trader biginner in Indian stock market.Can you please provide a good strategy for mid term trading, Entry and Exit in a stock.Please
[…] The Moving Average Indicator Guide: How it improves your trading strategy and helps you beat the mar… […]
Thank you for your kind-hearted….. The analysis is helpful
My pleasure!
it impressive. i am grateful. looking forward to something great as i exercise self-discipline with your wonderful tools.
Awesome!
You have a real talent for making difficult concepts understandable, Rayner. I can’t thank you enough, I am soaking your information up like a sponge.
You’re most welcome, Indi!
Pls talk more about stop loss and take profit pls
Hey Francis,
There is a lot of content from Rayner about that. Check the links out
https://www.tradingwithrayner.com/trailing-stop-loss/
https://www.tradingwithrayner.com/set-stoploss/
https://www.tradingwithrayner.com/stop-hunting/
Your take profit should always be before an area of value.
Cheers.
Really it is immensly helpful
and thanks for sharing
You’re most welcome!
Thank you very much
My pleasure!
Good Job Raynor
Cheers
Your lesson has helped me alot
Glad to help!
You’re a trading legend. I can to compare who is the best but i suggest you are the one
THANK YOU SO MUCH RAYNER.
Hey Vishnu,
You are welcome!
Great knowledges
Hey Fauzi,
Thank you!
You’re one of the best master who feeds me your expensive knowledge for free .thank you
Hi Bona,
Thank you very much!
badiya
Very helpful
Hi Nikhilesh,
You are most welcome!
Hi Rayner.. What must I do when the price action crosses 20EMA and 50EMA in a downwards direction(bearish) and also the 20 and 50EMA intersect for sell signal while 200EMA still pointing in upwards direction? Should I go for sell signals in respect of 20 and 50EMA since they’re in bearish direction or I should wait for 200EMA to confirm the sell signal?
Hi Katlego,
Check this post out…
https://www.tradingwithrayner.com/200-day-moving-average/
Hey Rayner! Thank you very much from the core of my heart. I am amazed you are so logical and kind to offer help. I am from India and normally trade Bank Nifty, very hot to handle. I request you to make a video where the examples are from Nifty and Bank Nifty. I am sure the Indian traders will love it. Thanks a lot buddy!!
Hi Rayner, I think in another post you seemed to prefer the 50 EMA, and here you are talking about the space between the 20 and 50 EMA. I would want to know what EMA do you prefer today? Thanks for everything Bro.
Hi Juan ,
The space between the 20EMA and 50EMA is being considered as an area by him.
20EMA and 50EMA are mostly used, you can tweak and backtest. Know the use of the Moving average.
Remember support and resistance is not just a line. Trading the trend once the price crosses the area of support and resistance
it’s a possible indication of a change of trend and an exit.
Cheers.
Thanks so much!
Hi Juan,
You are most welcome!
Hi Tochukwu! I have recently discovered the power of the EMA’s. I am constantly watching stock prices movements and I am really surprised about the respect of the EMA’s. It seems to be an excellent way of buying support.
Hi Juan,
I’m glad to hear that. EMA and SMA are your dynamic support and resistance. Price tends to respect those areas.
Cheers.
Hi Rayner Team, what would be the best ‘entry’ for the strategy? I understood that the best entry is a ‘green bar’ o a ‘strong price rejection’. I am right? Thanks.
Hi Juan,
There are lots of entry techniques depending on your trading style.
Check out this post…
https://www.tradingwithrayner.com/the-maee-formula/
Thanks very much Tochukwu. Nice article. I am a novice trader, but I think I have a sensible system. Swing trading in hot industries stocks, buying in areas of value like structural or dynamic supports. BUT, I think I was making a mistake leaving aside the importance of the bullish candlesticks. In your opinion, it was a serious mistake? Or it’s no so significant the candlesticks?
Hi Juan,
Good to know. Bullish candlestick as a false break could help in your system.
Check out this video…
https://youtu.be/ScxDvXVX5yc
Thanks bro, I will watch it now 🙂
Hi Juan,
Goodluck!
Cheers.
U are a blessing,
Hi Apreala,
Thank you!
Cheers.
U are a blessing, Rayner. Thank u. I’m learning from u in Nigeria.
Hi Apreala,
You are most welcome!
Cheers.
Hello Rayner
You are awesome. You’re doing excellent thing by teaching retailer like. I’m improving my trading following your valuable tips.
Live long
Thank you. Tayab.
Rayner, you just give us so much free information that has value in and make comments sense in every word you spoke. Thanks for your time and generous. Also I bought some of your books are amazing. As a new trader it’s explaining very clear and simple to understand.
Hi Zewang,
You are awesome!
Cheers.
Hey reynor ,
Just now ordered Trading secrets ebook..
Thankyou so much
Awesome, Syed!
Thanks alot big man for the eye opener, I will forever appreciate ur effort
You are welcome, Prince!
[…] can use tools like Support and Resistance, Moving Average, Trend line, […]
thanks,I ENJOYED ur lecture & want to have more of it especially ones to help me have command of technical analysis.how to generate profitable signals.please be my mentor & make me in fx trading.
You are most welcome, Isaac.
If you are new to trading, you might wanna check Rayner’s free course in his Academy. This will also help you out big time learning the basics.
Here is the link:
https://www.tradingwithrayner.com/academy/
Cheers!
plse is it true I DO TECH ANALYSIS ON ONE TIME FRAME & PLACE TRADE ON ANOTHER ?DO HELP I am trying to catch up with this thing.
Hey there, Isaac.
Jarin here from TradingwithRayner Support Team.
You can use a factor of 4 to 6. You can learn more details on the link below:
https://www.tradingwithrayner.com/multiple-timeframe-cheat-sheet/
Hope that helps!
This is Gold!
Thanks, Mario!