This post is written by Jet Toyco, a trader and trading coach.
The bull flag pattern is probably one of the first chart patterns you’ve learned.
It’s simple, and it’s effective.
However, most guides out there teach you how to spot them and not how to trade them.
That’s why in today’s guide, I’ll share with you:
- The right way to spot bull flag patterns so that you’ll never second-guess yourself ever again
- How to find high-probability (and not random) bull flag pattern setups
- Three bull flag pattern strategies that work both in bull and bear markets
You pumped?
Then let’s get started!
How to Spot Bull Flag Patterns The Right and Wrong Way
At this point…
You probably already know what it is and how it looks.
It’s a freakin popular chart pattern, after all!
However, I noticed a lot of traders tend to complicate how the bull flag pattern is identified, such as:
“Should there be a minimum of 10 candles?”
“Should it make a three-leg move first?”
“Should there be doji candlesticks?”
Seriously, you don’t need any of those!
Instead, here’s the only thing you should keep in mind…
A group of indecision candles after a strong move
Recall:
The bull flag pattern is a “continuation” pattern that gives you a logical place to hop into the trend.
It means that if you’re looking to enter a trade at a good value within an uptrend, then the bull flag pattern is your go-to pattern.
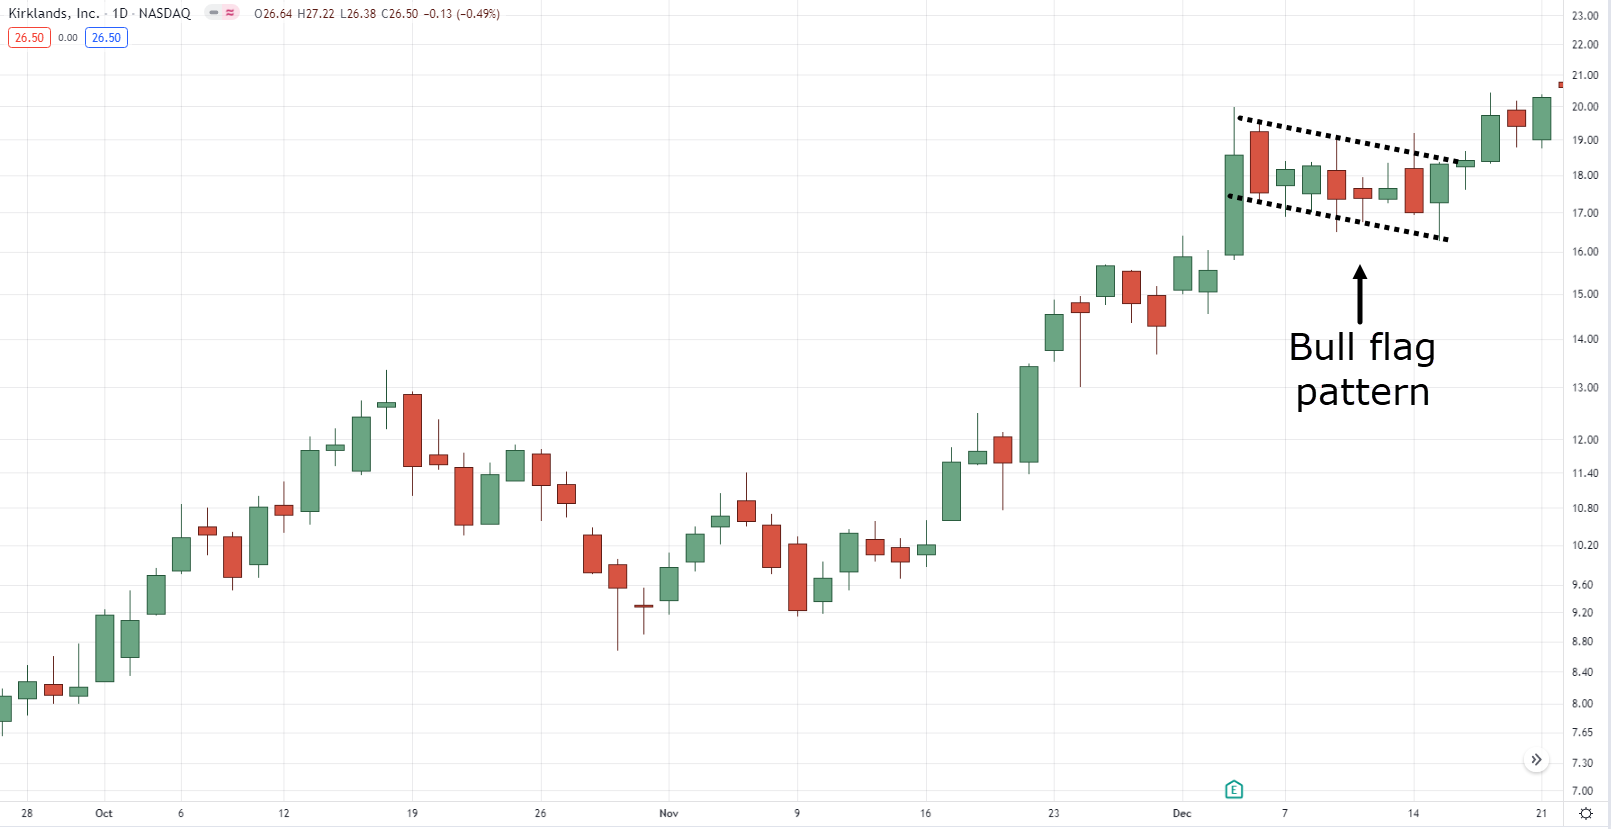
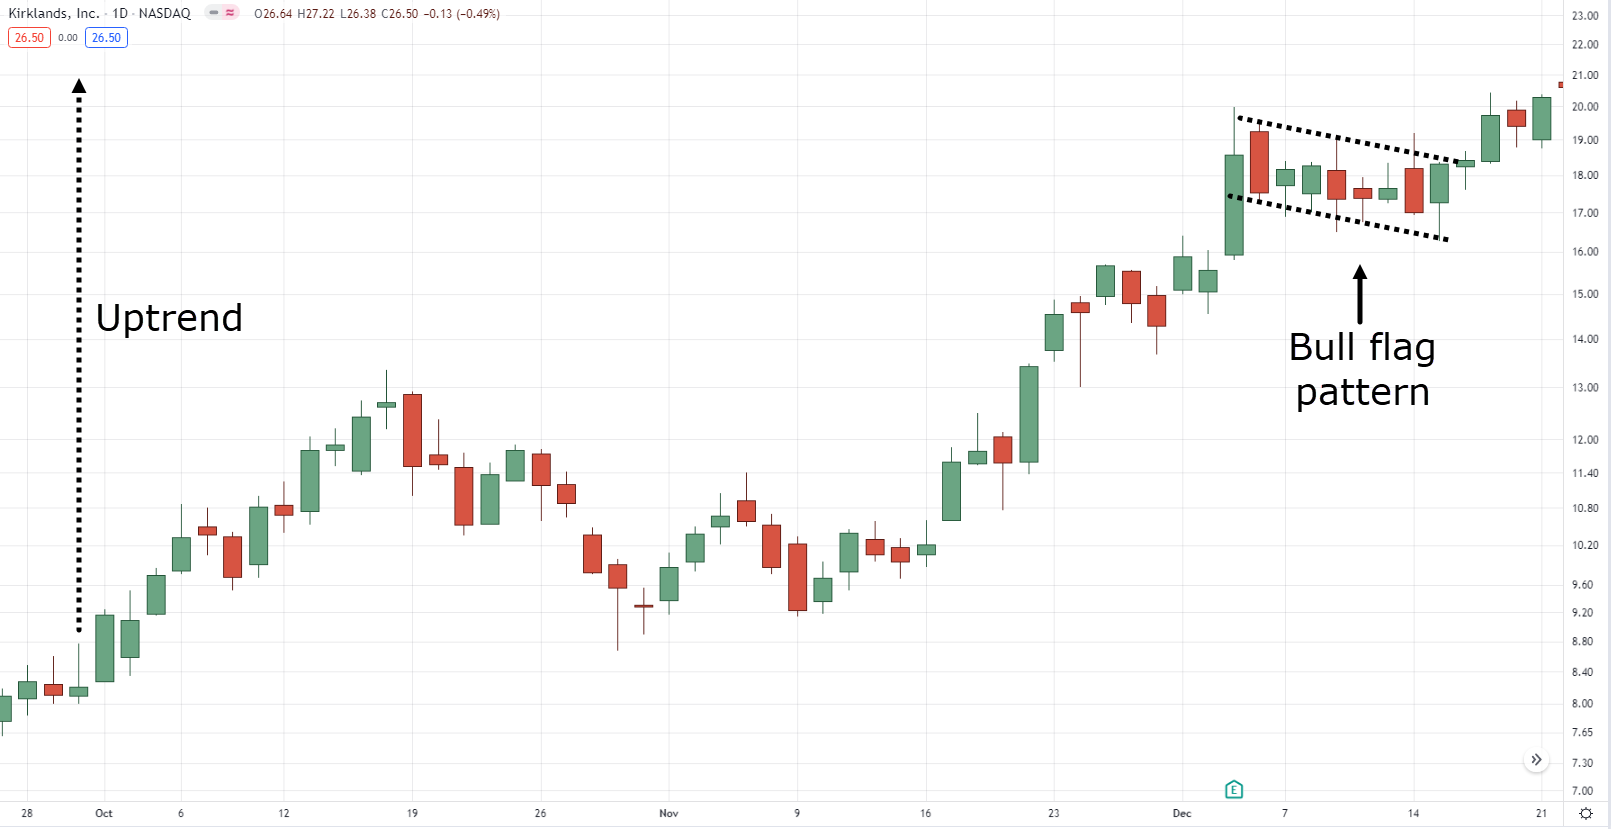
Bull flag pattern on KIRK daily timeframe:
With that said, the bull flag pattern consists of two parts.
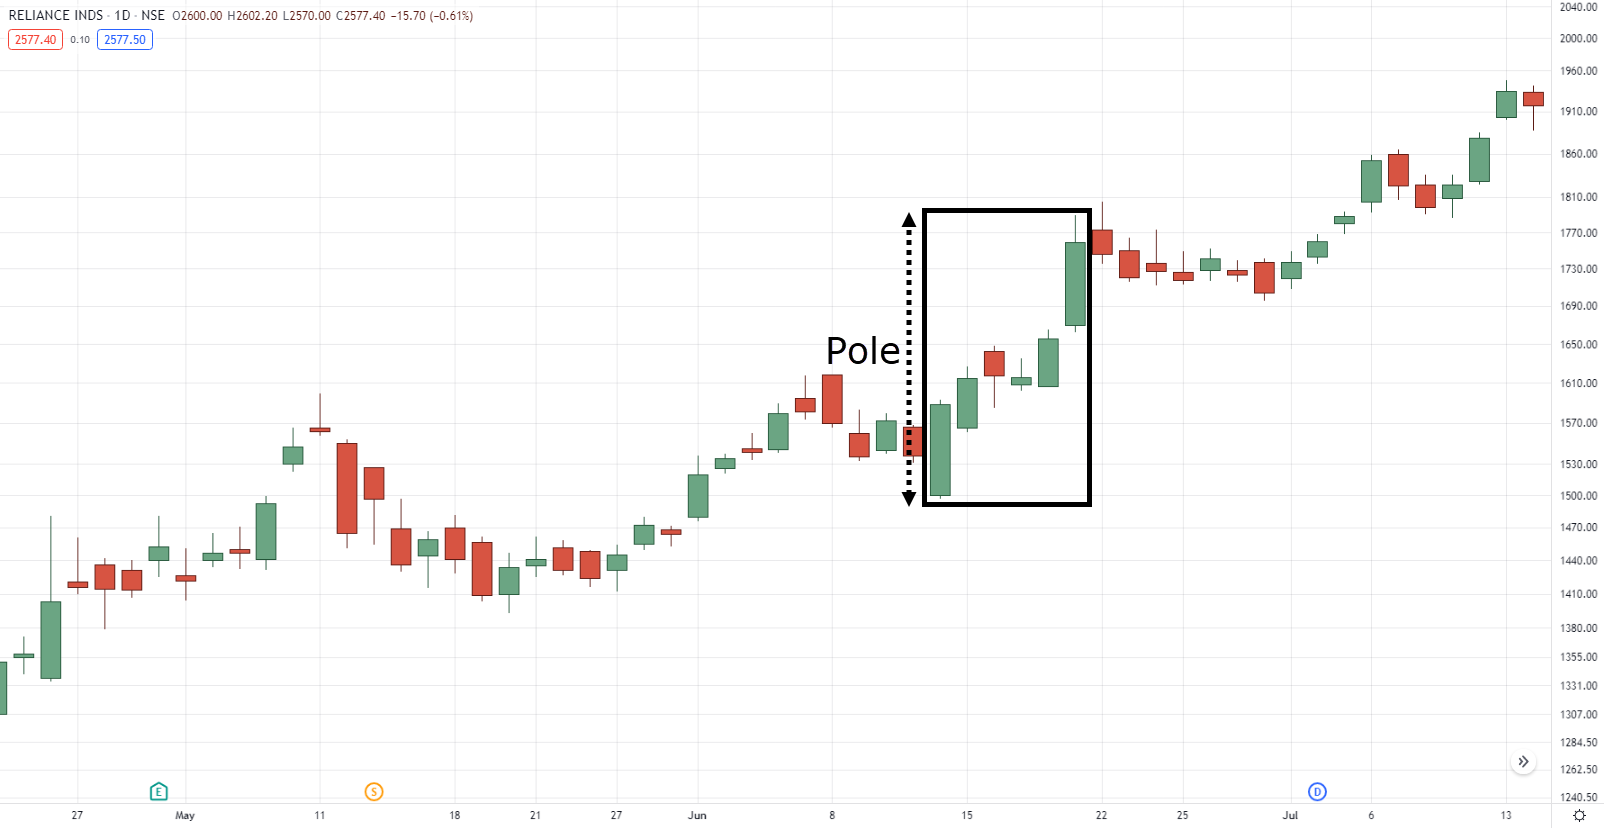
The pole, which is the most obvious one.
Bull flag pattern pole on RELIANCE daily timeframe:
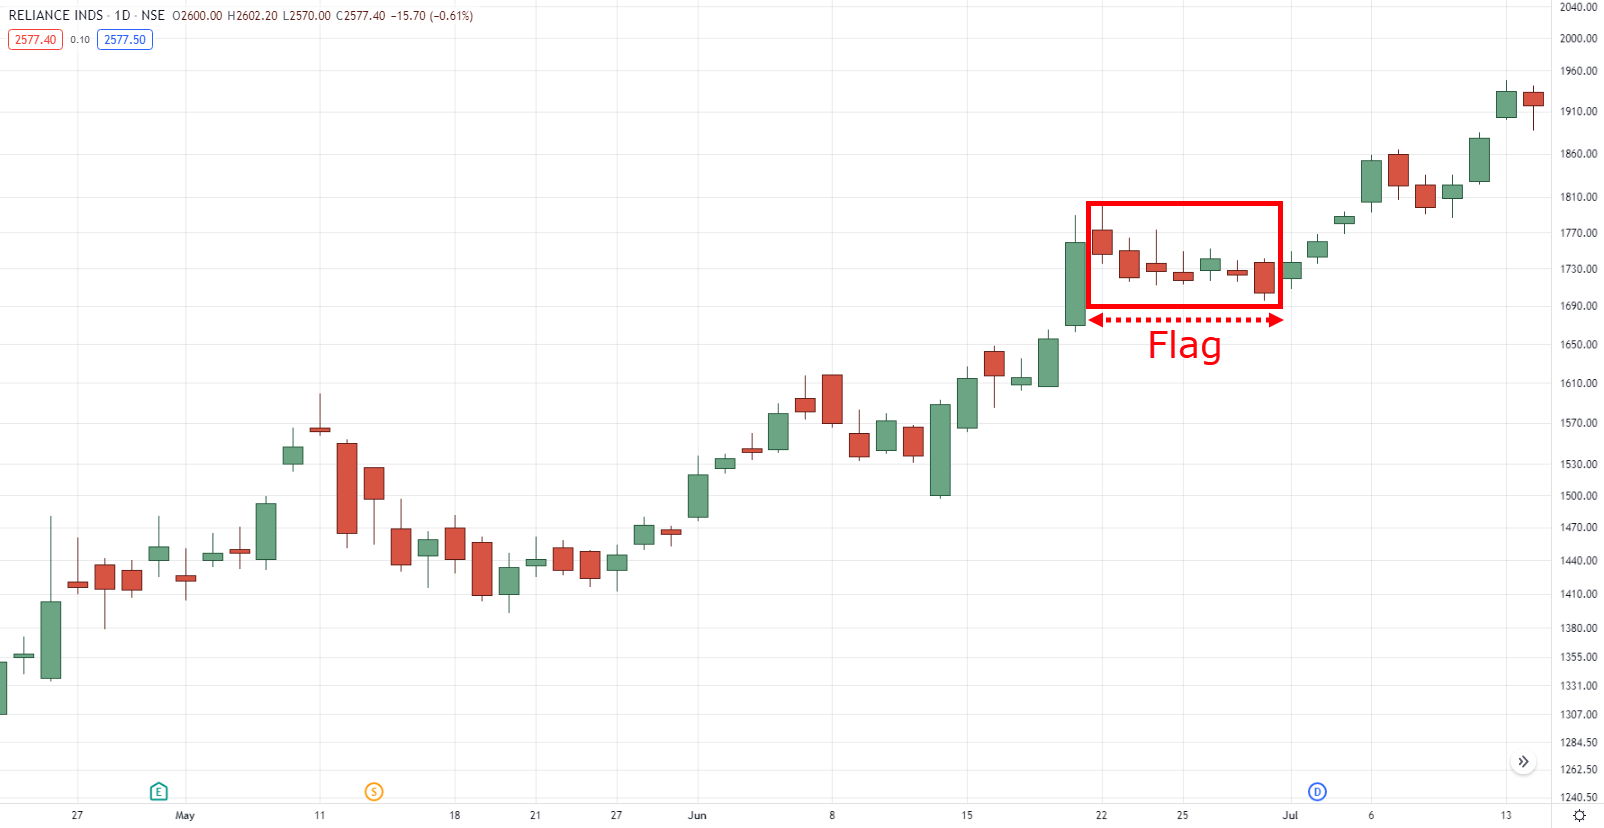
Then the flag, which is where things can get complicated.
Bull flag pattern on RELIANCE daily timeframe:
So let’s talk about this…
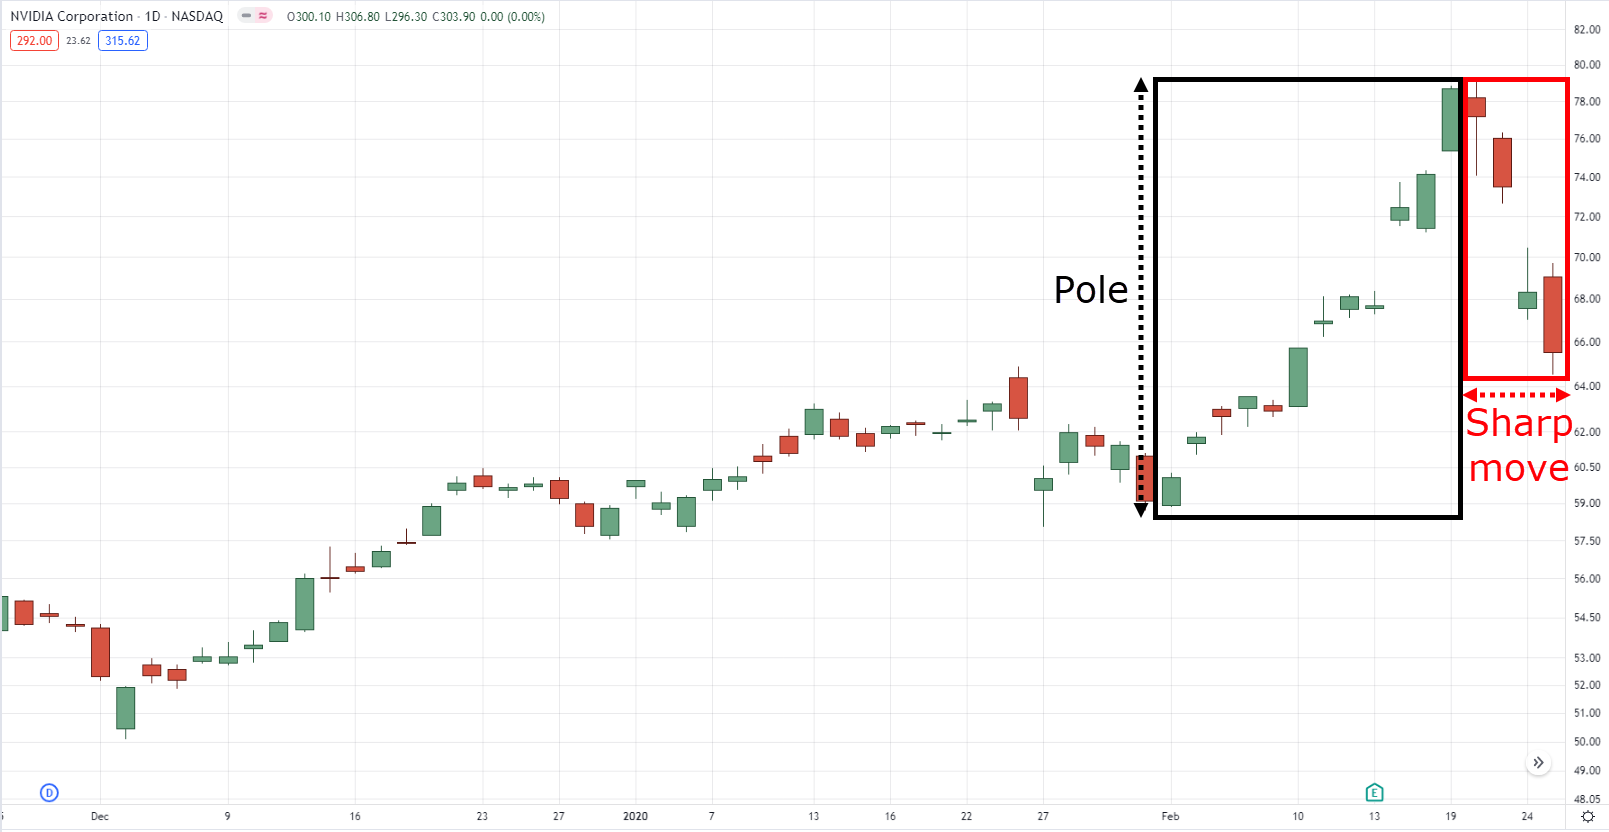
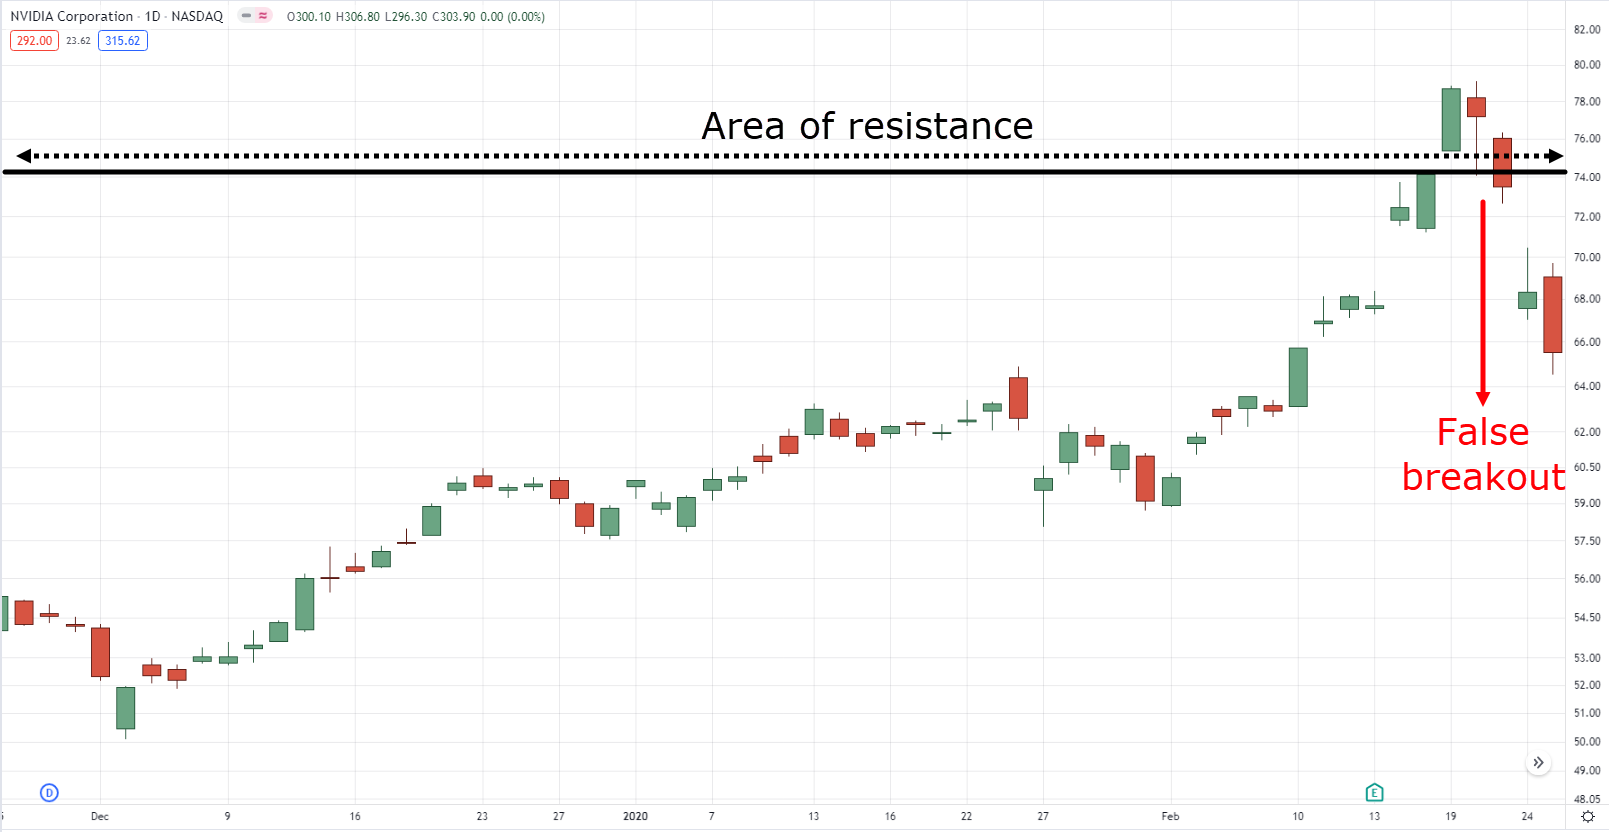
If you see a pole and the price suddenly makes a sharp move…
Sharp move on NVDA daily timeframe:
Then that’s already a clear sign that it’s not a bull flag pattern.
Instead, it’s a sign that it’s a false breakout.
False breakout on NVDA daily timeframe:
So, what exactly are we looking for then?
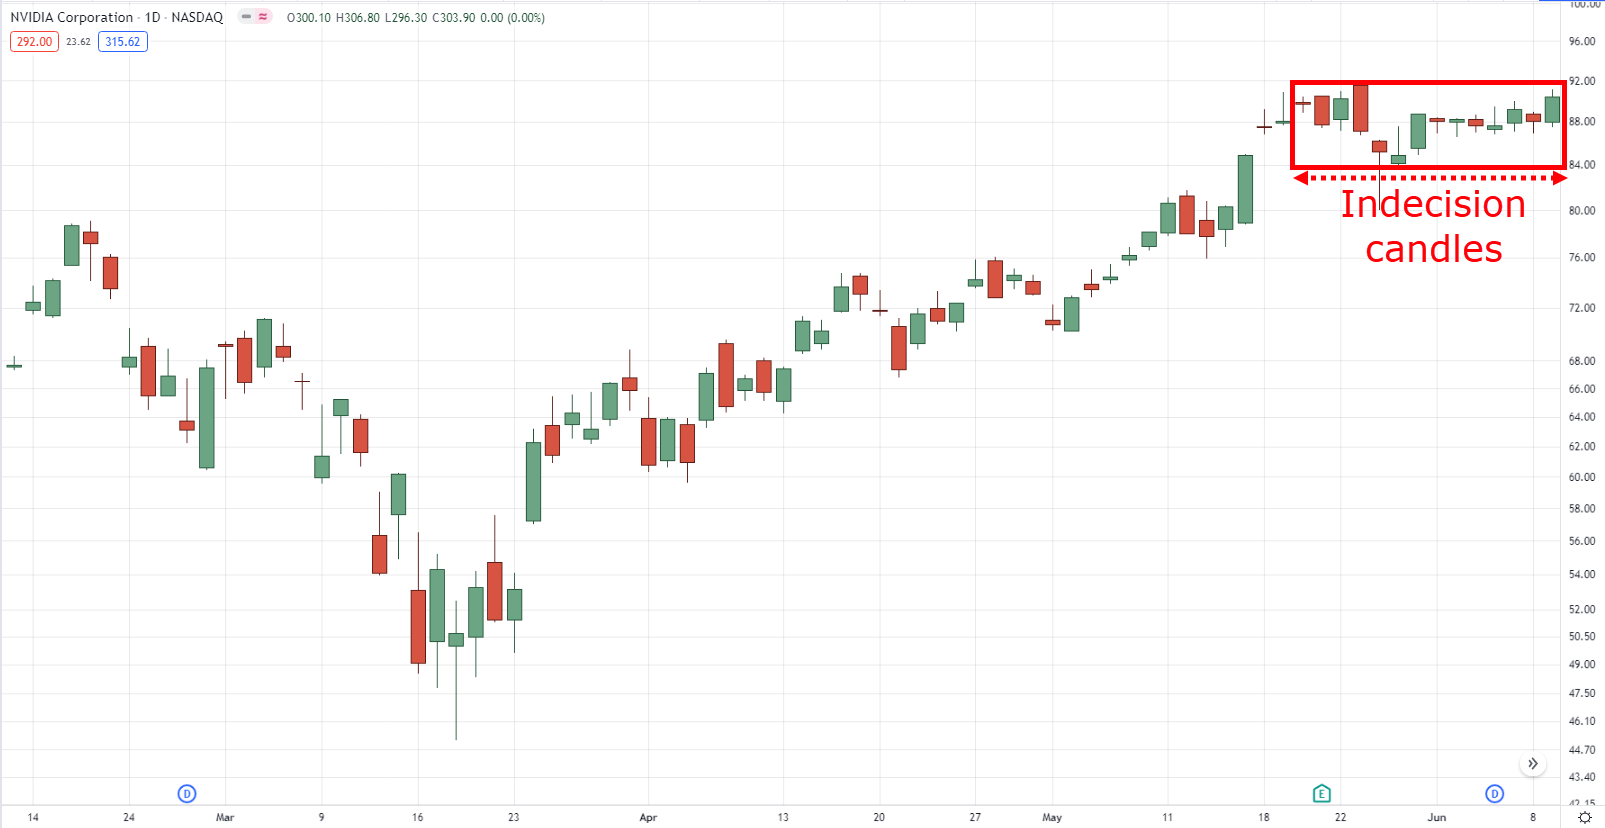
What we are looking for is a group of indecision candles!
Indecision candle on NVDA daily timeframe:
Why indecision candles, you may ask?
Because if you spot a group of indecision candles after a strong move (pole)…
It tells you that the sellers are struggling to bring the price down and that the buyers are still in control.
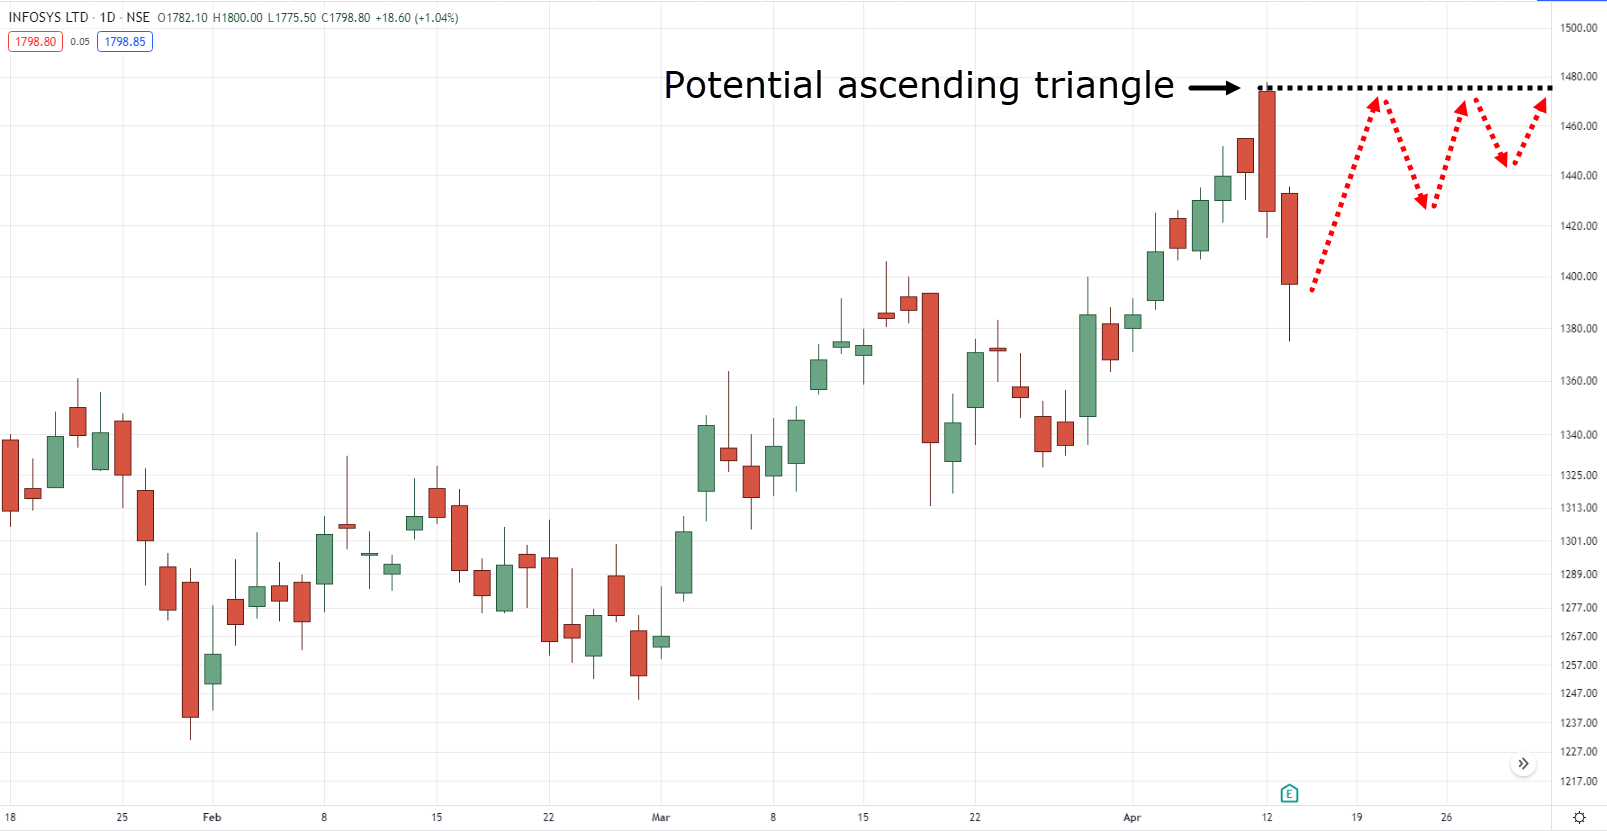
That’s why if you spot a sharp move down after the pole has formed, it will take a while for you to confirm that the sellers have not yet taken over.
That’s why we have other chart patterns, such as the ascending triangle if the price needs more time to develop.
Potential ascending triangle on INFY daily timeframe:
With that said…
Let’s go Dora mode and do a bit of an exercise, shall we?
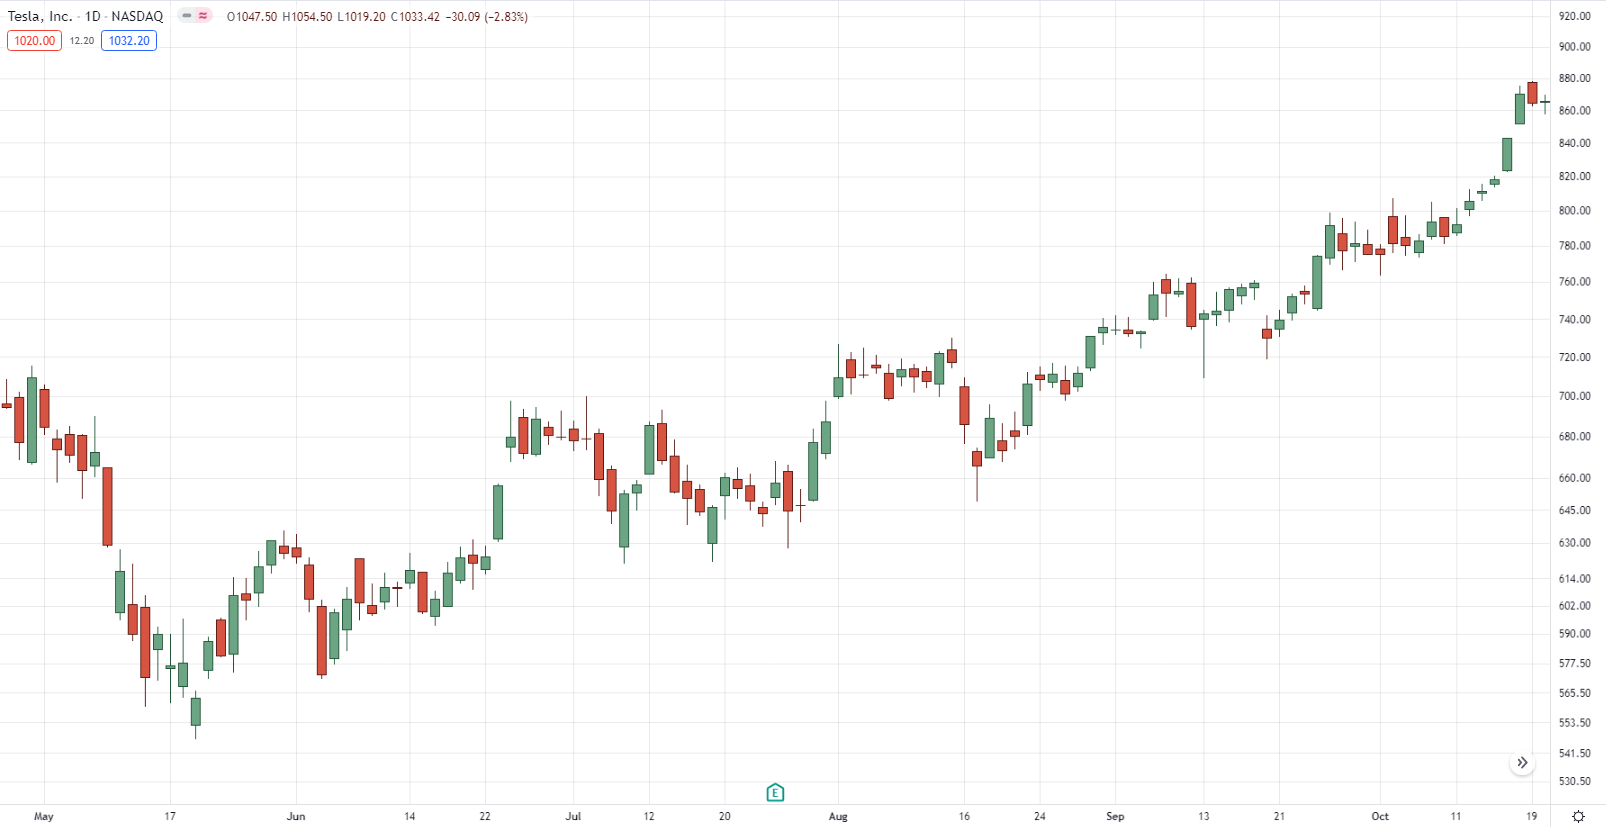
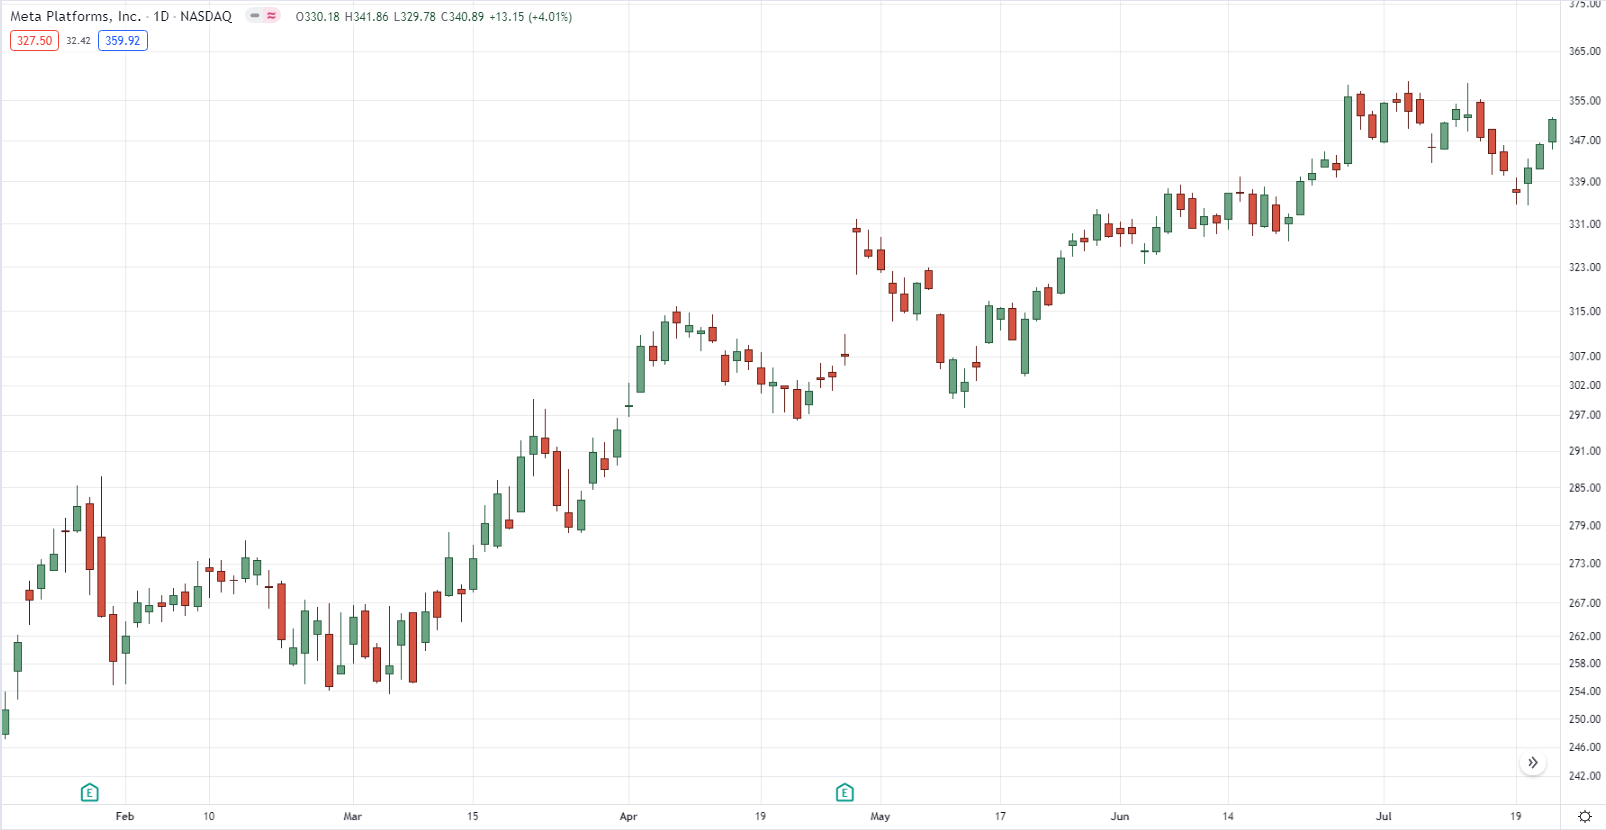
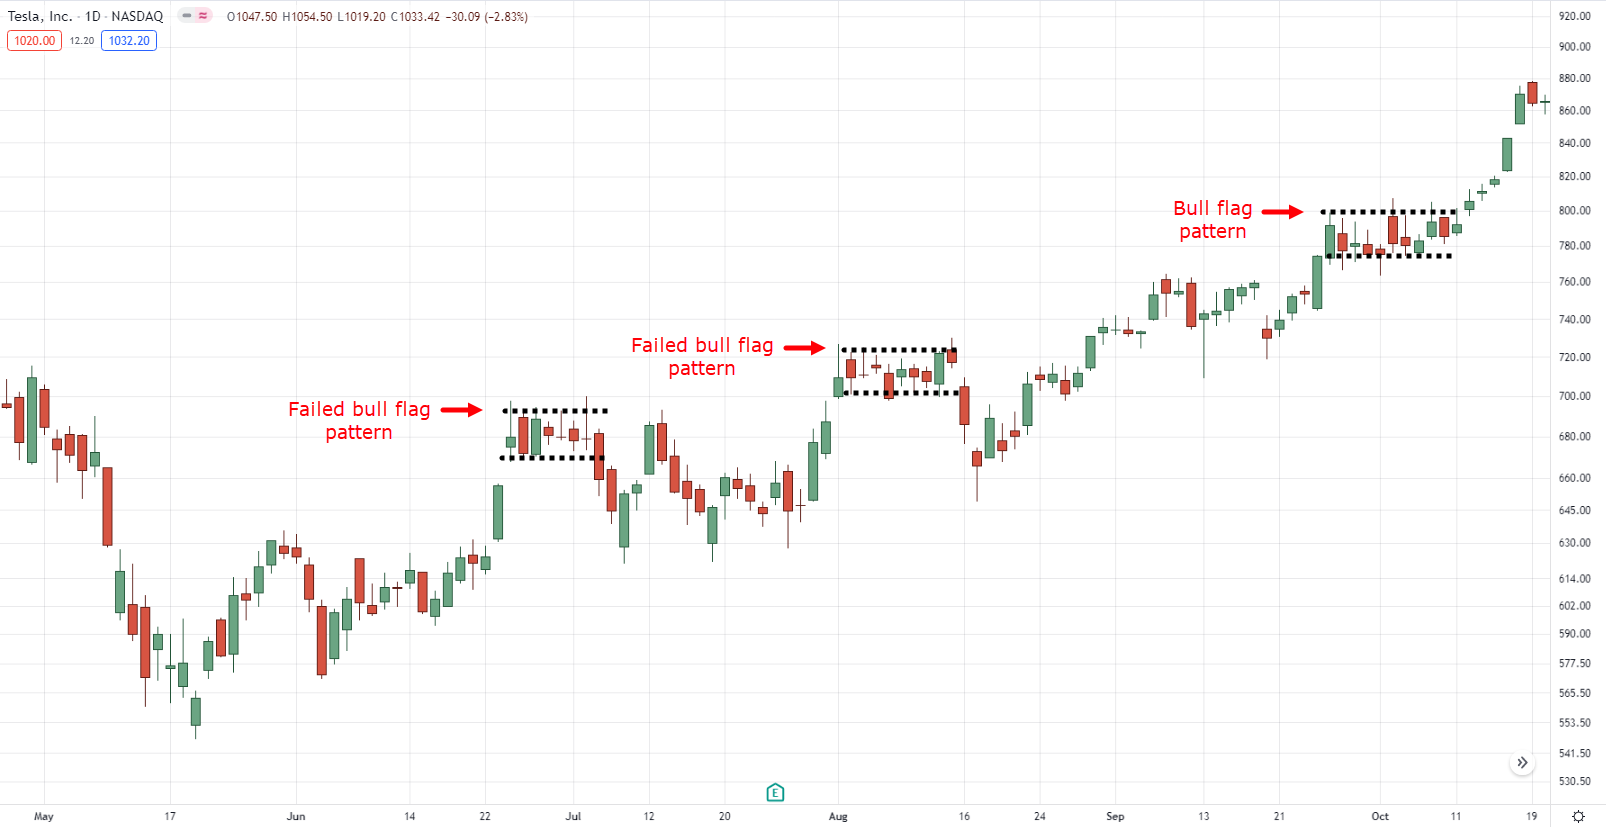
So looking at this chart, can you tell me how many bull flag patterns are there?
Bull flag patterns on TSLA daily timeframe:
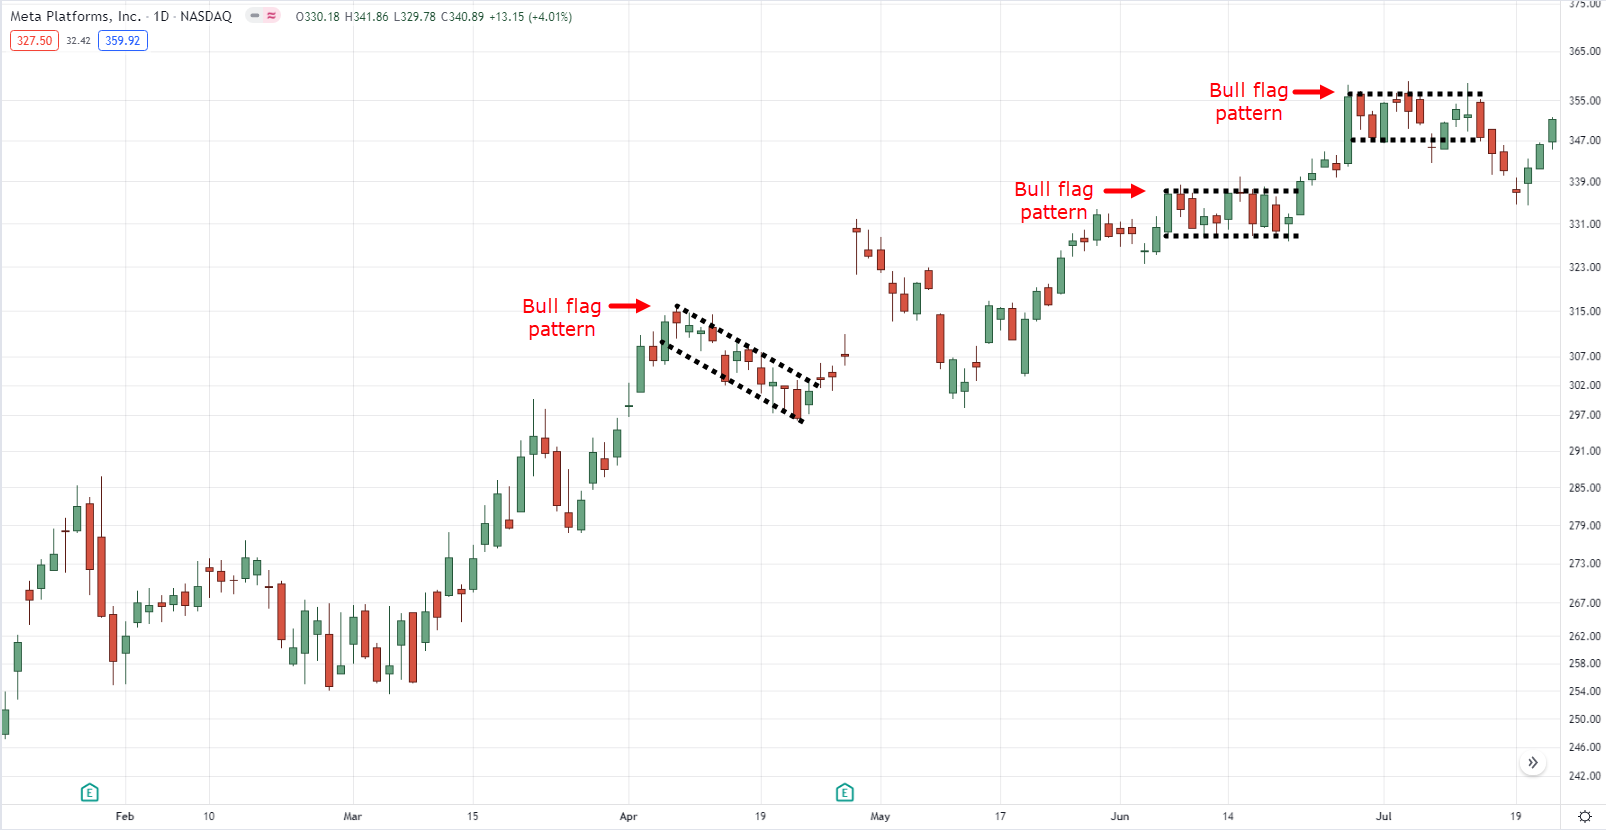
How about this one?
Bull flag patterns on FB daily timeframe:
Done?
Let’s compare it to what I see…
Bull flag patterns on TSLA daily timeframe:
Bull flag patterns on FB daily timeframe:
Now, I’m not expecting us to see the same thing all the time because the bull flag pattern is a discretionary trading concept.
It means that both of us can see two different things yet aren’t exactly wrong.
Nonetheless, if our plots match more than 50%, I can tell that you are heading on the right path.
P.S. I showed you successful and failed bull flag patterns because the reality is that not all patterns work 100% of the time and that we’re focusing on how to spot them correctly at this point.
Sounds good?
So let’s put all of this behind us now and get down to the nitty-gritty details on how you can find the best bull flag setups out there…
How To Find The Best Bull Flag Patterns On A Chart
Imagine I’m showing you two white shoes.
hear me out).
But what if I told you that Nike manufactured shoe A while some knock-off unknown brand manufactured shoe B.
You’d probably pick the shoe that Nike manufactured.
Because you know it’s proven to be built to last and can go the long distance.
It’s the same for trying to look for a bull flag pattern!
Just because you spot a flag pattern, it doesn’t mean that it’s set up to be a high risk to reward setup.
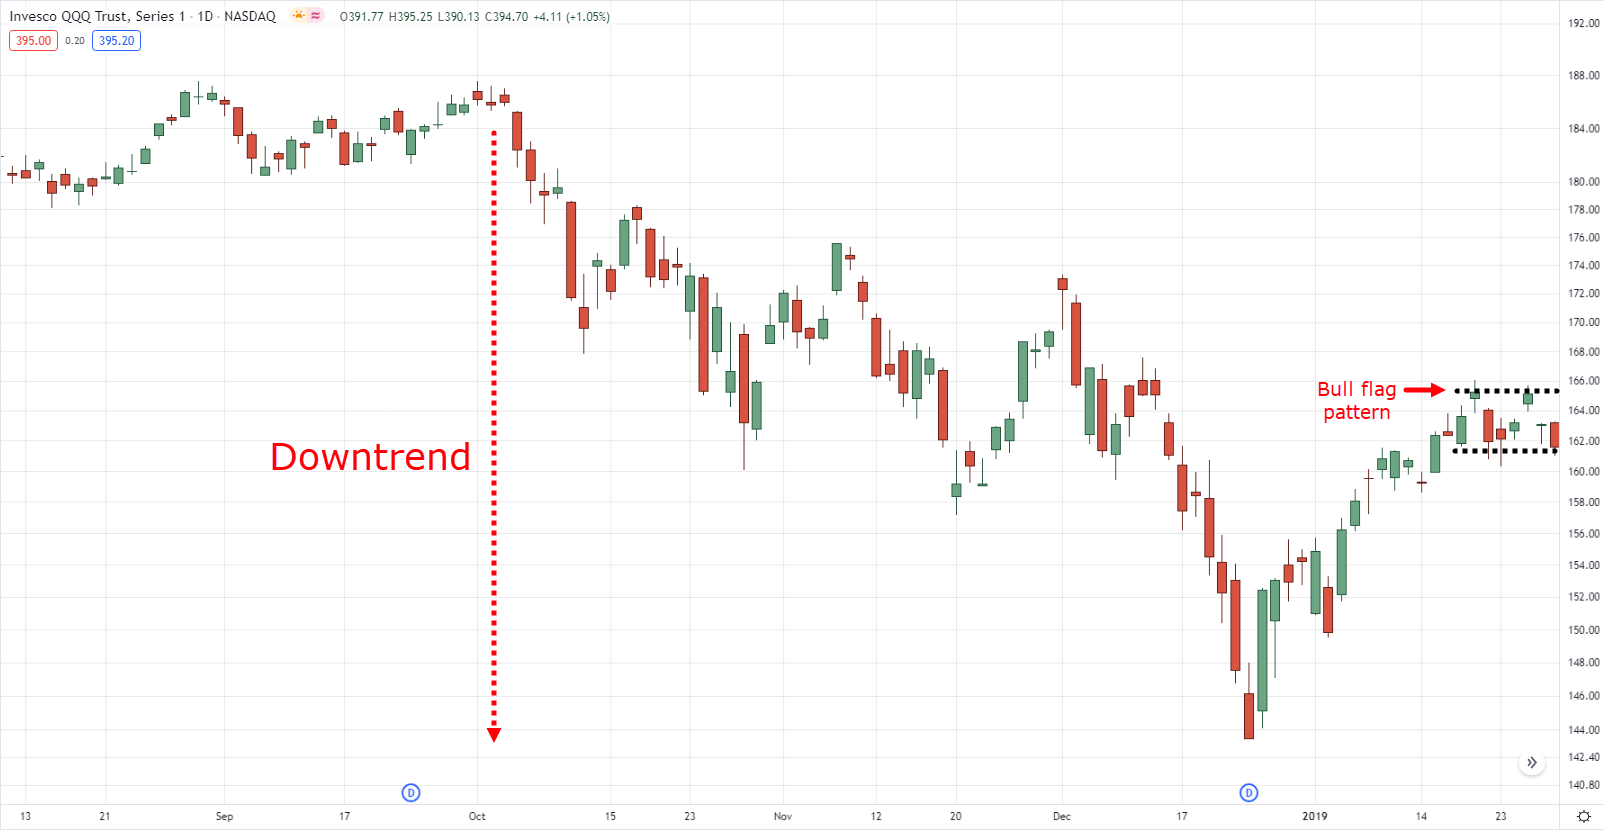
For all you know, the bull flag pattern is formed in an existing downtrend.
Bull flag pattern in a downtrend on QQQ daily timeframe:
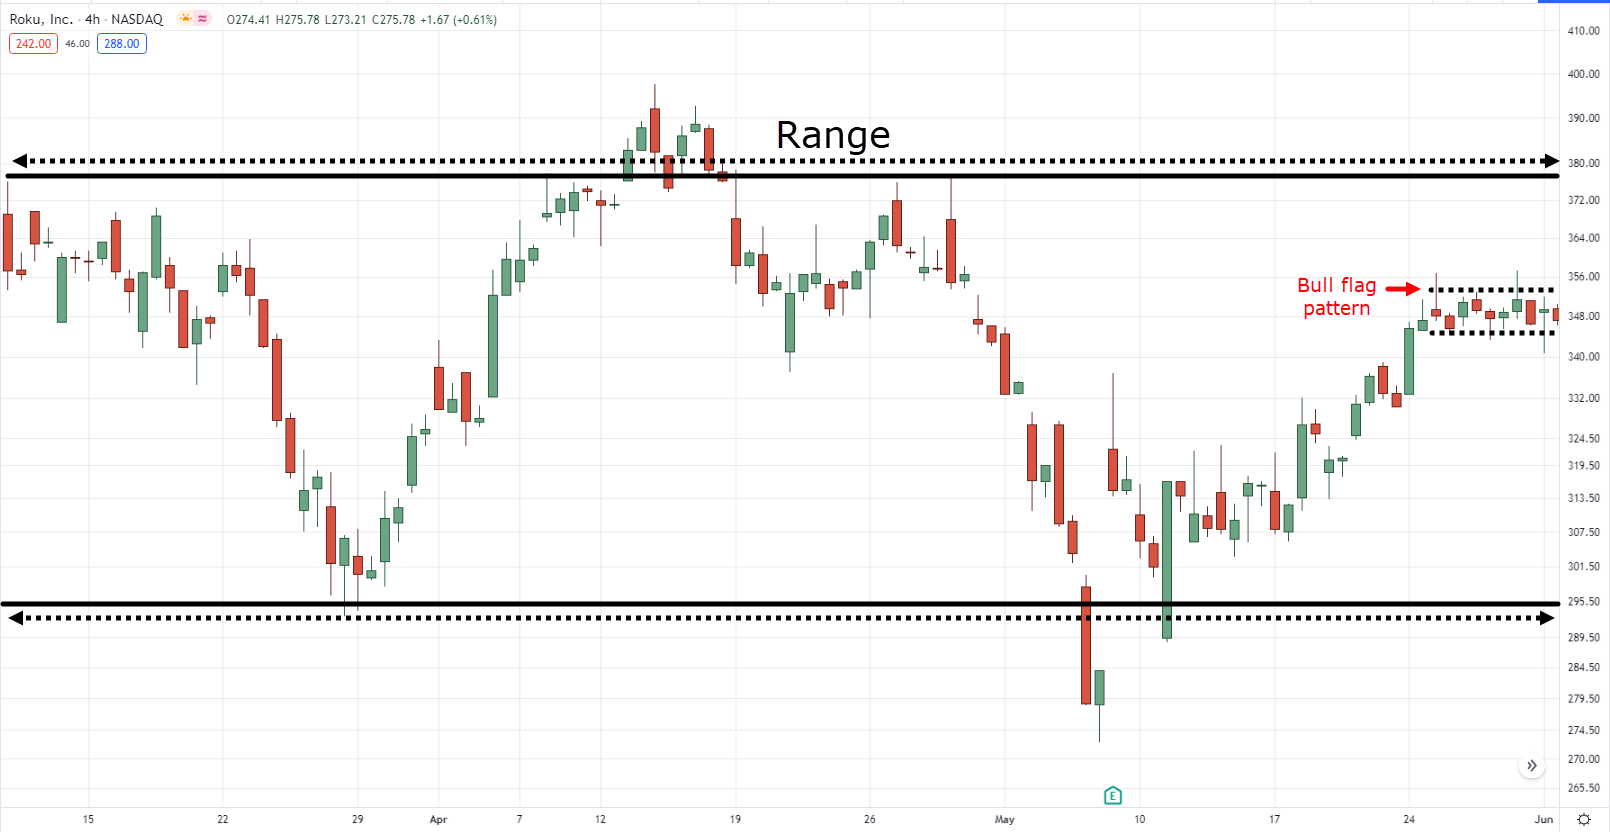
Or formed in the middle of nowhere inside a range.
Bull flag pattern in a range on ROKU 4-hour timeframe:
Now you’re wondering:
“Alright, show me how I can spot bull flag pattern setups that’ll bring in the Lambo money!”
Well, I can’t promise the Lambo money part but spotting a high-quality bull flag all boils down to three things:
- Bull flag pattern + uptrend
- Bull flag pattern + below resistance
- Bull flag pattern + trend reversal
You see, the secret sauce here is to associate the pattern with price action.
So let me show you what I mean and how versatile this one chart pattern could be…
1. Bull flag pattern + uptrend
The most common implication of the bull flag pattern is to look for the right time to hop into the trend.
Bull flag pattern in an uptrend on KIRK daily timeframe:
That’s why you hear some traders saying:
“Ah dammit, I missed the breakout! I’m going to have to wait for a pullback.”
Sounds familiar?
But here’s what’s important.
You need to determine what type of trends you want to capture and have a specific rule on defining them.
Let me explain:
- For short-term trends, consider using the 20-period moving average.
- For medium-term trends, consider using the 50-period moving average.
- For long-term trends, consider using the 200-period moving average.
You can trade all of them.
But for the sake of consistency, master trading one type of trend first by having 30-50 trades clocked in.
Next…
2. Bull flag pattern + below resistance
I’m sure you can agree with me…
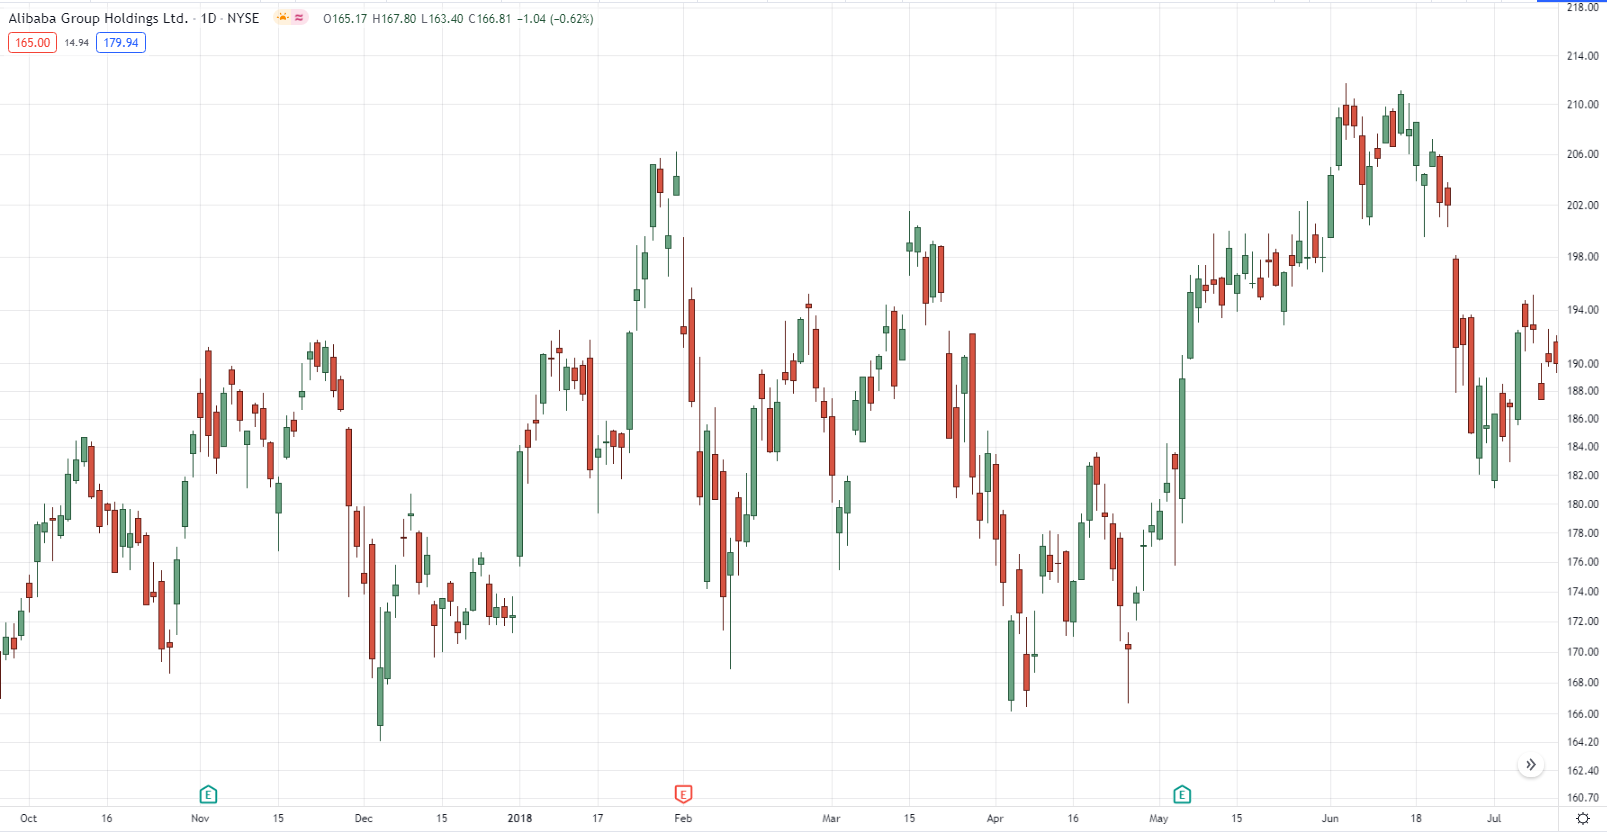
Range market is one of the most challenging market conditions to trade.
It can contract, it can expand, and produce a lot of false breakouts.
Complicated range at BABA daily timeframe:
But what if there’s a way you can precisely time when the range becomes an uptrend?
Simple.
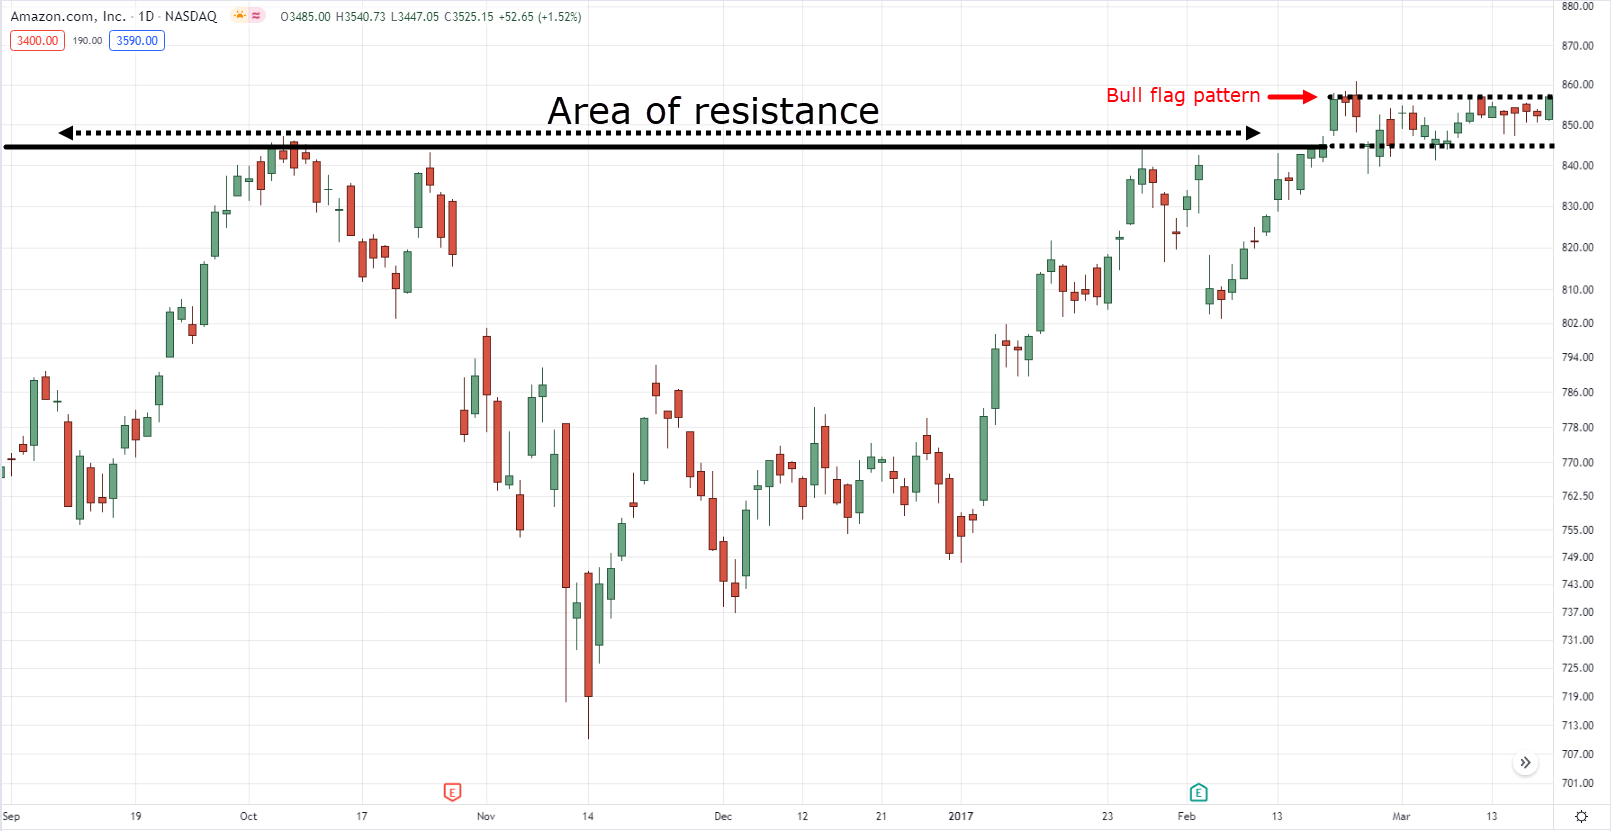
During a range, wait for the price to form a bull flag pattern below resistance.
Buildup below resistance at AMZN daily timeframe:
It tells you that the sellers are having difficulty pushing the price away from the resistance area and that buyers are willing to sustain the breakout!
Now how about downtrends?
How can you spot potential trend reversals with the bull flag pattern?
Find out next…
3. Bull flag pattern + trend reversal
Remember how I shared with you that there are three types of trends?
Well, with this technique…
You’ll be able to capture trend reversals easily, even if they are short, medium, or long-term downtrends.
Yes, downtrends, since we’re going to use the bull flag pattern to spot trend reversals, remember?
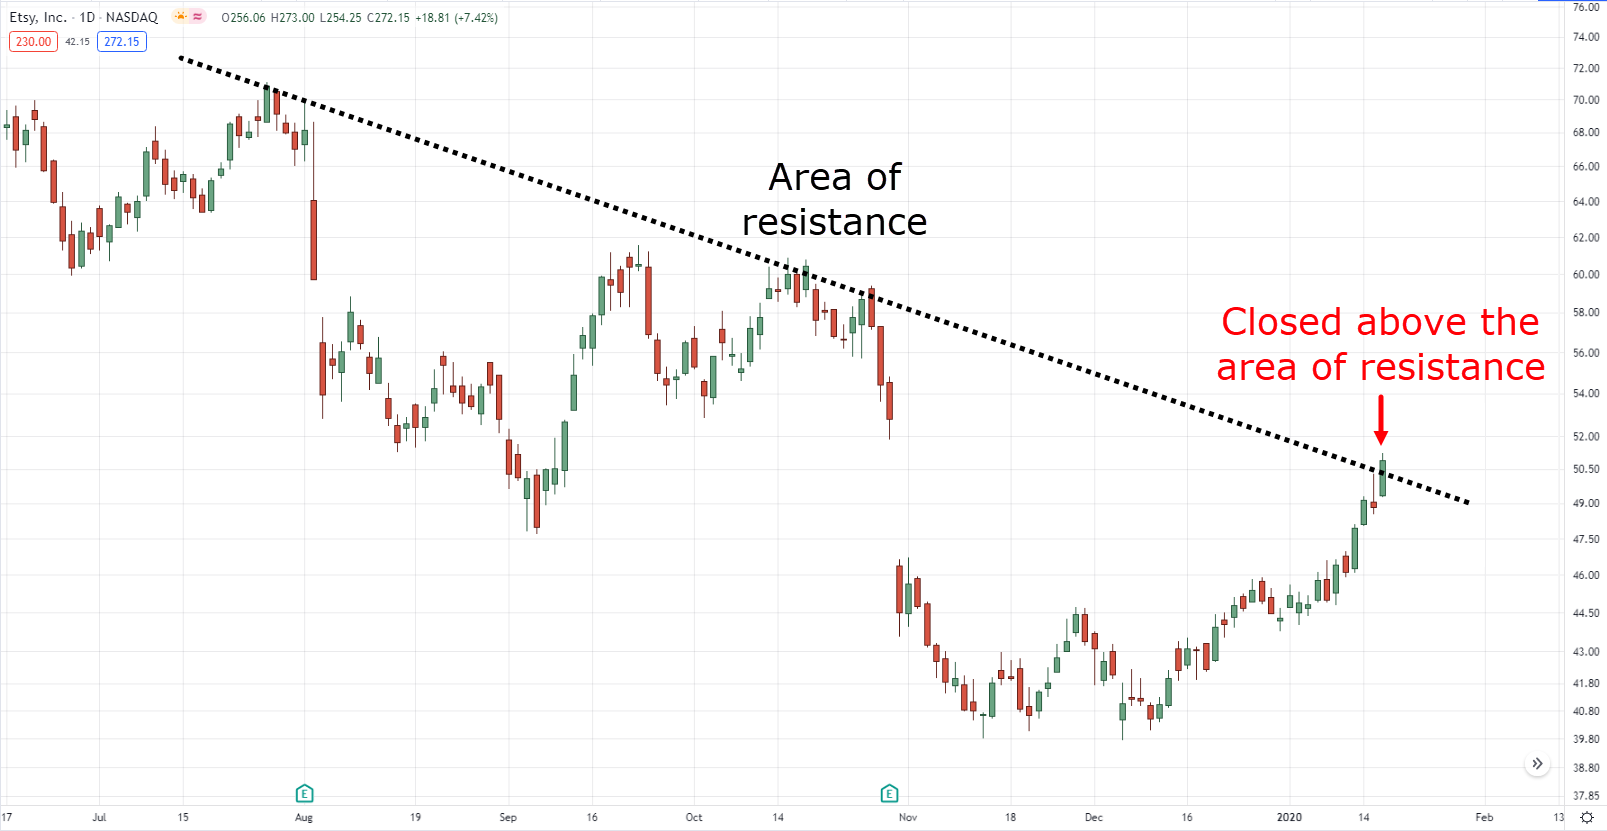
Now, the first thing you need to do is to spot a downtrend and wait for the price to break its trend line resistance.
Break of structure on ETSY daily timeframe:
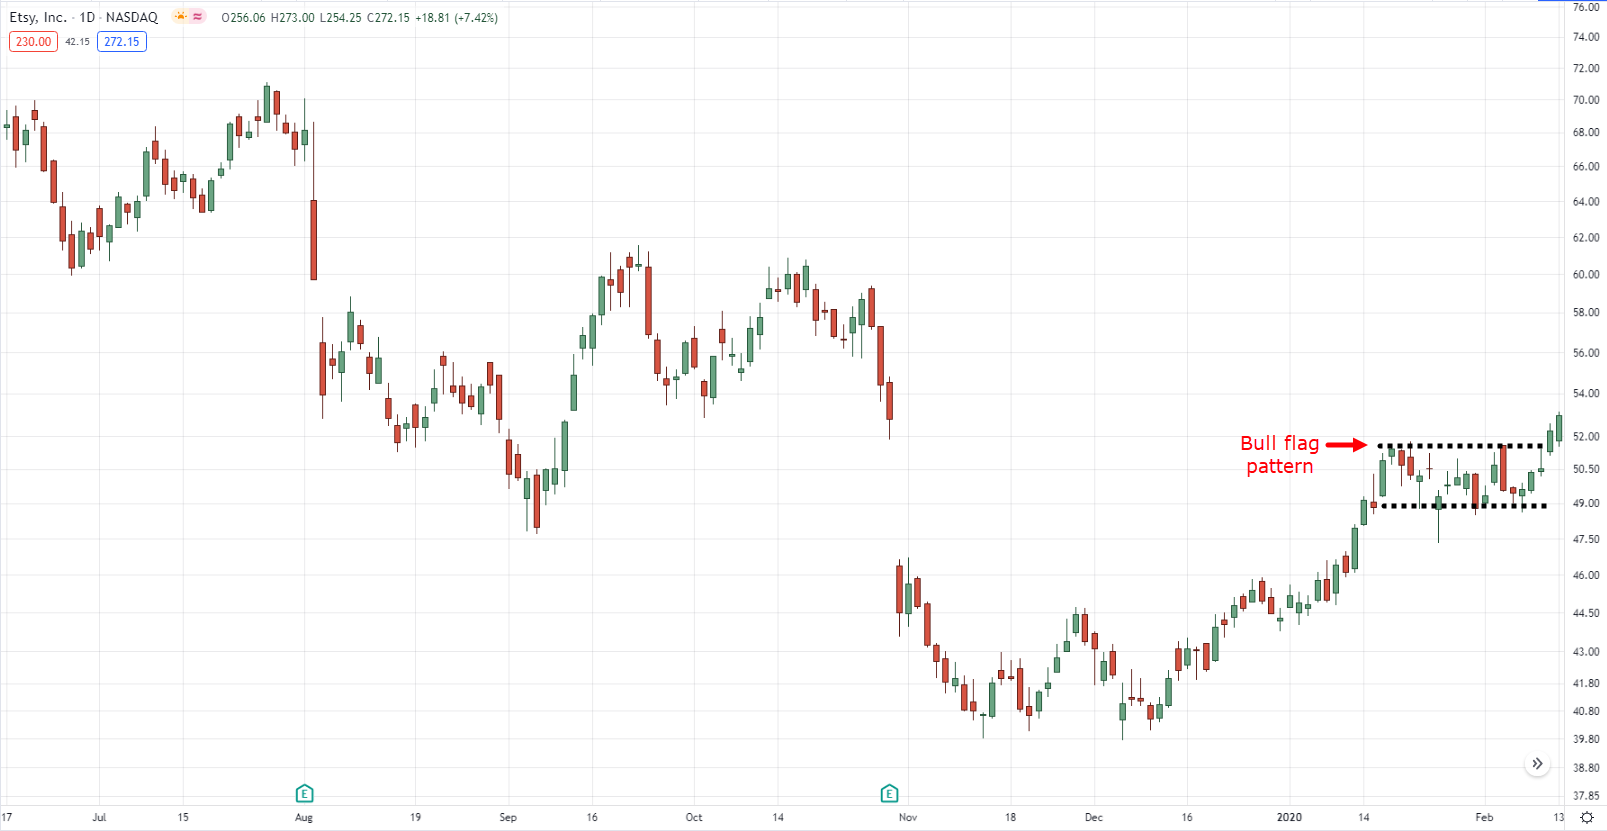
Second, wait for the price to form a bull flag pattern.
Bull flag pattern on ETSY daily timeframe:
Again, once the bull flag pattern is formed, not only it shows you the structure of the downtrend has been broken, but it also shows you that the “trend reversal” is sustaining!
Therefore telling you that an uptrend is about to occur potentially.
Now…
I know I may have given you the impression that these tips are the holy grail and that they are guaranteed to be a winner.
But just like any shoe, there’s still a chance for it to break down or something that can go wrong.
There are no guarantees.
That’s why we manage risk.
So, now that you know where the golden bull flag patterns appear…
How do you manage your trade when you enter them?
Should you have a fixed target profit?
Should you trail your stop loss?
Don’t worry, in the next section…
I’ll share with you practical trading strategies that will answer all of these questions.
Keep reading…
Bull Flag Pattern Trading Strategies That Work In Bull and Bear Markets
Before we get to the strategies…
Let me share the entry trigger rule with you because this is the same rule that we will use on all three strategies.
The rule is simple:
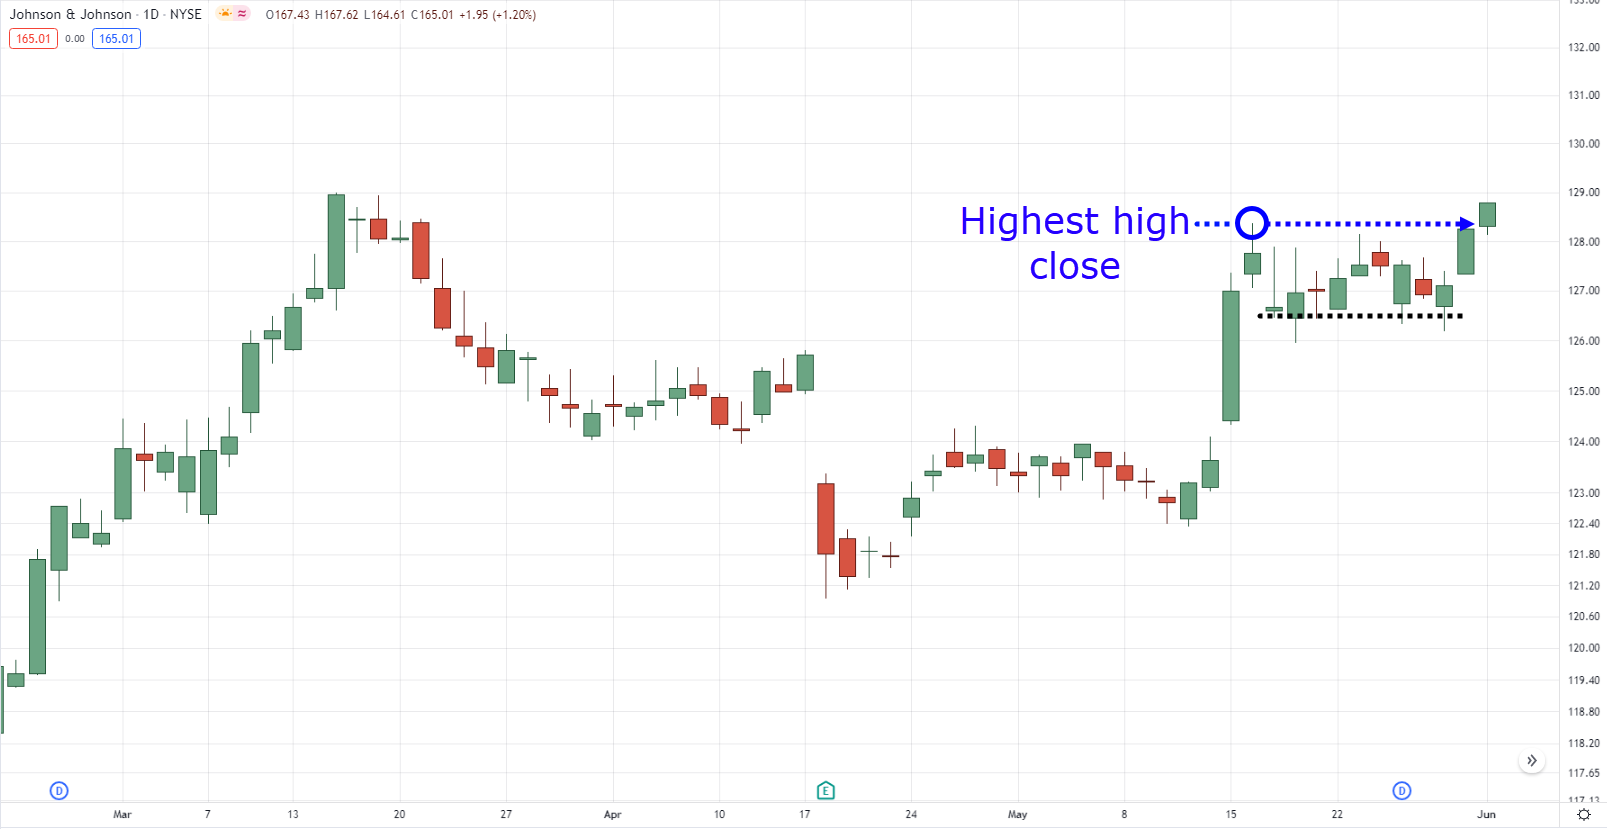
Wait for the price to make a “highest high close” from the pole (that’s right, above the highest wick of the candles)…
Highest high close on JNJ daily timeframe:
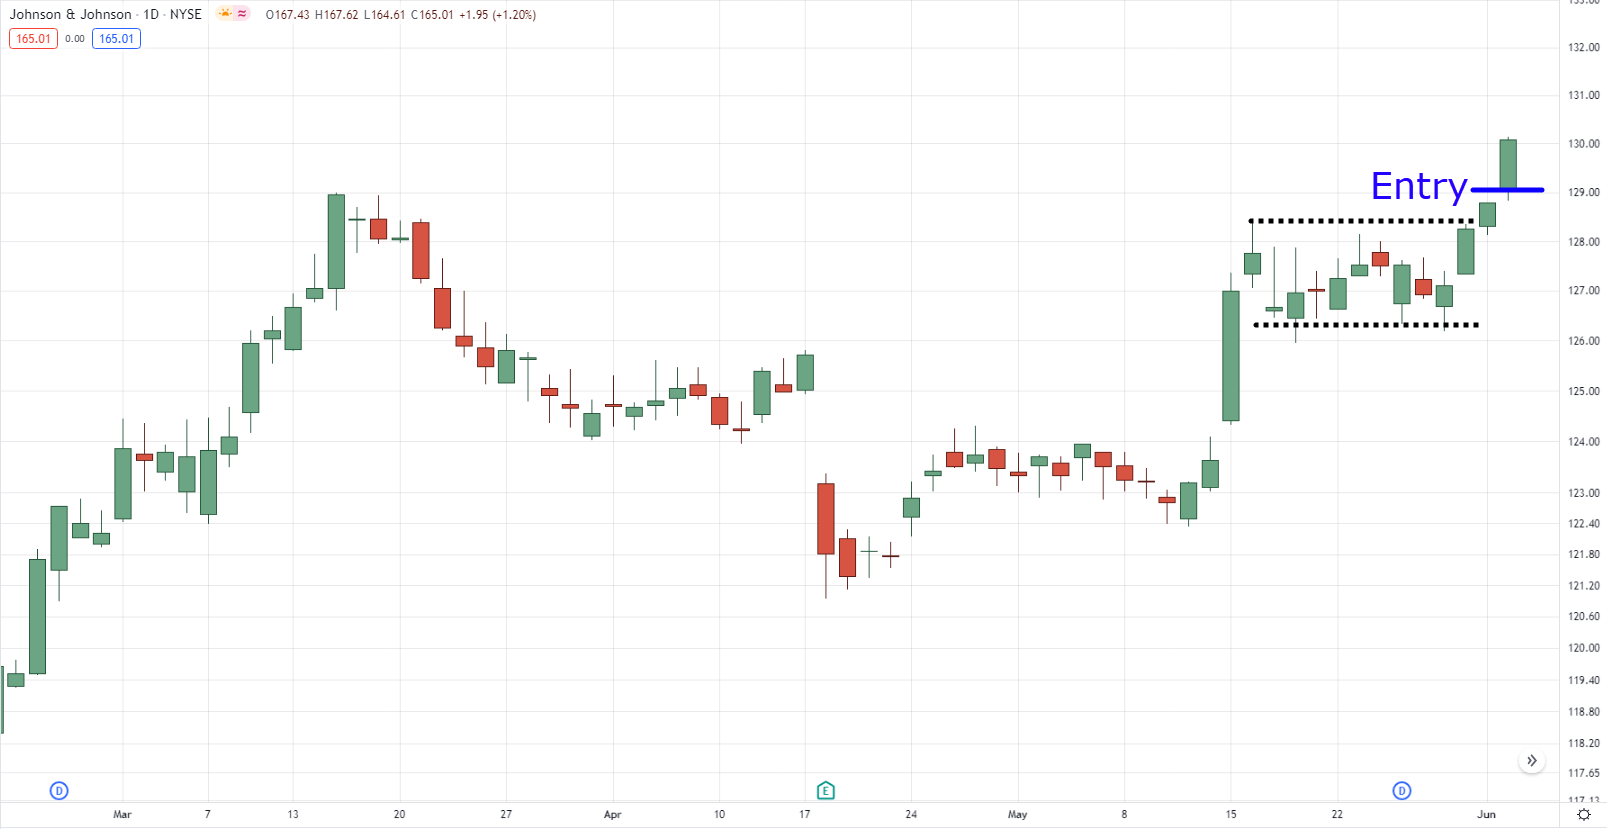
Then enter on the next candle open…
Bull flag pattern entry trigger on JNJ daily timeframe:
The entry trigger rules are the same for the strategies that I’m about to show you because entries only play a small part in the equation.
Meaning, how you manage your trade makes all the difference, not how you enter.
So don’t spend too much energy on how you should or shouldn’t enter a bull flag pattern, yeah?
With that out of the way, let’s get started…
Strategy #1: Bull flag trend continuation strategy
Let’s say you want to capture medium-term trends.
Therefore, you’d be using a 50-period moving average.
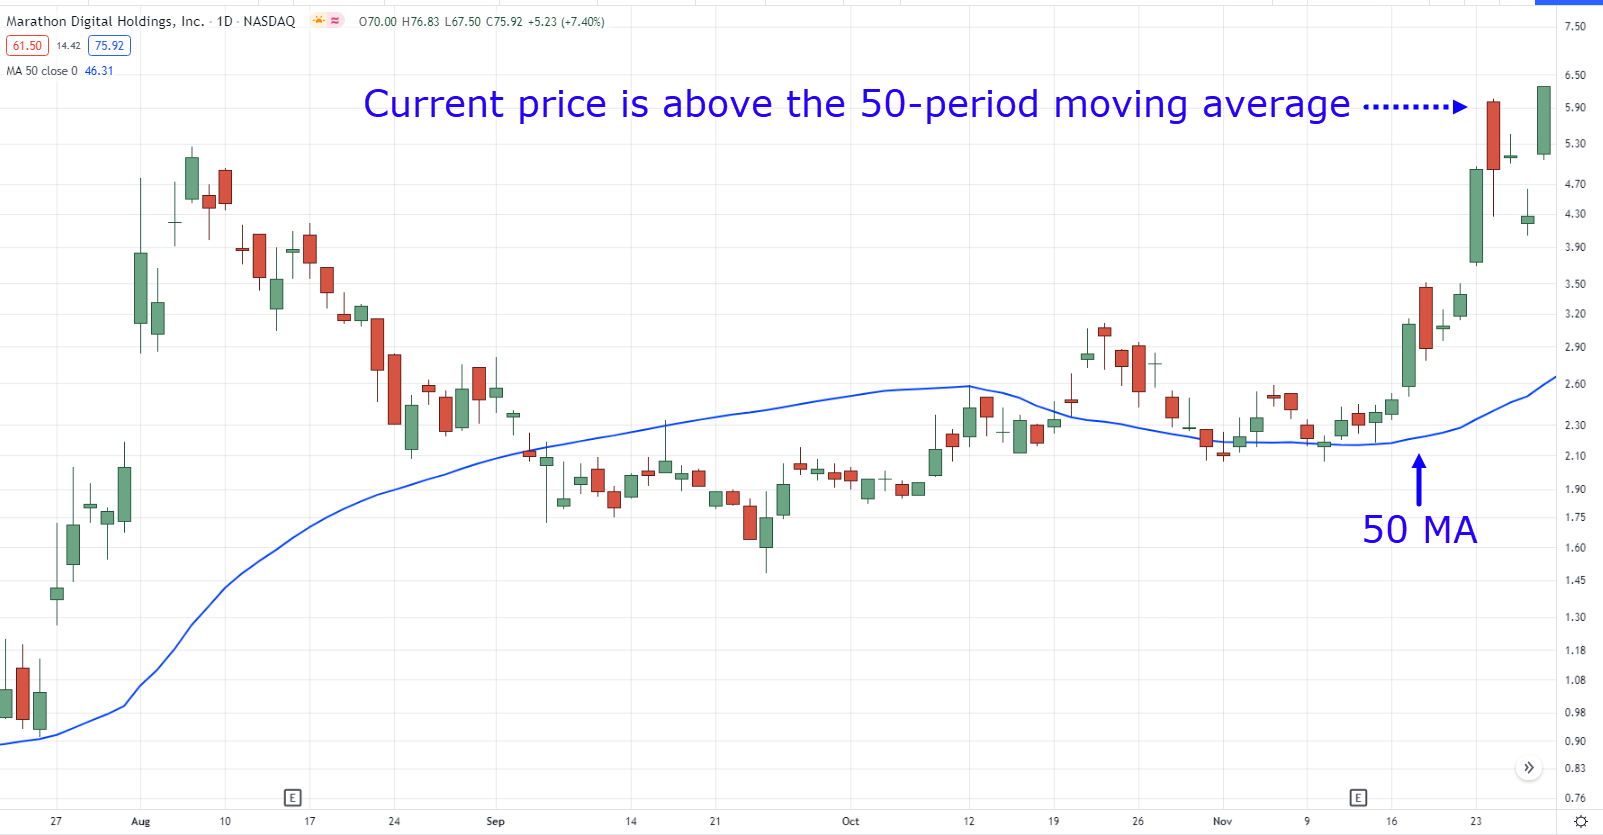
Now, what you want is for the price to be above the 50-period moving average.
Price above the 50-period moving average on MARA daily timeframe:
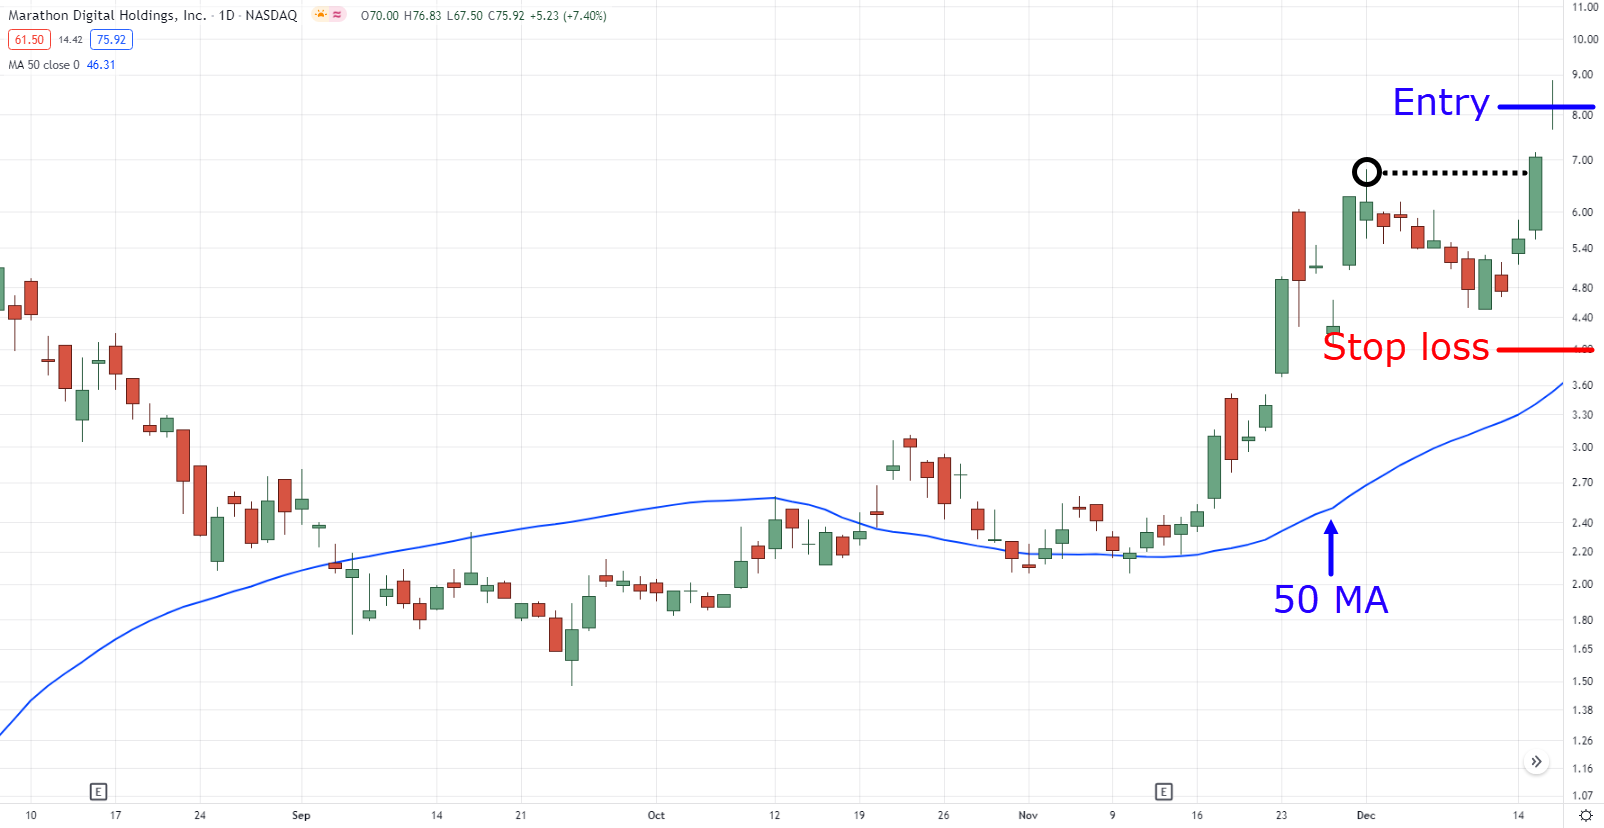
Then wait for a good bull flag pattern to form with your stop loss below the lows of the pattern.
Bull flag pattern entry on MARA daily timeframe:
Of course, a strategy is not complete without the exit rule!
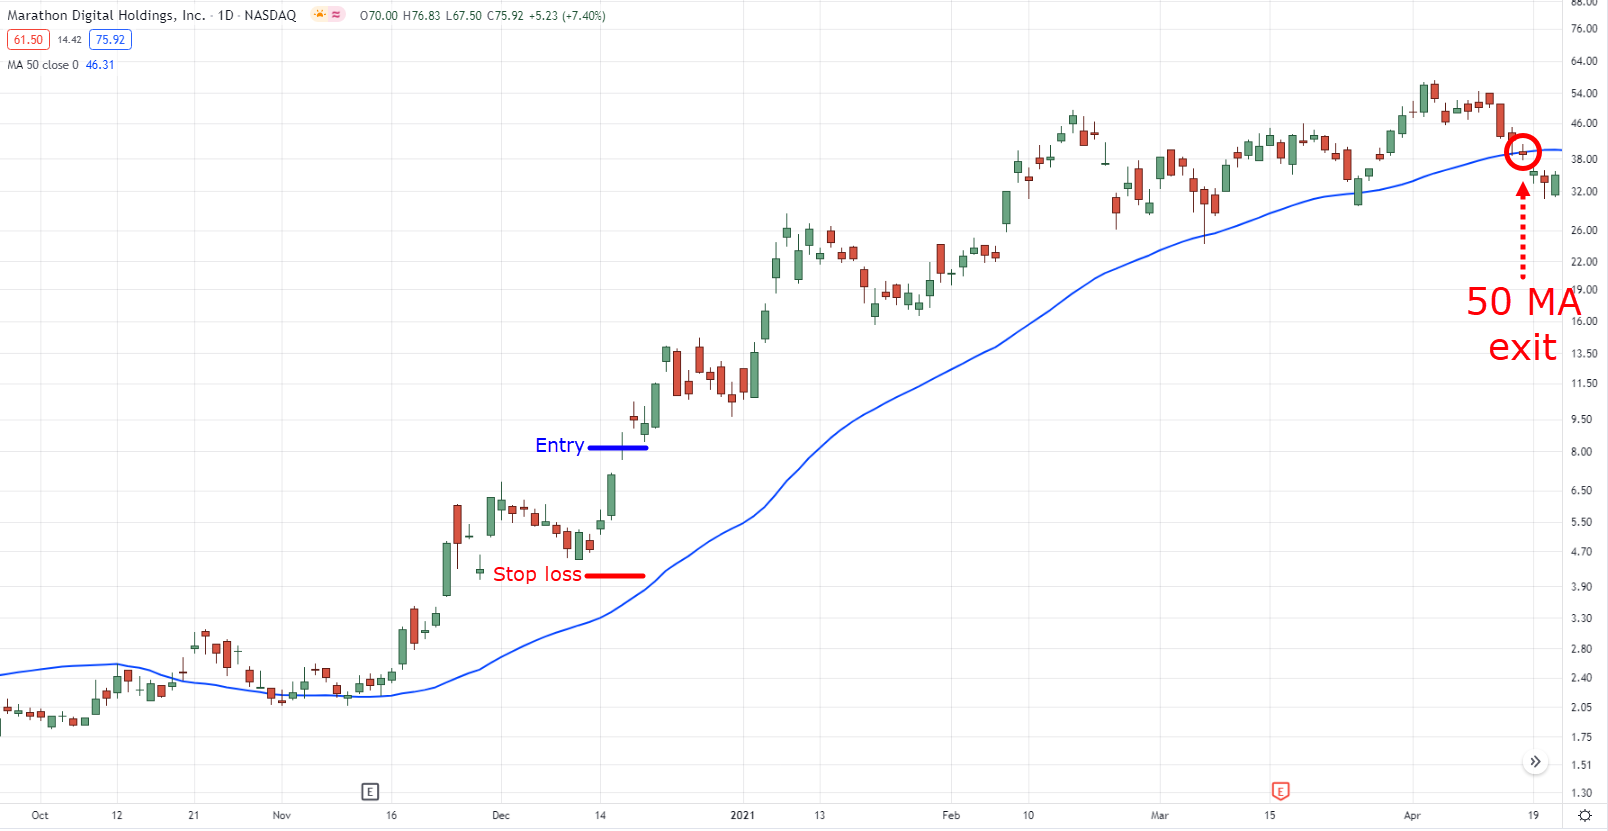
In this case, you want to use the 50-period moving average as your trailing stop loss.
It means that you will not exit your trade until the price closes below the moving average.
50 MA trailing stop exit on MARA daily timeframe:
That’s it!
I know it’s simple, but that’s how it should be.
Because the more you complicate your strategy by adding random variables…
The more impossible it is to pinpoint what works and what doesn’t (and which one to improve or optimize).
Nonetheless, if you’re a trend follower, then this strategy is for you.
Strategy #2: Bull flag pattern range breakout strategy
With this strategy, your technical analysis skills will be tested.
At this point, you should be a pro at plotting support and resistance.
Now recall, this strategy is a range breakout strategy.
It means that you need to identify range markets and spot where their support and resistance are.
So let’s put you to the test…
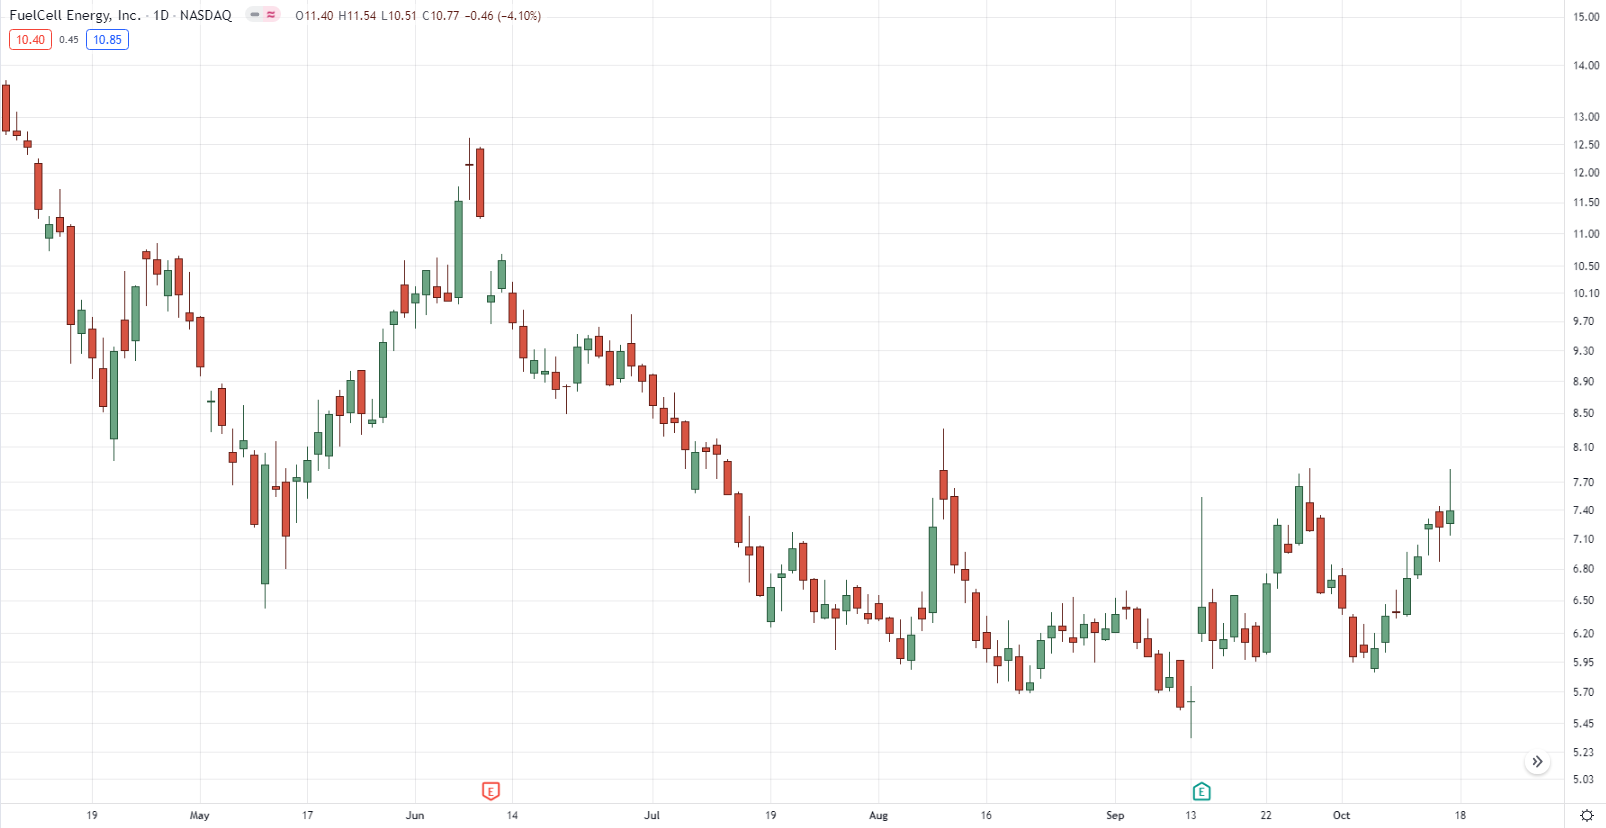
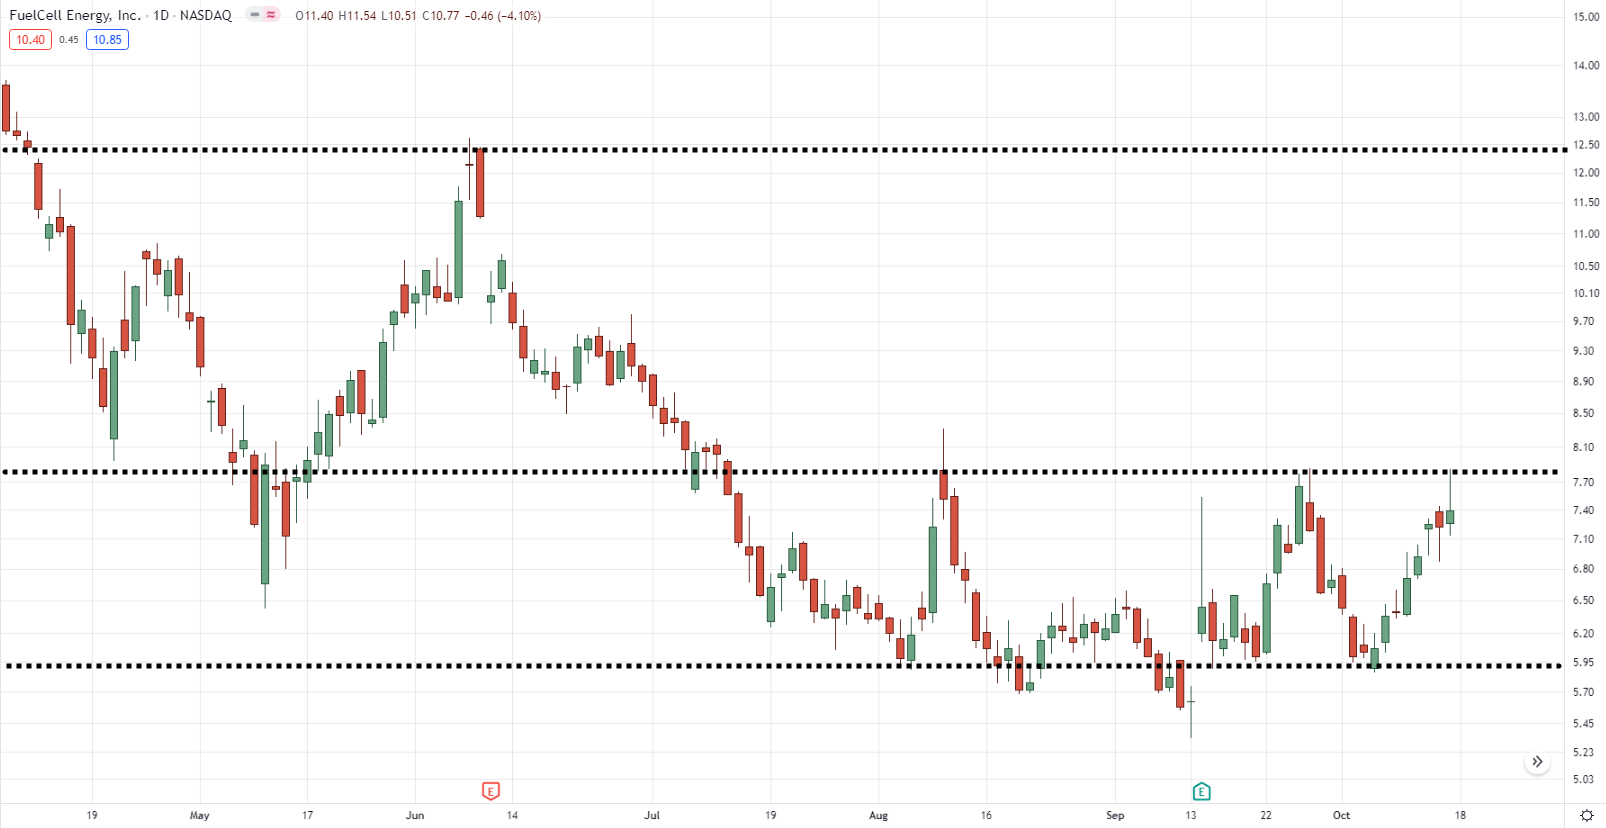
Where do you think are the key levels of support and resistance on the chart?
Blank chart on FCEL daily timeframe:
Now here’s mine…
Support and resistance on FCEL daily timeframe:
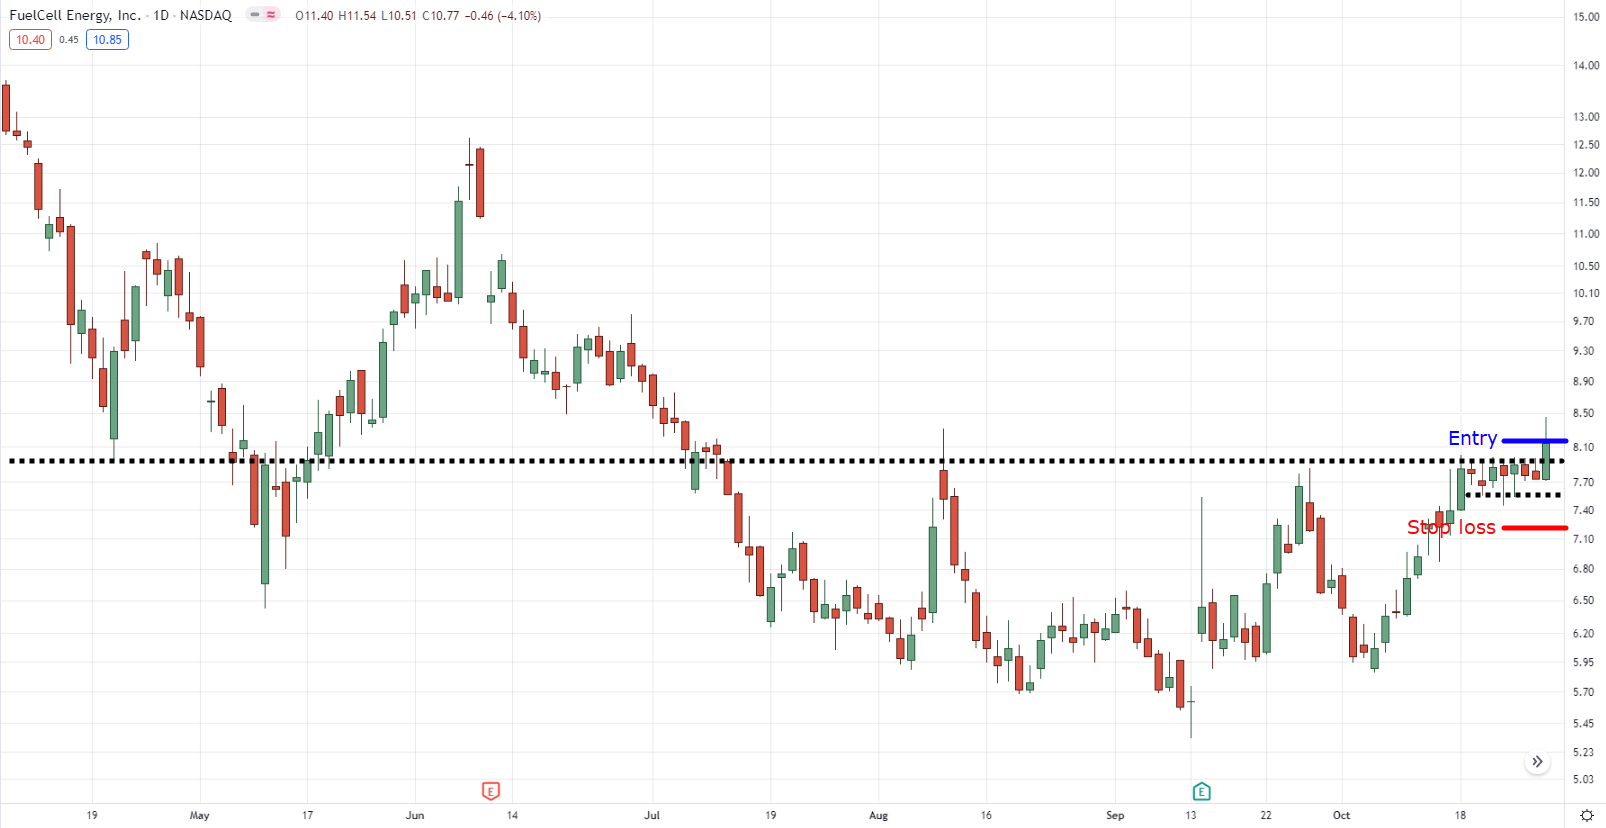
With your areas now plotted, the next thing that you’re looking for is for the price to reach the area of support and make a valid bull flag pattern at it or below it.
Bull flag pattern setup on FCEL daily timeframe:
At this point, we’re not sure what type of trend it would be if it develops.
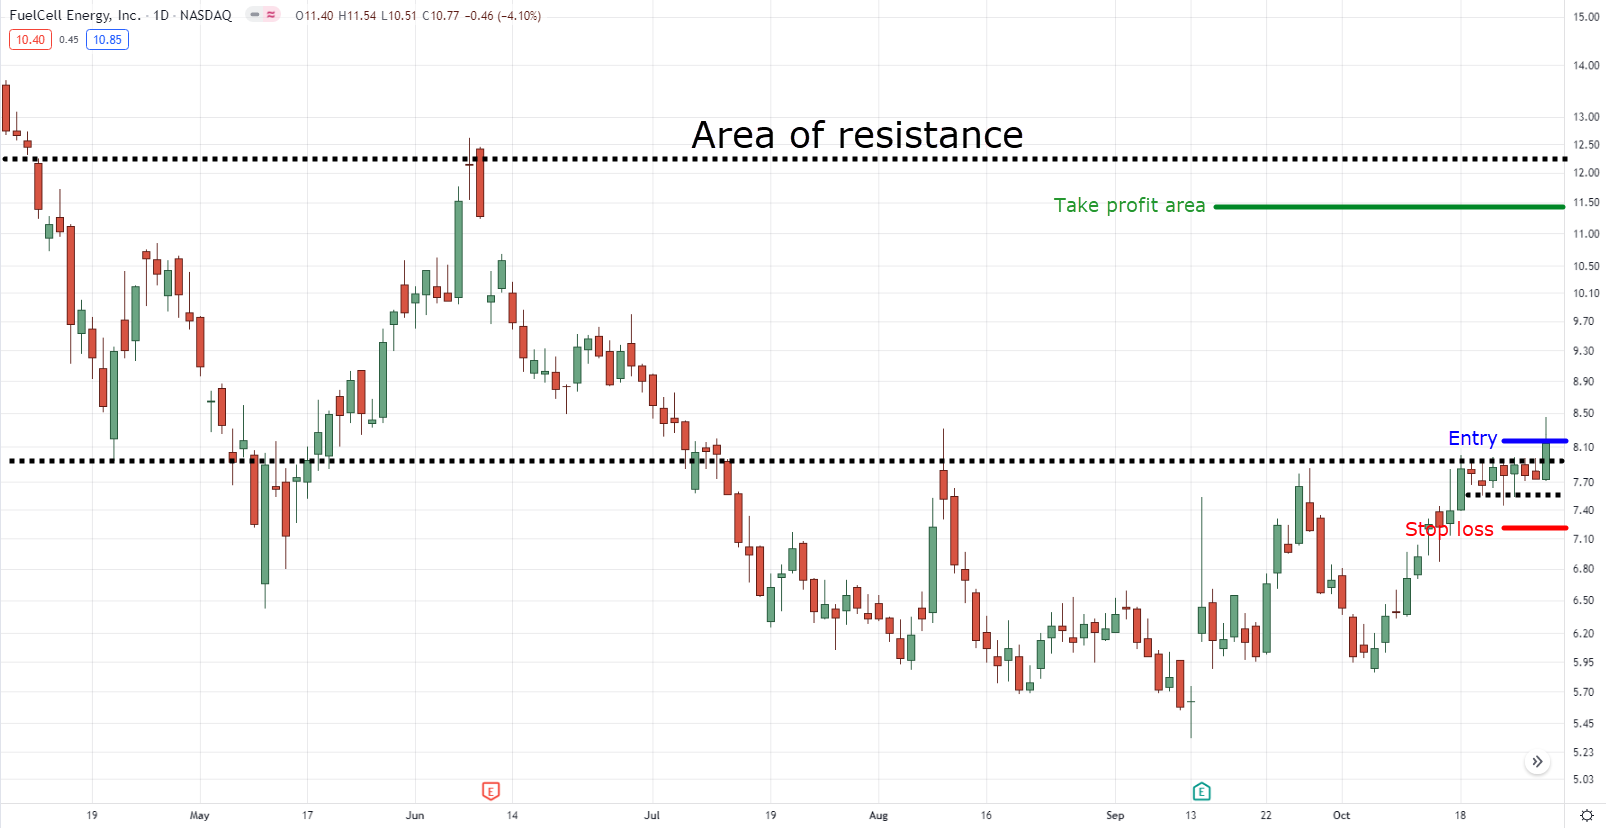
That’s why I suggest taking your profits below the next area of resistance you’ve plotted on the chart.
Bull flag pattern fixed take profit on FCEL daily timeframe:
Again, you must be already familiar when it comes to plotting support and resistance.
So if you want to improve your skills in plotting them, then I suggest you read this article: Support and Resistance Trading Strategy — A Beginner’s Guide
And finally…
Strategy #3: Bull flag pattern trend reversal strategy
Not to be biased, but this one is probably my favorite out of the three due to its simplicity (okay, that sounds pretty biased).
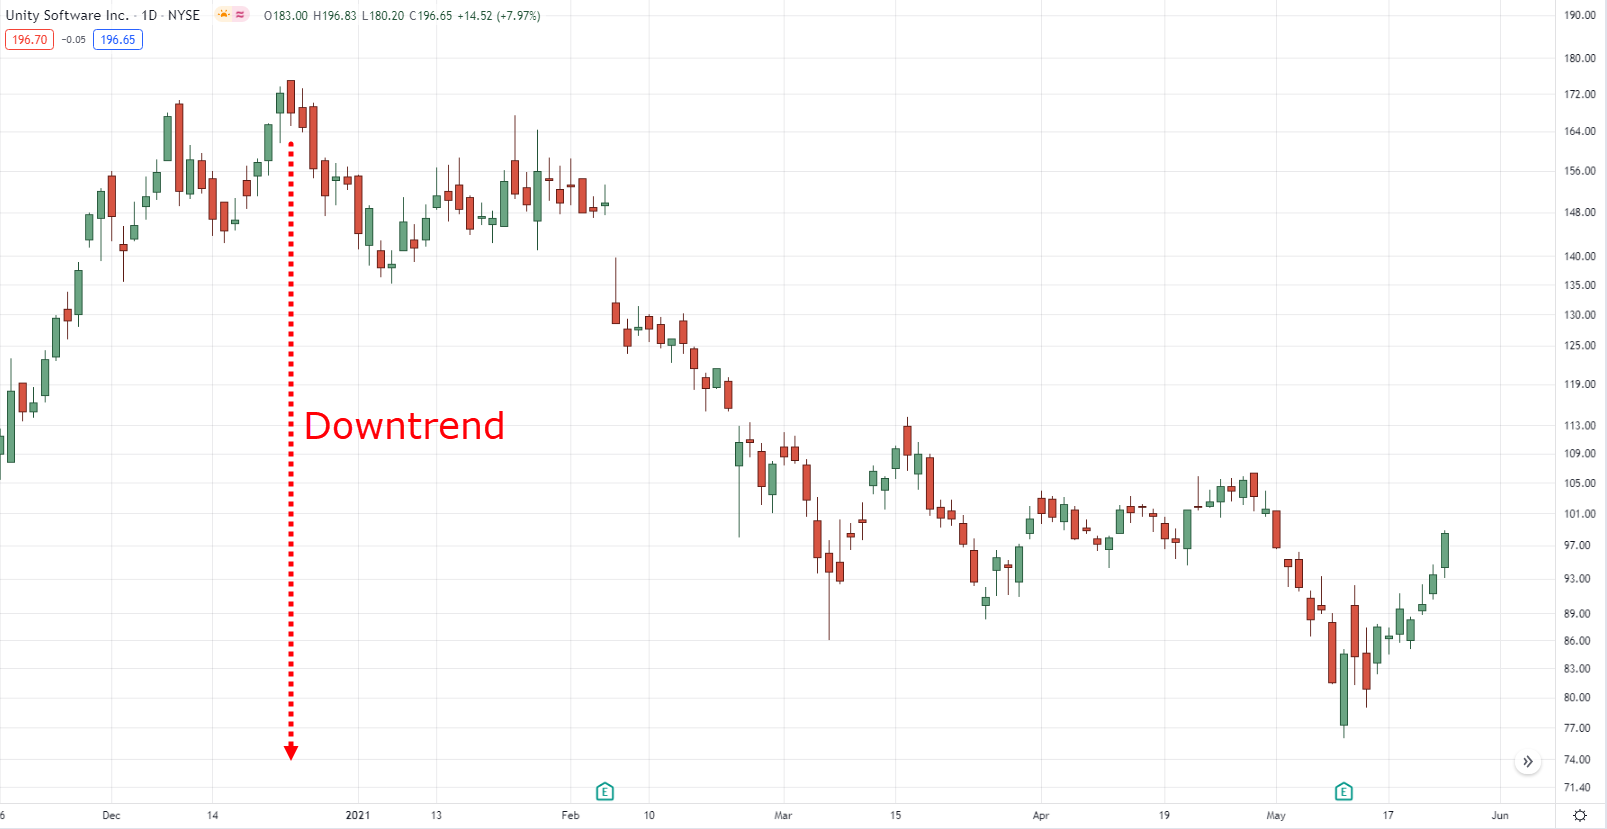
Now since this is a trend reversal strategy, you’d want to look for downtrends.
So the more beat up the market is, the better (and that’s the best part about this).
Downtrend on U daily timeframe:
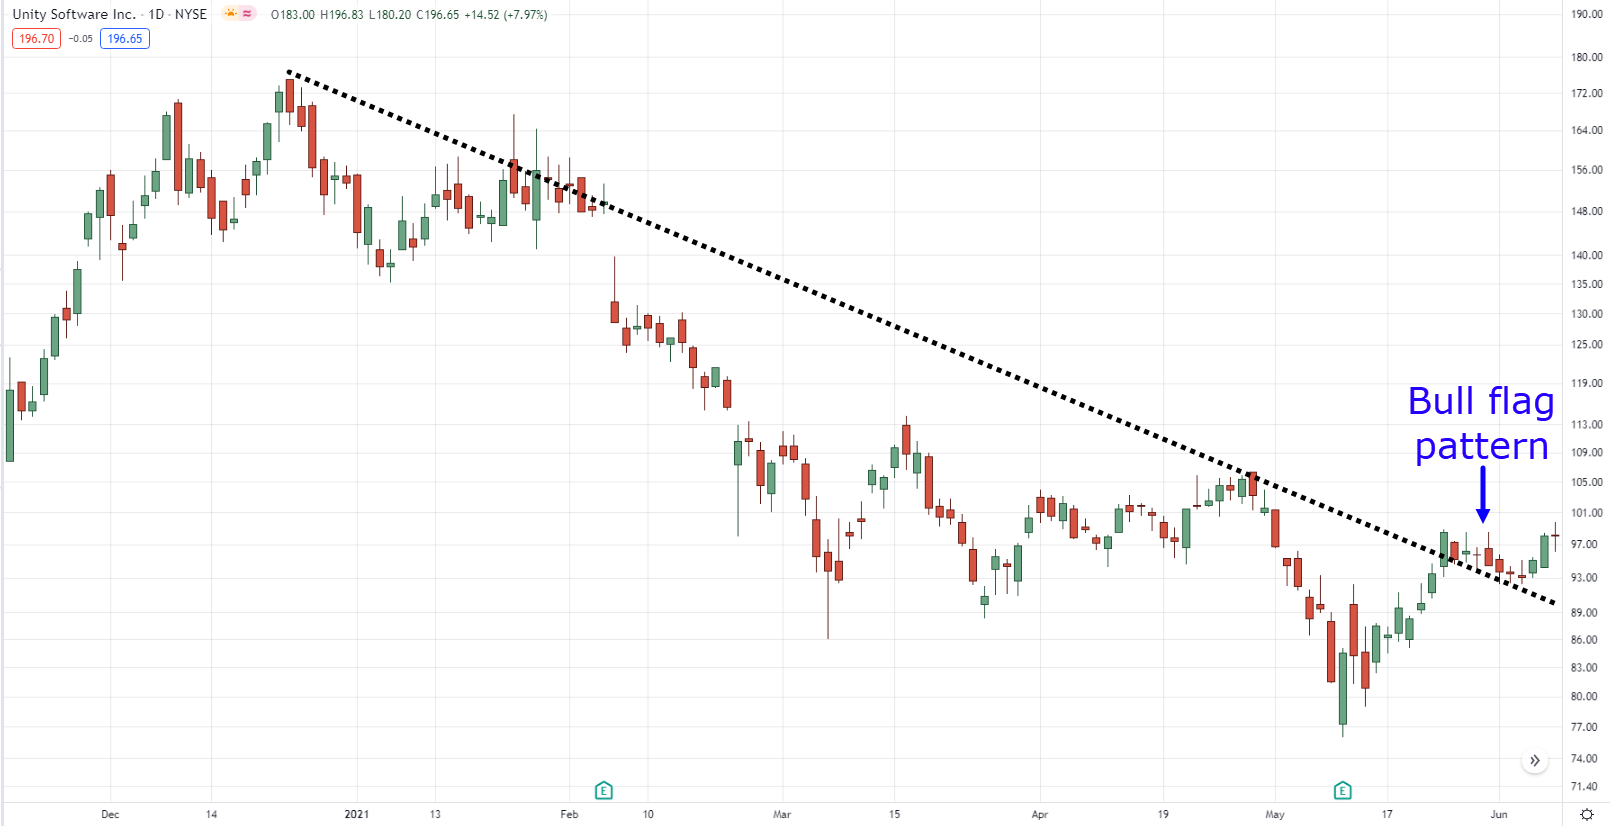
Once it breaks its upper trend line resistance, the next thing is that you want the price to form a bull flag pattern.
Bull flag pattern on U daily timeframe:
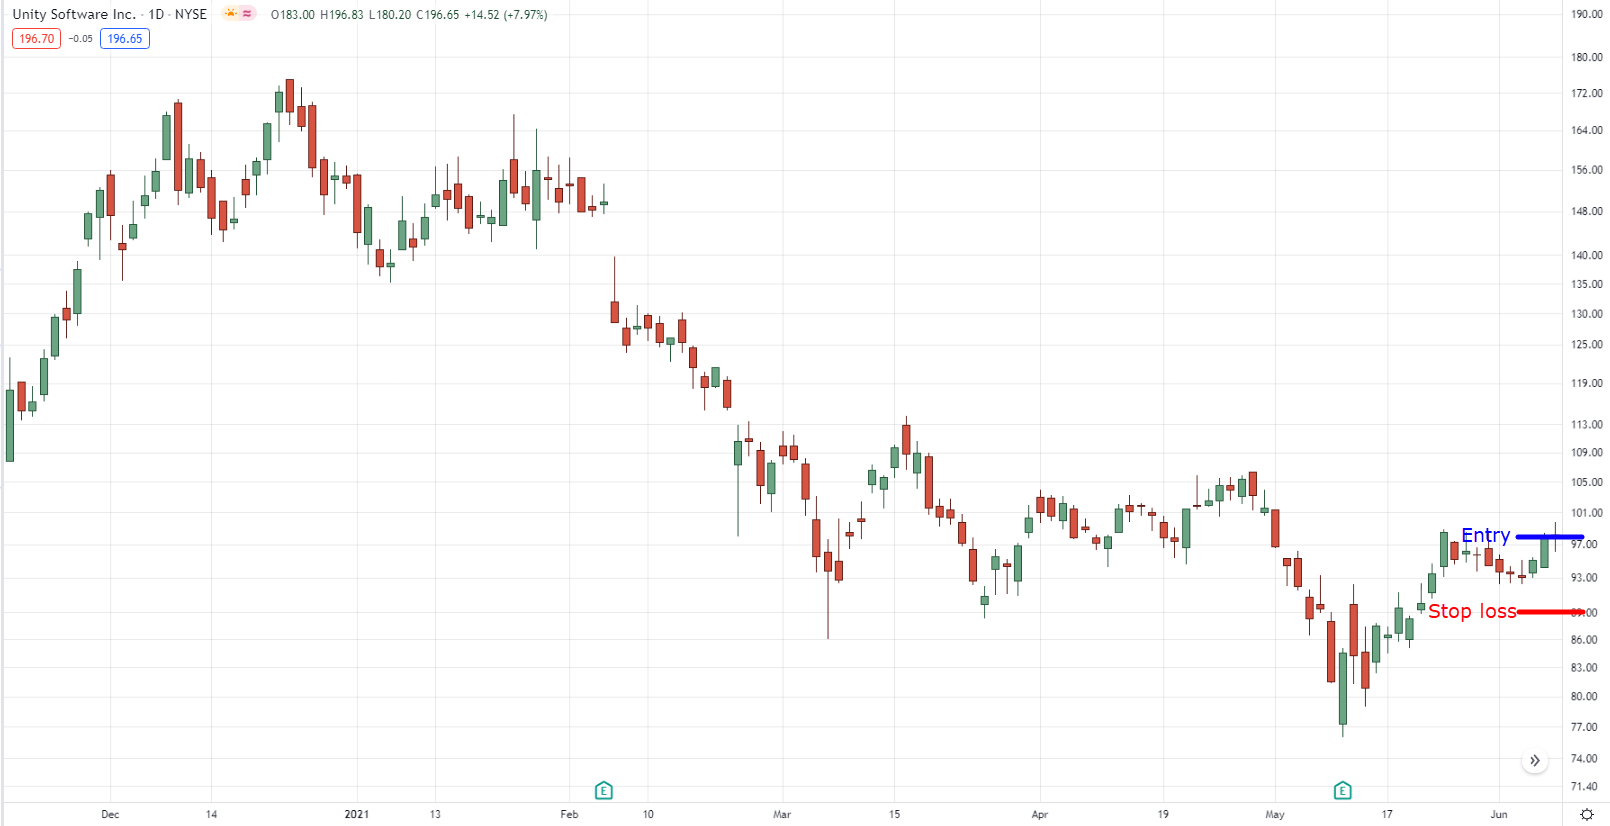
Bull flag pattern entry and stop loss on U daily timeframe:
I repeat.
No bull flag pattern.
No trade.
Because it would tell us that the level isn’t sustaining pretty well, and it might be a false breakout instead.
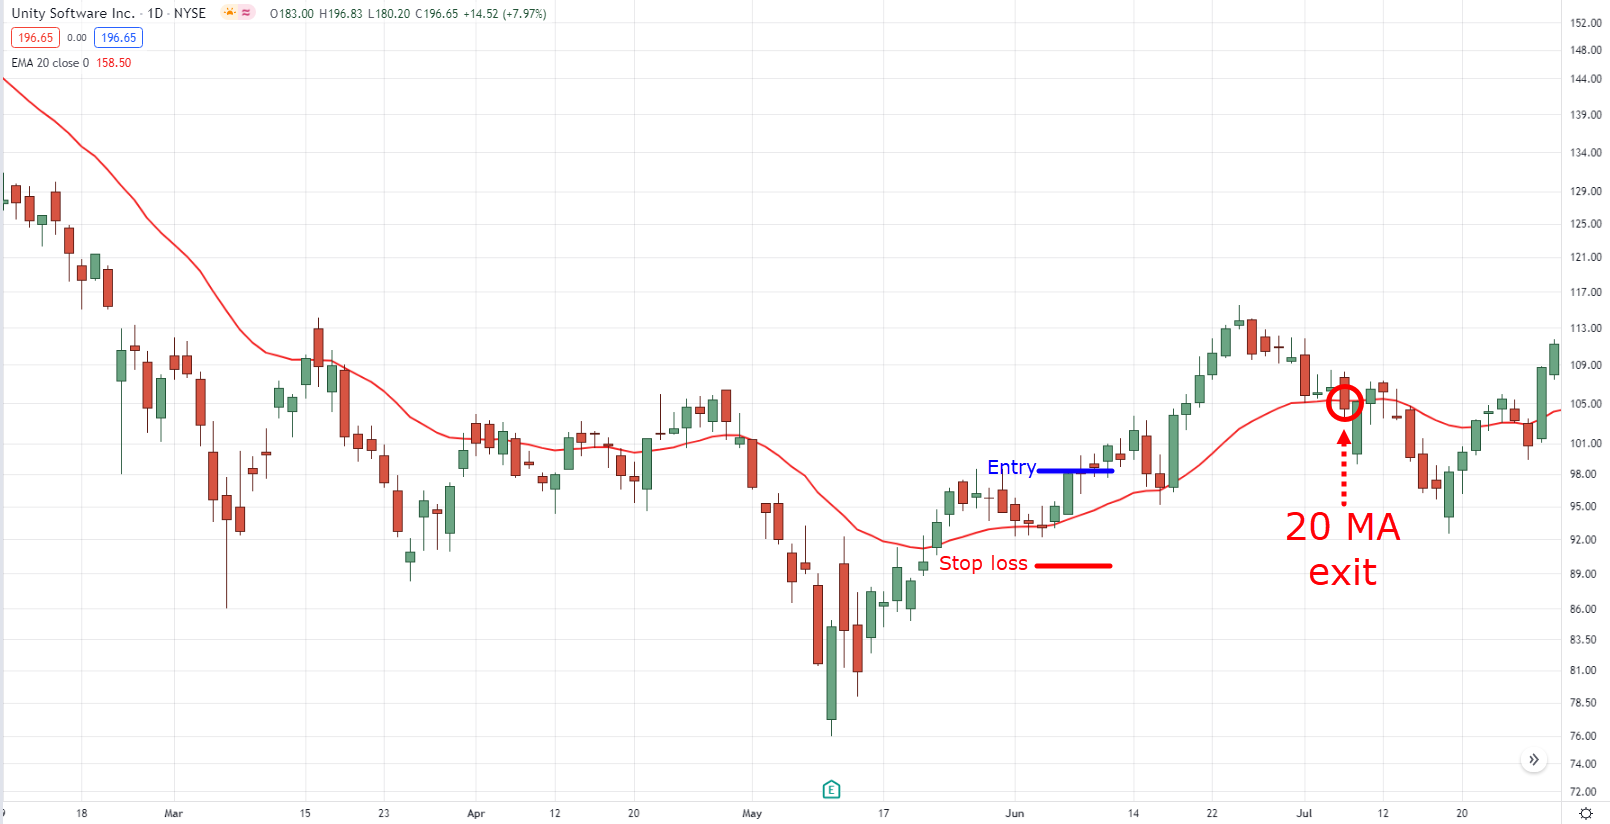
Finally, I suggest using a tight trailing stop loss such as the 20-period moving average.
Why?
Because there’s still a chance that the trend never develops or it’s a new range in the making!
20 MA exit on U daily timeframe:
So you want to get out as soon as your trailing stop loss is hit as opposed to having fixed targets.
Makes sense?
You probably have this question in your mind right now:
“Does it work in the Indian markets?”
“Does it work for forex?”
“Does it work for crypto?”
It does!
But I want you to listen closely…
The only way to make this truly work in a way that will grow your trading portfolio is to:
- Apply risk management
- Have a market selection rule
- Execute your trading plan consistently
Which is something I’ll discuss further in future guides.
But before you finish this guide…
I want you to promise me that you will do your work by tweaking, backtesting, and demo trading these strategies consistently first before risking your hard-earned money.
Promise?
Good.
Let’s do a quick recap on what you’ve learned in today’s guide…
Conclusion
- A bull flag pattern consists of a strong-legged move up, which is the pole, and a group of indecision candles, which forms the flag
- It’s essential to determine the price action of the markets first before using the bull flag pattern
- You can use the bull flag pattern to capture trend continuation trades, trend reversals, and range breakouts
There you go!
Now over to you, do you already trade the bull flag pattern?
What’s your experience trading this pattern?
I’d love to hear it in the comments section below!



This is more of a question than a review. Hello Rayner! When timing my entry on lower time frame, say like the 15 min, or 5, should I wait for a retest of the bull flag pattern?
Hey there Manuel, It’s Jet here
When trading the bull flag pattern you must try to be more flexible.
It means that if the prices make a retest and form a bull flag pattern, then trade the pullback.
If the price makes a breakout without forming a retest, then trade the breakout of the flag pattern.
In short, as long as there’s a setup (pullback/breakout) consider trading it!
Loved it ,asuaual great tips and techincals,thanks Rayner
You’re welcome, Kannan!
So I attempted to have strategy 3#(trend line break of structure) as my main strategy because it has a huge risk:reward ratio and barely fails. But I notice that it rarely occurs and I could wait for it the entire month. It’s similar to the range breakout, but I do spot and trade it on the 2-15 minutes timeframes. Again, it’s not an everyday thing, but when it’s there, it barely fails.
It does appear frequently on a trending market. But I noticed that if the moving average do not catch up with it and I enter the trade, I get stopped out, and yet, attempting to place stop loss below the moving average reduces my positions size more than normal making the trade unattractive. So I don’t trade bull flag trend continuation at all, it doesn’t work for me.
I am not a consistently profitable trader yet. But I’m very close because I can feel. And I attribute my progress to you and tradingwithrayber.com. Thank you!!
Hey Mohammed, so delighted to see you do the work and share it with us!
I’d like to get in touch with you, do email me at jet@tradingwithrayner.com
Again, great work, and keep on moving forward!
Thank you for replying! This is the most important reply I’ve ever had.
Looking forward to you reaching out to me, since you’ve done the work we’d like to support you in your trading journey!
Nice exposition of how to trade using the bull flag pattern.. I feel it is proper to enter the trade with buy stop or sell sell stop order depending on your directional bias..
Hey Festus, yes you are right!
Stop orders can be beneficial as well for as long as you place it a bit higher than the breakout point (to avoid false breaks)
But hey, thanks for sharing!
Thank you for this great guide! Have a few questions to clarify please.
1. In your examples, your SL goes below the flagpole. I read that some place the SL just below the consolidation area. Did you do any test before deciding to place SL below the flagpole?
2. Can a single tall Red bar be a flagpole for the next bull flag in a uptrend?
Cheers!
Hey there Red, I think it would be helpful if you point out which example you’re referring to
But normally bull flags are my favorite setup as it always gives me a chance to place my stop loss tighter
Meaning, Instead of placing my stop loss below a major support, I just place my stop loss 1 ATR below the flag pattern itself (so, no I don’t place the stop loss below the pole, as I place the stop loss below the flag)
For your 2nd question I’m not so sure, if there’s a huge red bar in an uptrend then that could signify a potential trend reversal, if it breaks trend line support then I’d wait for a bear flag pattern instead.
Or perhaps you mean a GREEN bar instead of a red bar?
If so, yes, it can be the next bull flag, but until a flag is actually formed, I’d just consider it as a normal impulse move by the market
I hope that helps!
Hello bro, thanks a lot for such an amazing strategy. This has been a great experience to me in learning such a strategy. l would like you to inform me more of these strategies because am a beginner in forex trading at 19 years old. I would be so gland and awaiting for a proper reply.
Thanks alot.
Hey Cathbert, first of all, congratulations on your journey so far!
Also, rest assured that there are more strategies to come, finally, take your time as time is in your hands right now!