
This post is written by Jet Toyco, a trader and trading coach.
Whenever you read or watch a market analysis report…
You’ll always hear something like:
“This stock is about to breakout!”
“Anticipate a breakout here on this currency pair!”
“This crypto coin has broken out, hold!”
Sounds familiar?
Now, of course…
Reading those breakout calls encourages you to enter a trade or perhaps gives you the confidence to hold a trade!
But here’s what you’re missing out buddy:
Those calls tell you when to buy, but often don’t teach you when to sell.
So…
- When exactly should you enter when it comes to trading breakouts?
- How should you manage the trade?
- When should I take profits?
Don’t worry if you don’t know the answer to some of those questions, my friend.
Because in this guide, I will teach you what there is to know about trading breakouts so that not only you would know when to enter them, but also when to exit them.
Sounds good?
Then let’s get started…
Trading breakouts: What is it and how does it work
To put it simply…
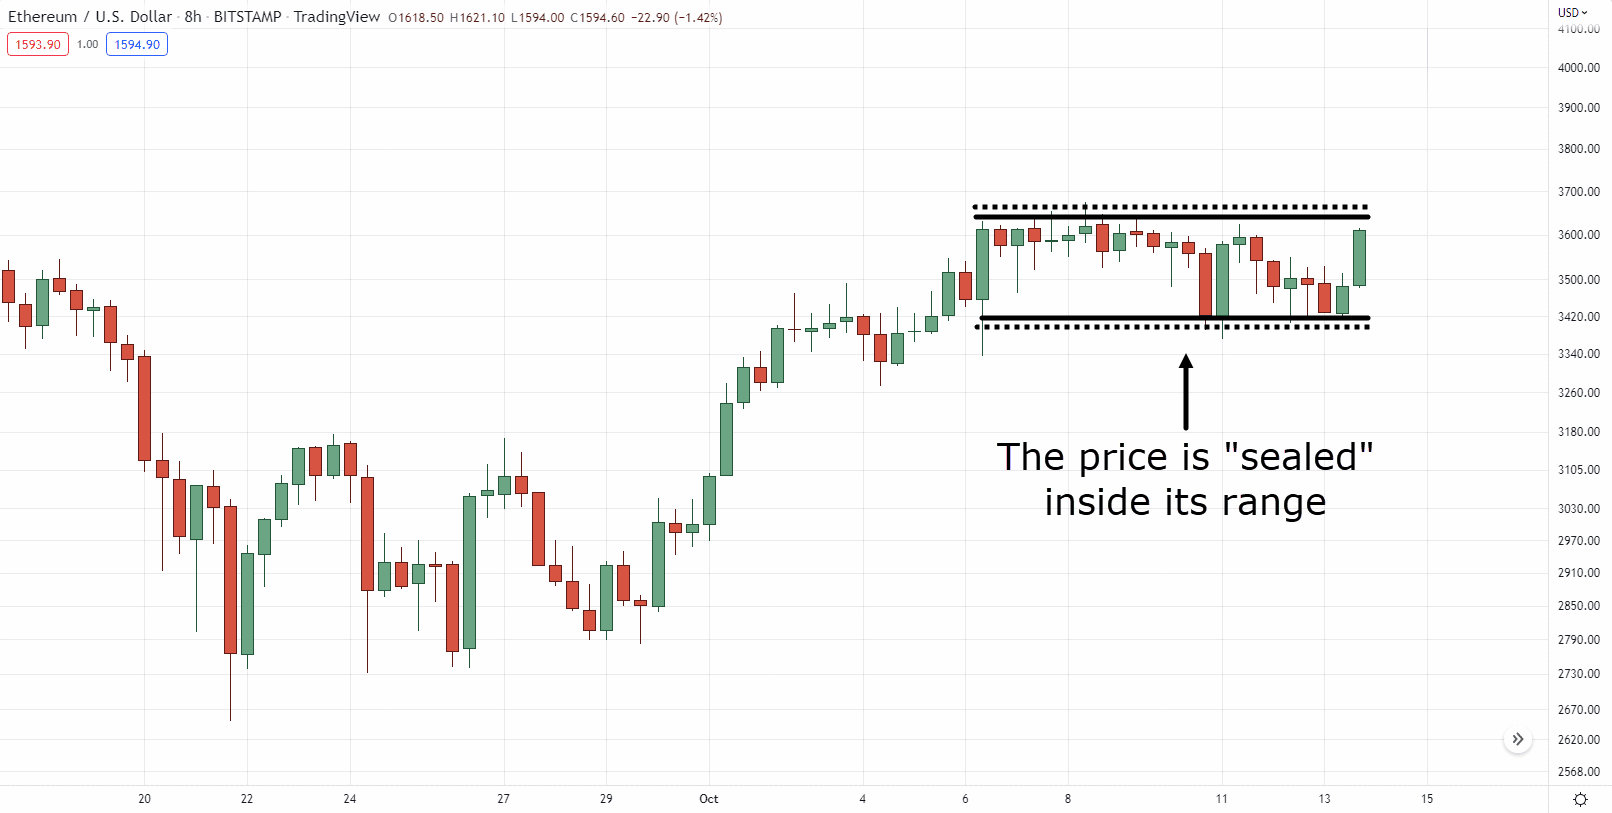
Breakouts are similar to opening a pack of pringles!
Those delicious chips are sealed and trapped for a few months waiting for you to open and eat them:

Breakouts are like being the first one in line when the building opens.
You’re the first one to explore the whole area:
And It’s the same in trading!
Trading breakouts is capturing the price as it “opens” up from its range waiting for you to eat those potential profits:
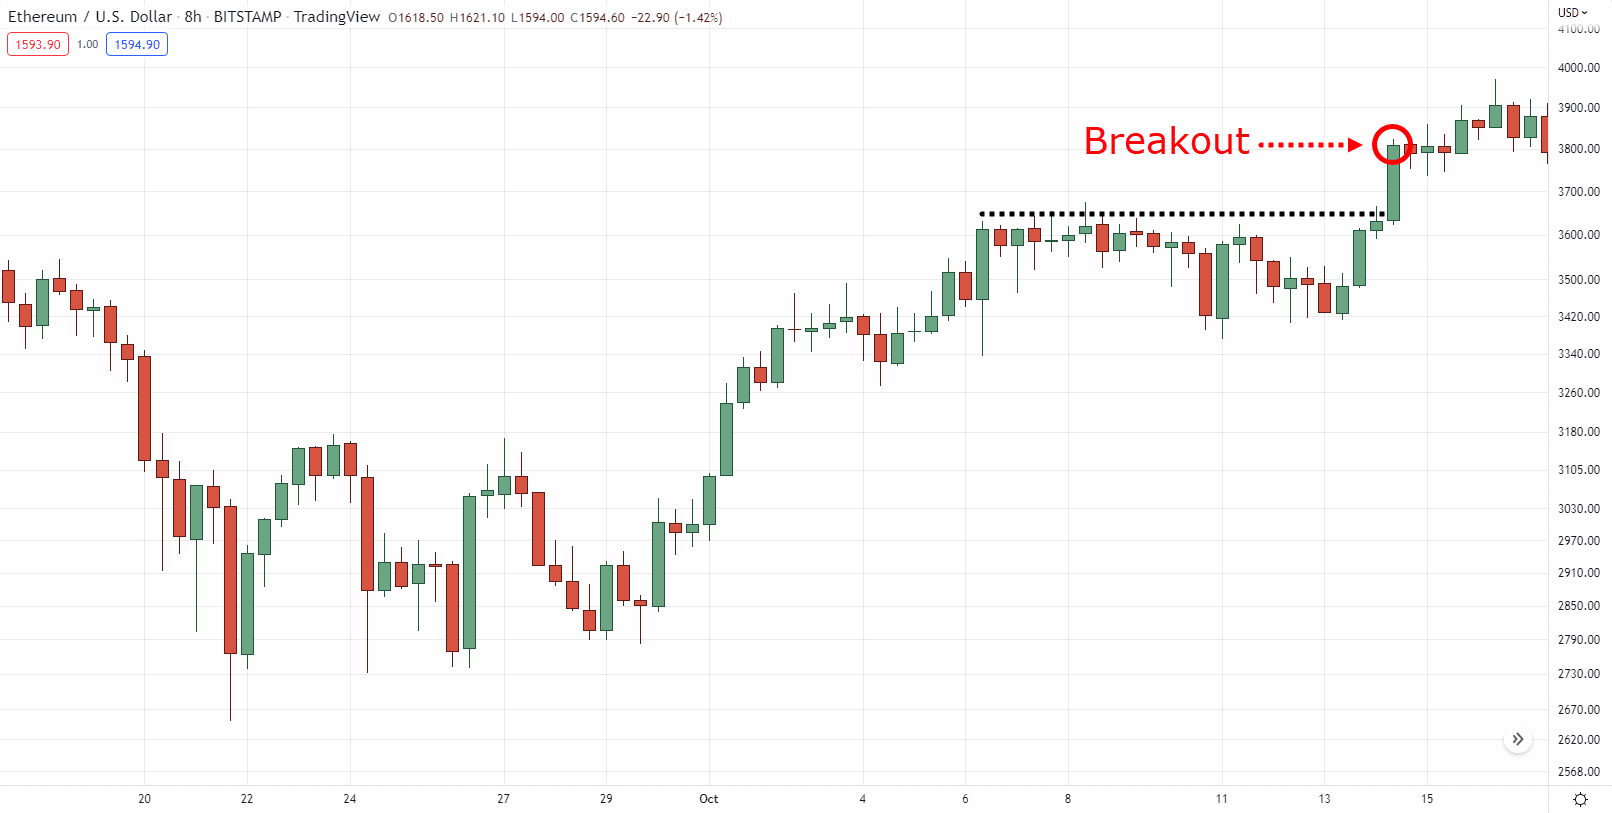
And trading breakouts are the first in line to “enter” the move as the market potentially makes a new swing:
Makes sense?
In other words, a breakout happens when a certain market is transitioning to a new market condition!
Now…
I know that I’ve only shown you one type of trading breakouts which is this:
A pullback within a trend is followed by a breakout.
However…
Did you know that there are many other types of breakouts out there?
There are even types of breakouts that let you “predict” breakouts before they even happen!
If you want to know what they are, then keep on reading…
The “secret” to trading breakouts
Trading breakouts can come in different forms such as:
- Trend continuation breakouts
- Trend line breakouts
- Volatility breakouts
Let me share them with you…
(Boy you’re in for a treat!)
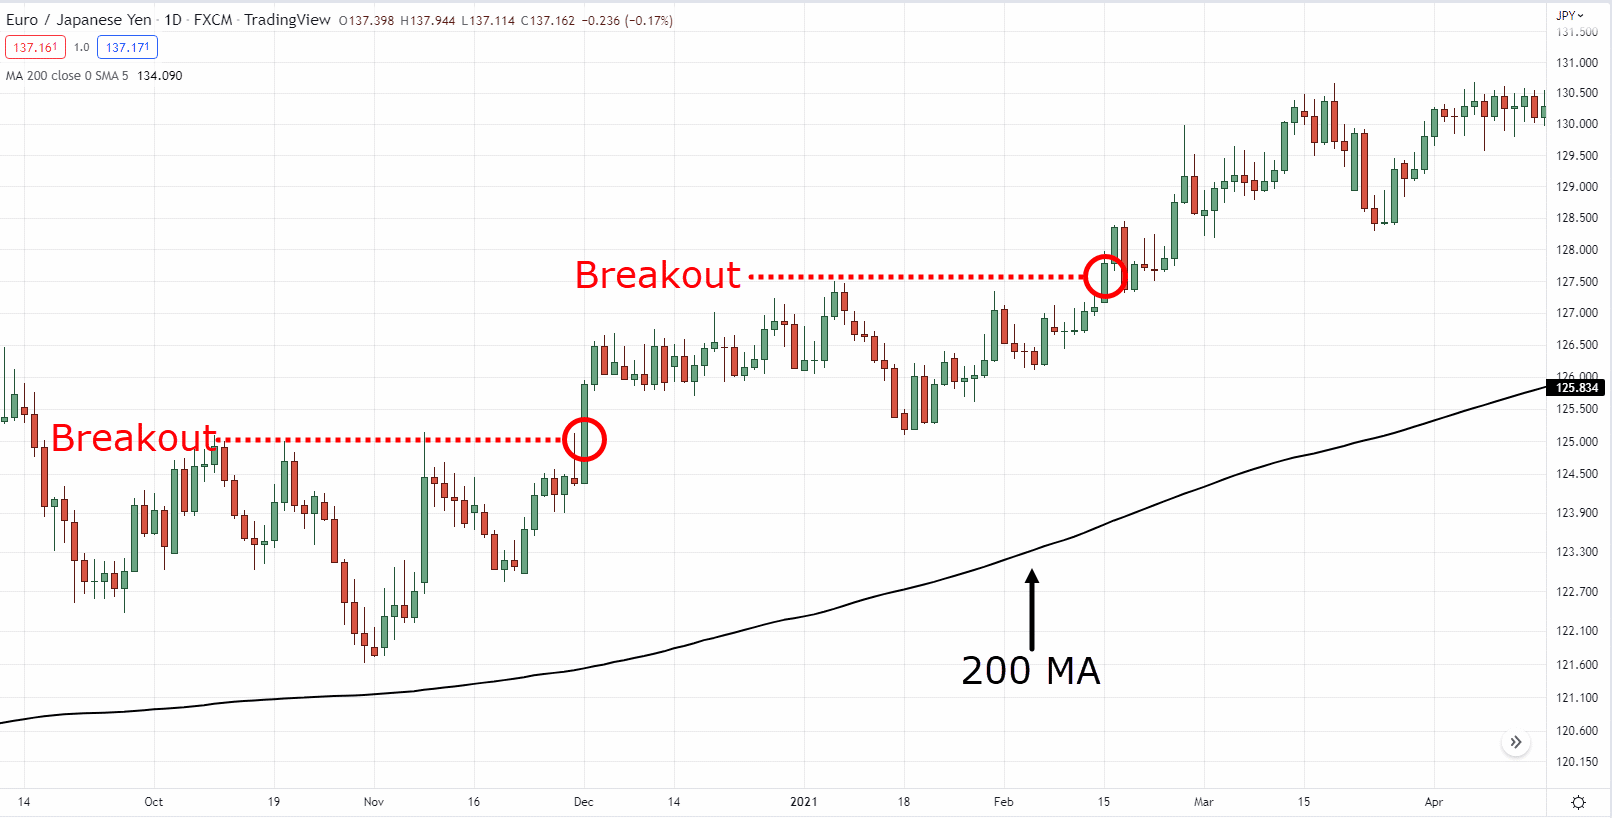
Trend continuation breakouts
This one’s easy as you’ve already seen in the previous section!
Basically…
You want to make sure that you have a valid trend going on.
How do we know if it’s a valid trend?
Easy.
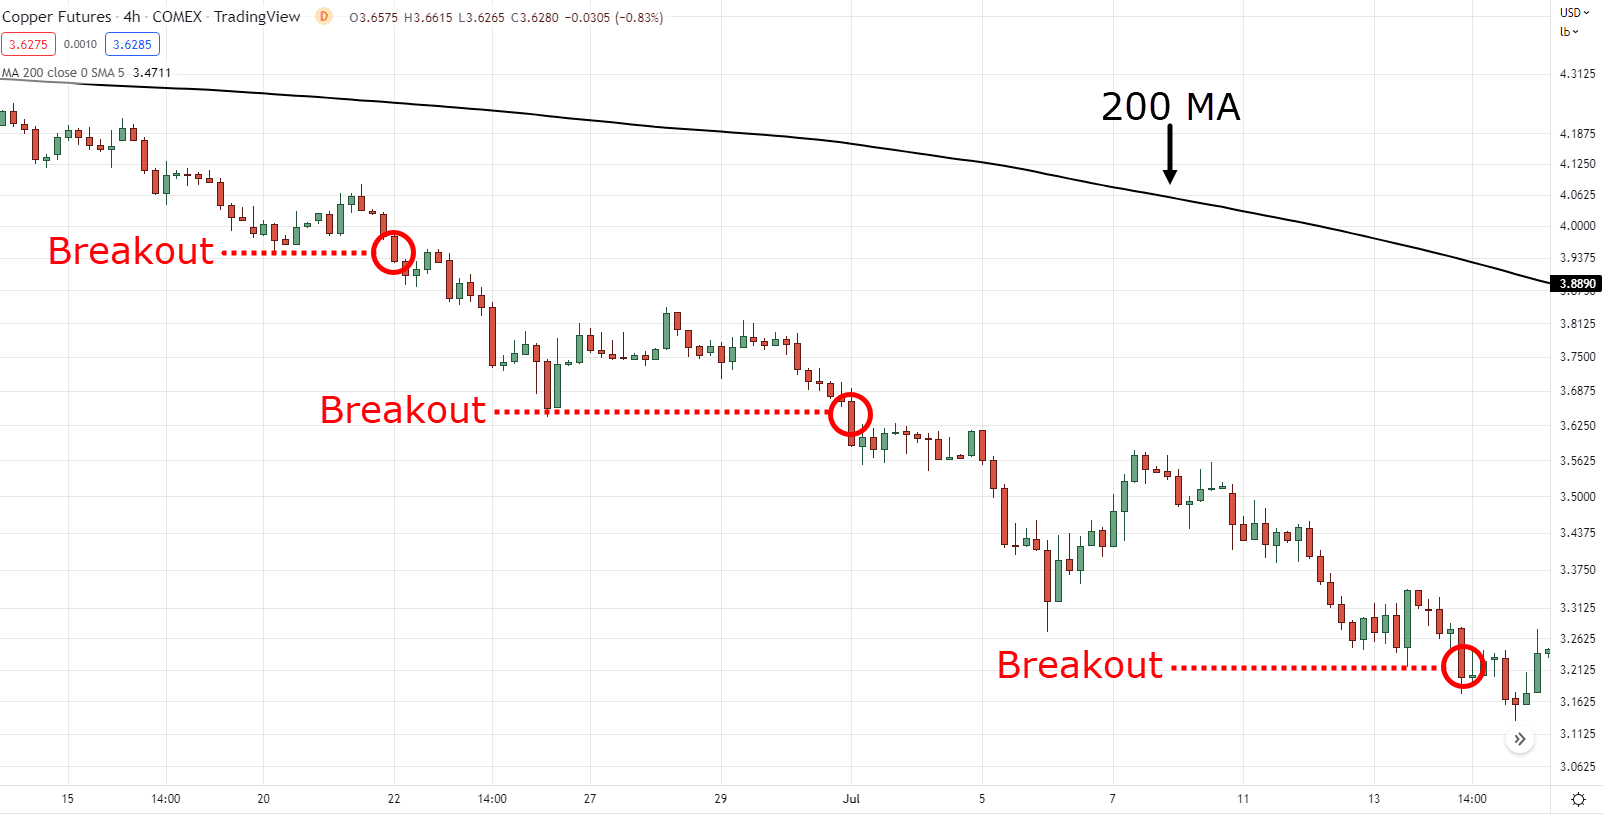
You can use the 200-period moving average to assist you:
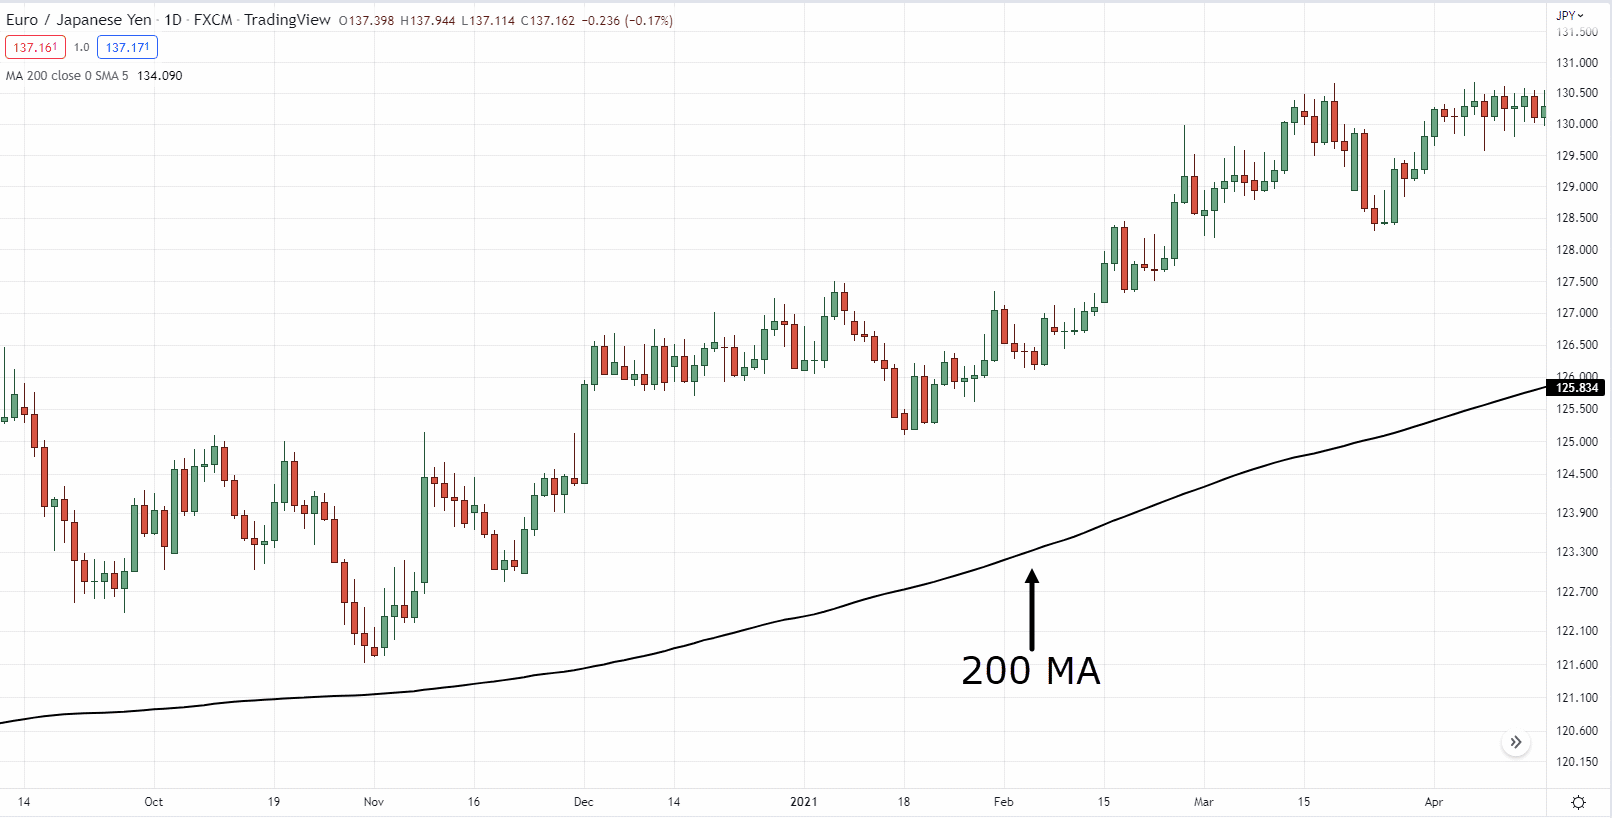
If the price is above the 200-period moving average, then it makes sense for you to look for breakouts towards the upside:
And it’s the opposite when the price is below the 200-period moving average:
And by the way…
Whether you want to use the 190 MA, 150 MA, or 112 MA, it doesn’t matter.
What matters is that you’re using a long-term moving average period to identify trends!
So, if you want to learn more concepts about the moving average, then you can check this guide out: The Moving Average Indicator Trading Strategy Guide
Cool?
Let’s move on…
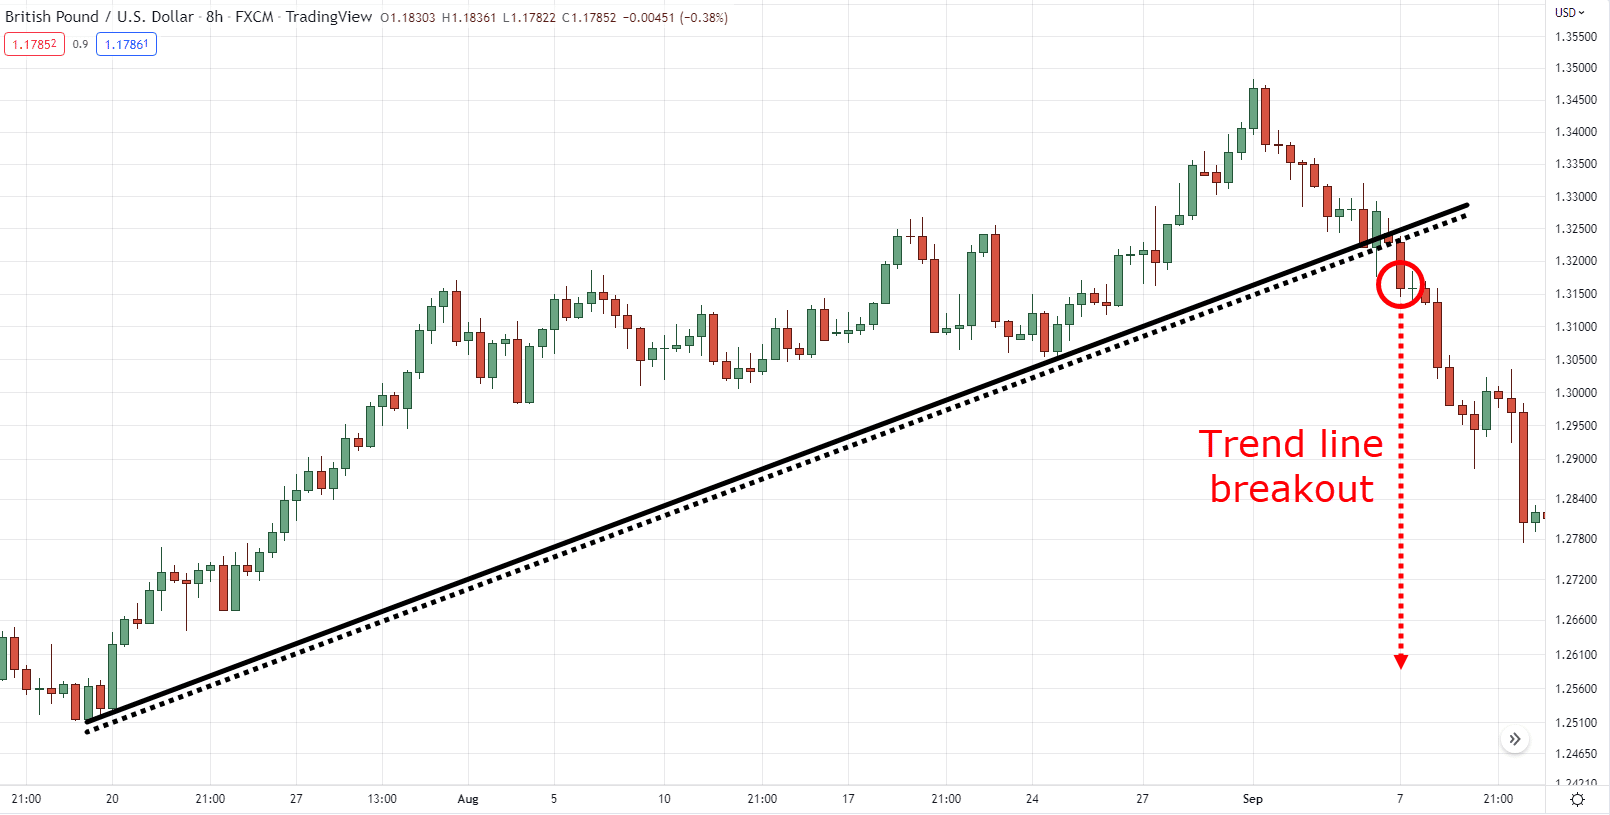
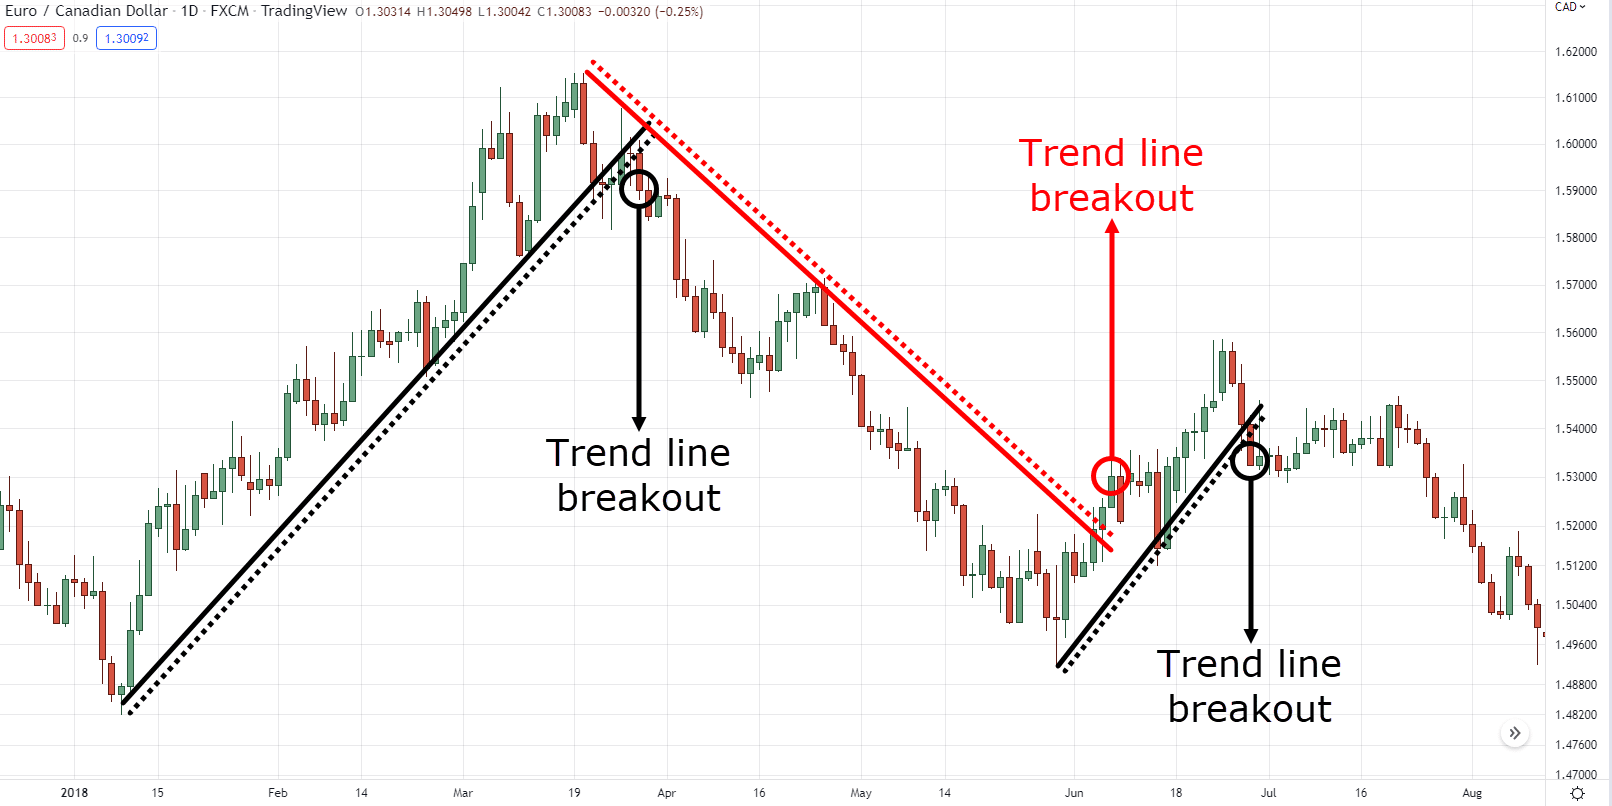
Trend line breakouts
Here comes the interesting part.
Because when it comes to trading breakouts with trend lines…
We are looking for trend reversals here.
That’s right.
Not trend continuations, but trend reversals!
Let me teach you how…
Step 1: Draw a trend line with two valid touches
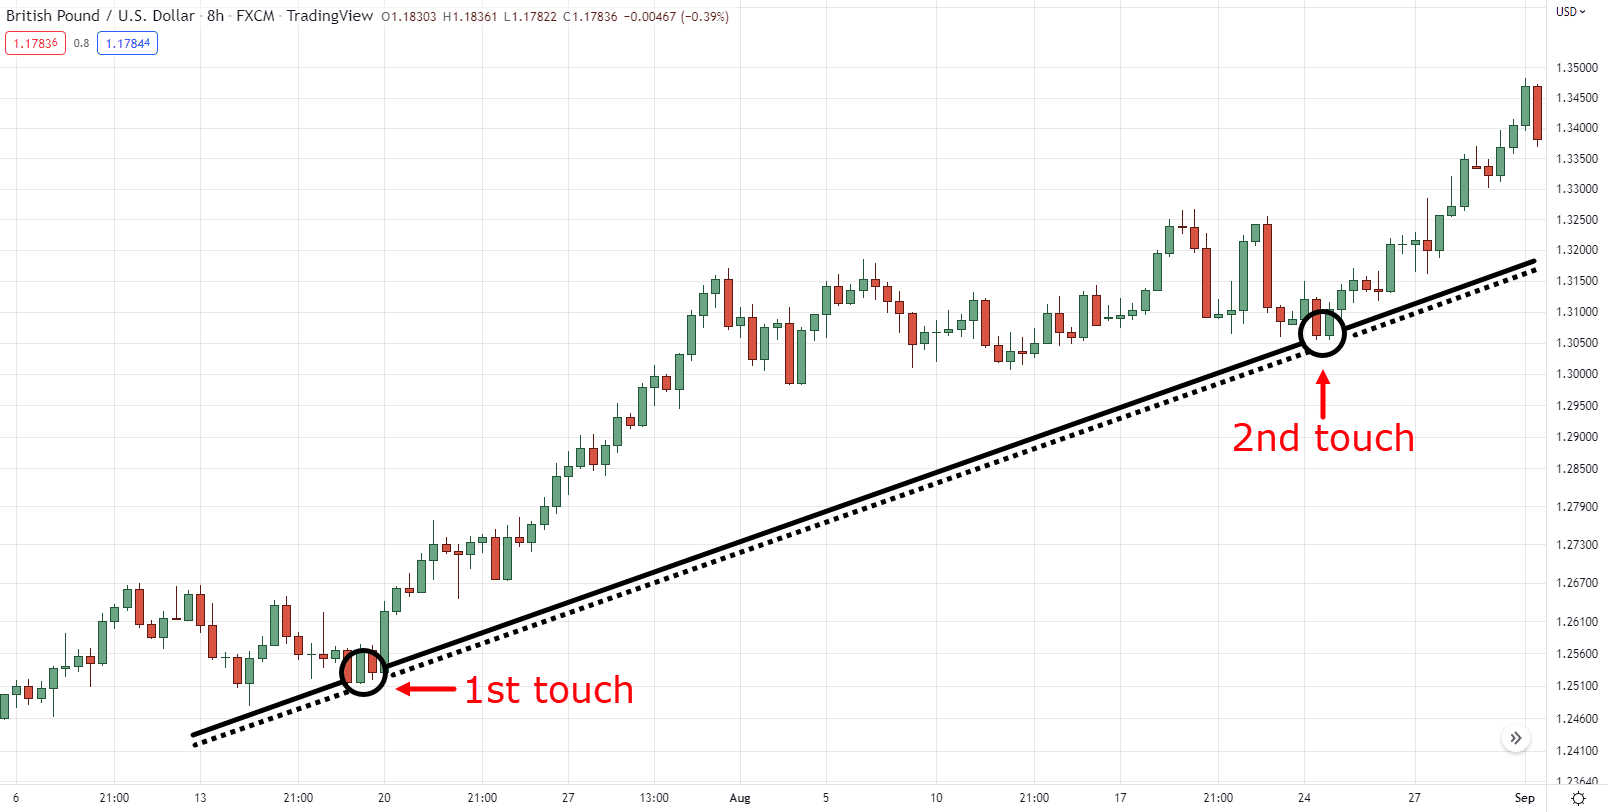
Step 2: Wait for the price to make a strong close below the trend line
P.S. Stay tuned as I will teach you when to enter these types of breakouts later.
At this point you’re probably thinking:
“Wait, that’s now how you use a trend line!”
“Trend lines are meant to be used to capture a trend!”
And you’re right!
Trend lines are often used for you to hop into an existing trend!
However…
You’d be surprised how common trend line breakout reversals are on your chart:
Volatility breakouts
Now, just in case you’ve no idea what volatility is, it’s simply categorized into two things.
- Low volatility market (price movement is still)
- High volatility market (price movement is wild)
Let me show you what I mean…
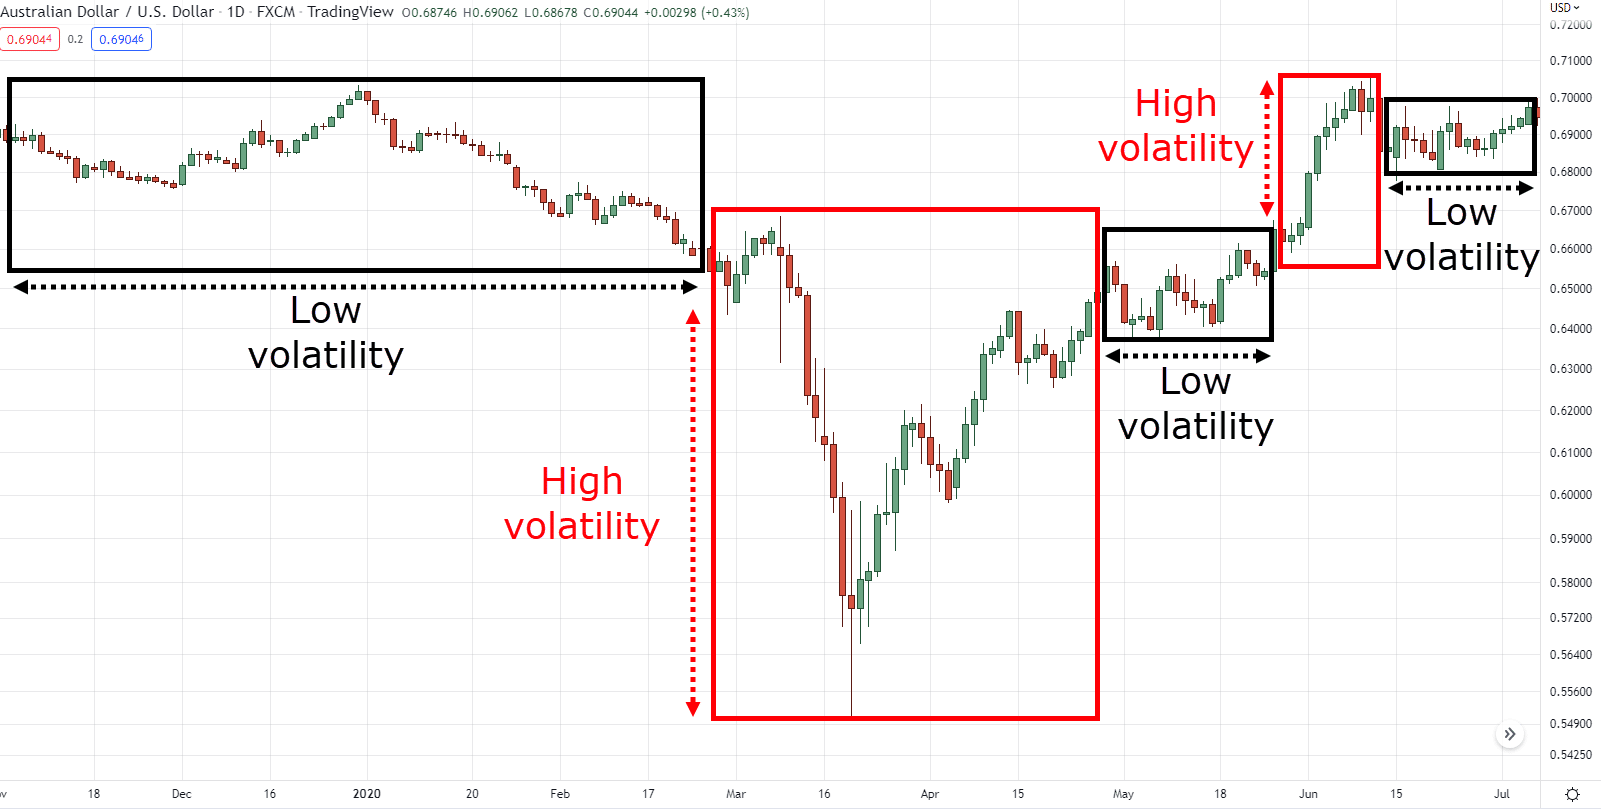
Now there will be a lot of times when you can’t exactly determine whether the price on your chart is a high or low volatility market.
So, what’s the solution?
Use the Average True Range indicator, of course!
Simply put, the ATR indicator is like an “X-ray” vision when it comes to figuring out volatility:
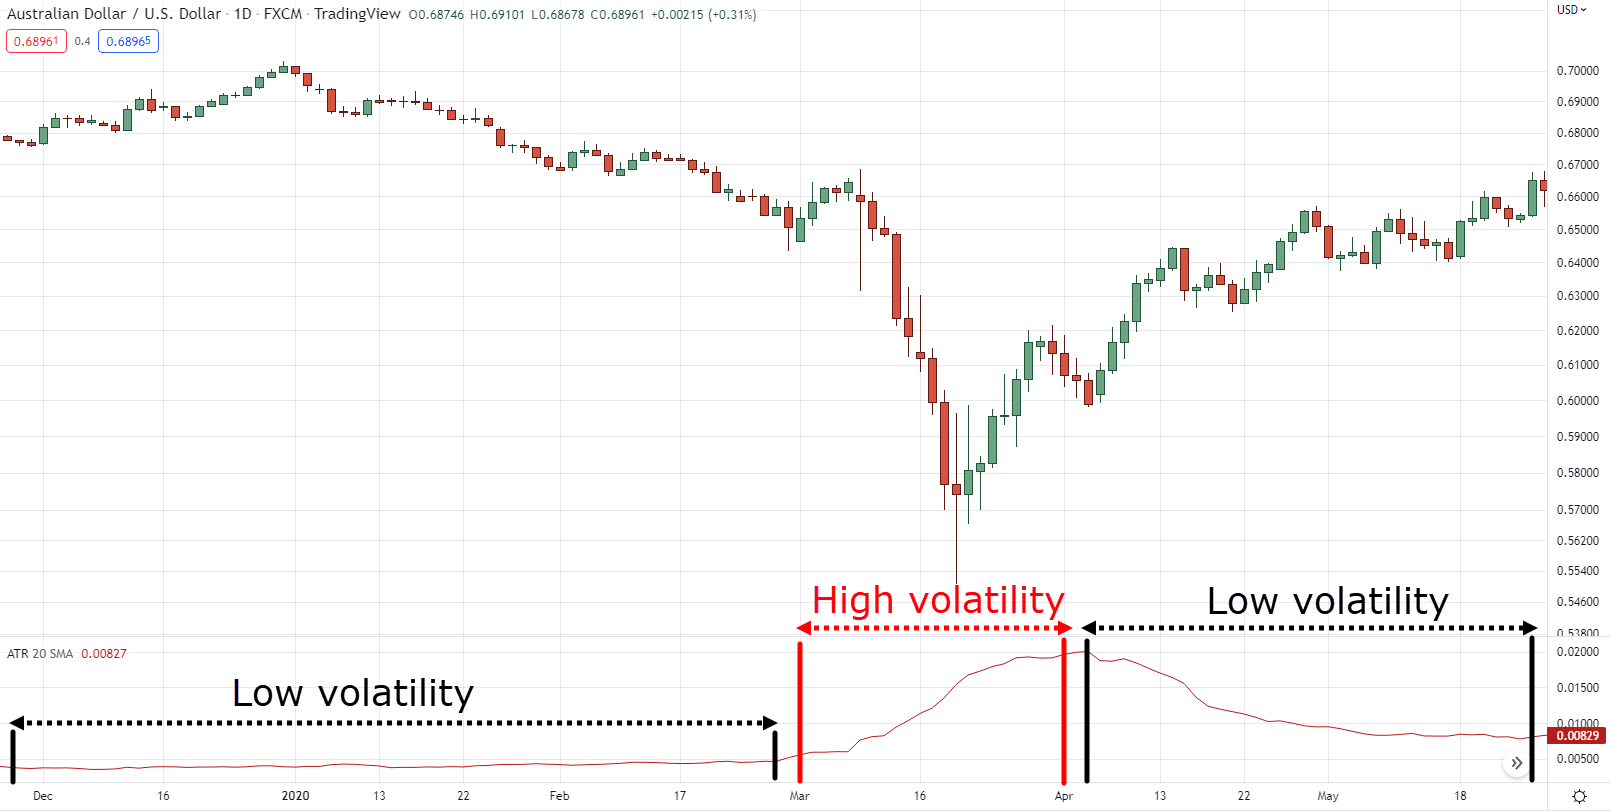
P.S. I used the 20-period Average True Range with the “SMA” calculation
Okay so, when it comes to trading breakouts, how do we find it here?
Don’t worry.
I’ll tell you, and it’s this:
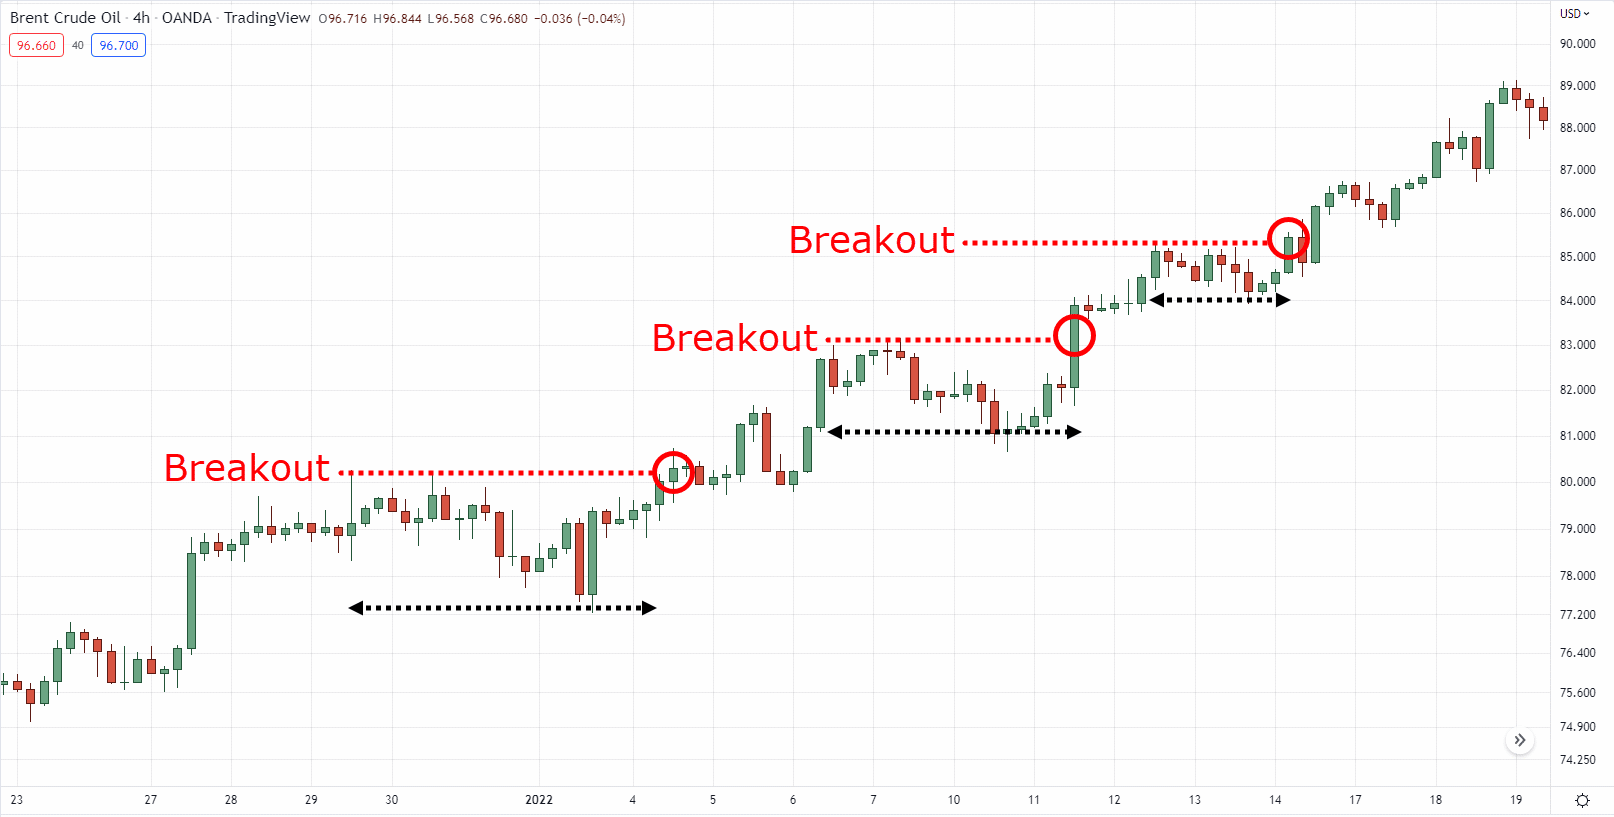
The longer the market ranges, the harder it breaks out:
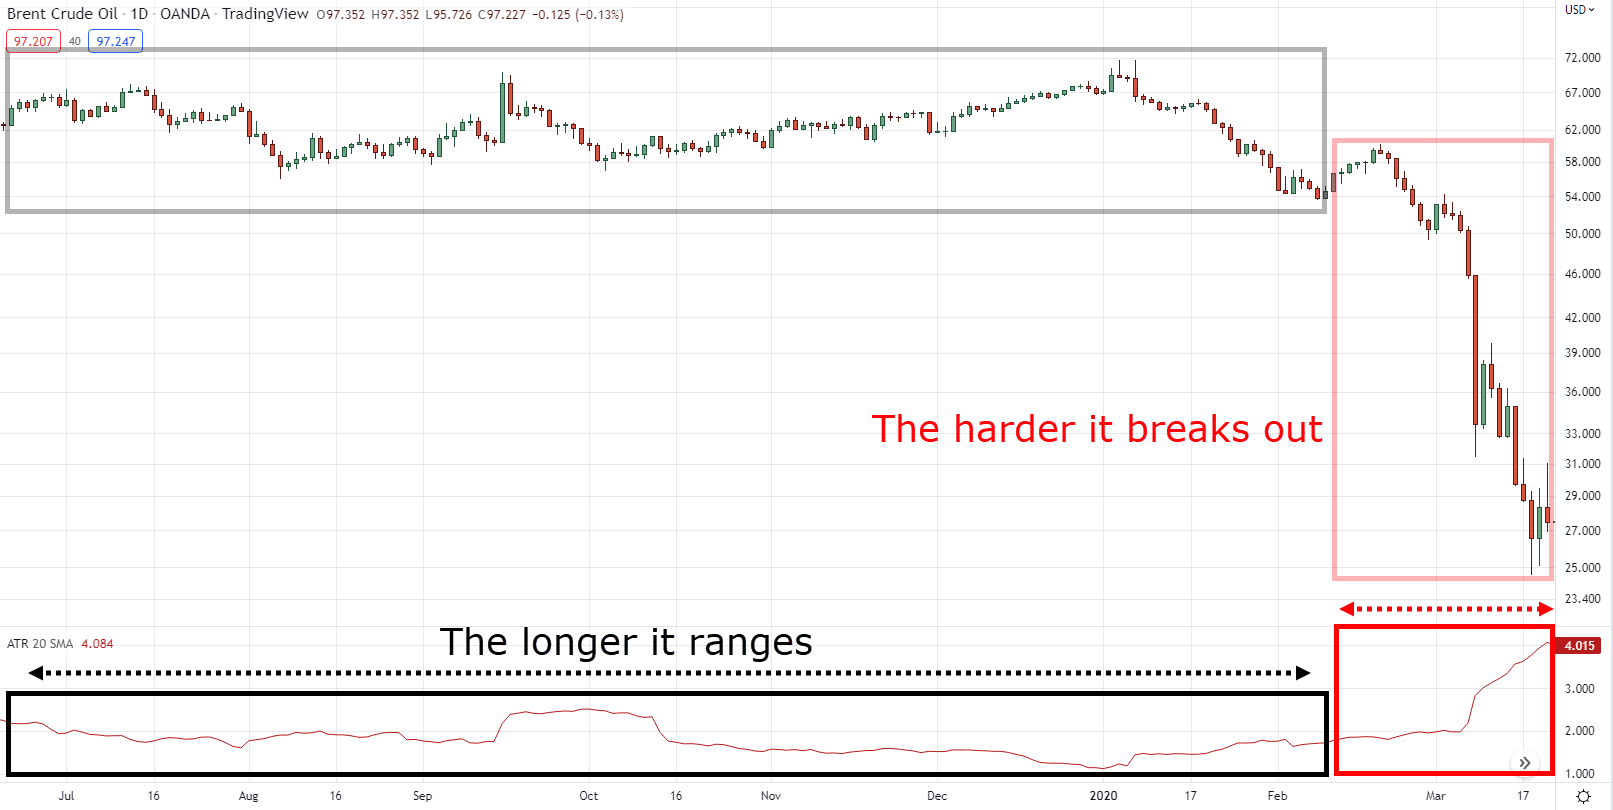
Repeat after me…
The longer it ranges, the harder it breaks out.
This is important.
You better make sure you remember it!
So, the next time you see that the ATR indicator is starting to quieten than usual…

Prepare to look for entry opportunities in case the price breaks out from its highs or lows:

Oh, and by the way, if you want to learn more about the ATR indicator, you can check this out: The Complete Guide to ATR Indicator
Sounds good?
But now that you’re equipped with what the different types of breakouts are there…
Let’s now dive into more technical stuff to trading breakouts.
Shall we?
How to enter trades when it comes to trading breakouts
Let’s put things in perspective.
There are three types of breakouts that I’ve just discussed with you:
- Trend continuation breakouts
- Trend line breakouts
- Volatility breakouts
The next step to identify now is…
How do you exactly enter them?
Do you wait for a candle close?
Do you place a stop order?
Do you wait for the “best” market session?
Not to worry buddy.
That’s what we’ll get into now!
But before I start, here are two questions to get out of the way first:
What timeframe do I use to trade?
The truth is that there’s no absolute answer to this.
Given that the market is liquid, you can apply these concepts in any timeframe and most markets.
So:
- Choose a timeframe that fits your lifestyle
- Choose a market where you know how to apply risk management correctly
All good?
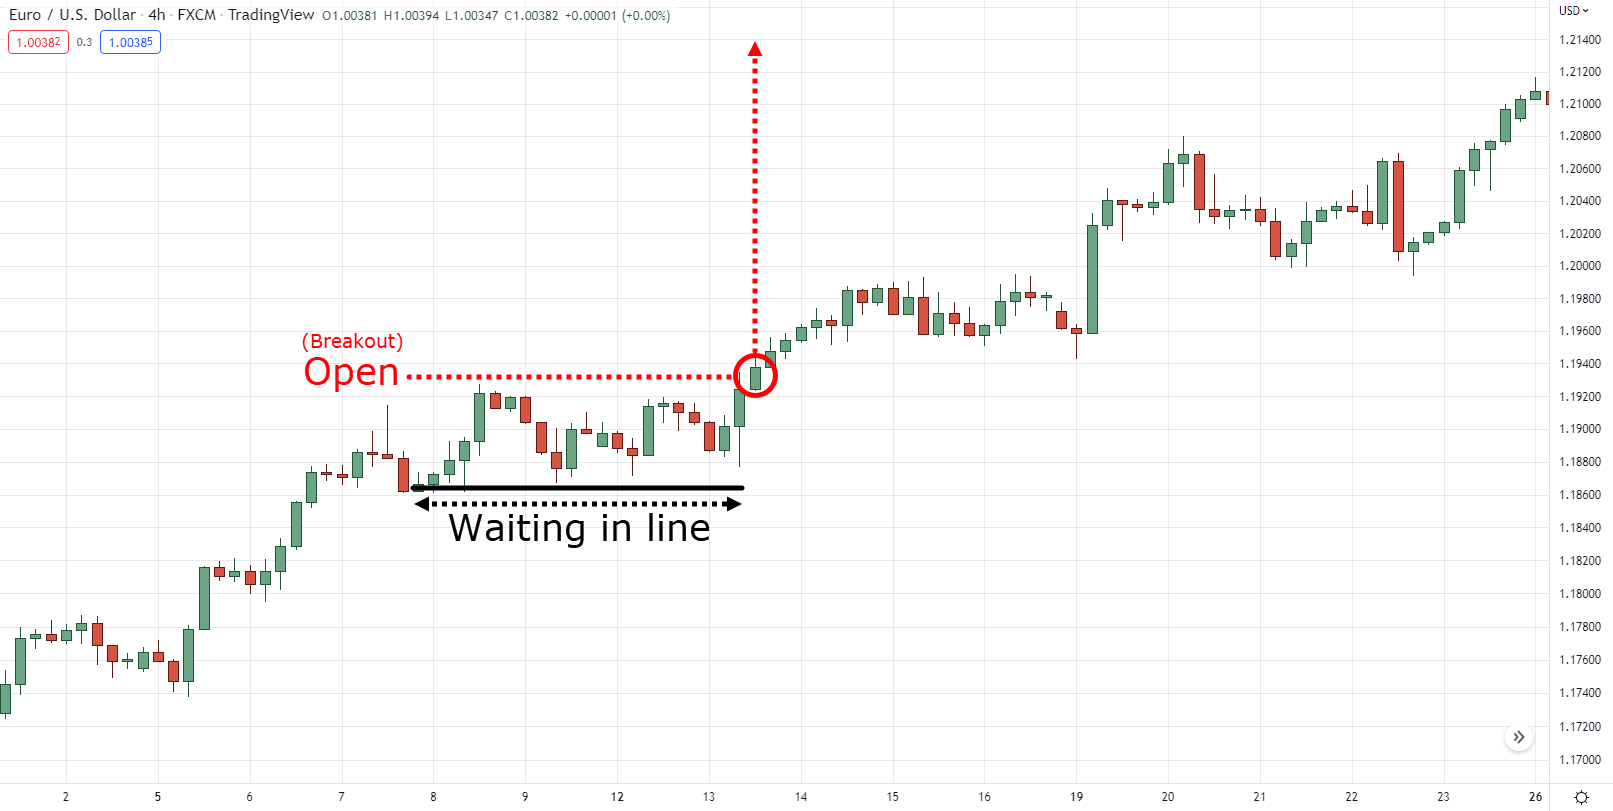
Do I wait for a candle close or do I place a limit/stop order?
After using these concepts for so many years, here’s what I suggest:
Wait for a candle close.
You see when dealing with breakouts…
There’s no doubt that false breakouts happen from time to time!
And it looks something like this:

So, waiting for a candle close won’t eliminate it, but it sure does help you avoid most of it!
Nonetheless…
If you want more techniques on how to avoid false breakouts, then I suggest you watch this training after you’re done here:
Still with me?
Then let’s get started.
1. Trend continuation breakouts
As long as you’re in a valid trend.
You’ll find an abundance of entry setups!
So, how do we exactly enter a trade with a trend continuation breakout?
Easy, simply wait for the candle to close above the pullback:

Then enter at the next candle open:

Next.
2. Trend line breakouts
Trend line breakouts can be a bit tricky.
Because if you recall, you must take trend line breakouts when it makes a large-bodied candle breakout.
It means that your trend line breakout must look like this:

And not this:

So again, once you have a large-bodied candle breakout, simply enter at the next candle open!

Last but not least…
3. Volatility breakouts
Remember the last example I showed you?

I’m sure you might be wondering:
“Why are there two entry areas?”
“Does that mean I will enter the trade twice?”
No, my friend.
It simply means that we don’t know which direction the volatility will expand into!
That’s why we would need to wait and see.
So, if the volatility manages to expand to the upside and it makes a large-bodied candle close from its highs:


Then you simply enter your trade at the next candle open:

An interesting setup, am I right?
Now…
There’s no point in learning how to enter your trades without knowing when to exit them, right?
So, in this last section…
I will dedicate my time to equipping you with tools that will help you manage your rewards.
So, let’s move on.
Trading breakouts: How to exit your trades and take profits
Today, you’ve learned three trading concepts so far:
- Trend continuation breakouts
- Trend line breakouts
- Volatility breakouts
So, to complete all of these setups to add to your trading arsenal…
I will teach you how exactly you can exit your trades so that not only you can apply it to these setups, but other setups outside of this guide as well.
Because after all, trading breakouts is different from just entering breakouts.
Does that sound like a good deal?
Great.
So here are two ways how you can exit your trades for a profit.
Trailing stop loss
Having a trailing stop loss simply means that you let the market dictate when you should exit your trade.
So, if the trend goes on for a long time, do your profits.
Now, how do you trail your stop loss?
The simplest way to do it is by using a moving average and waiting for the price to close beyond it before you exit your trade.
Here’s an example of a trend continuation breakout setup:

And a trend line breakout setup:

Now tell me…
What do you notice in the two examples I gave you?
That’s right!
The moving average period is different!
Because if you’re going to ask now…
What’s the best moving average period for trailing stop loss?
The answer is that it depends on the type of moves you want to capture (no not dance moves).
So, if you want to capture…
- Short-term moves: Use 10-20 period moving average
- Medium-term moves: Use the 50-100 period moving average
- Long-term moves: Use 100-200 period moving average
Makes sense?
So, if you want to capture medium-term moves after entering a breakout for example…
Then feel free to use a 69-period moving average!
Got it?
Now here’s the thing…
I highly recommend only using trailing stop loss with the trend continuation and trend line breakout setups.
Mainly because both setups deal with trends.
How about the volatility breakout setup where you could be entering breakouts within ranges?
How should you take your profits then?
Fixed target profit
When it comes to taking fixed target profits…
Being able to identify support & resistance is important.
Why?
Because it tells you where potential buying or selling pressure is!
Let me give you an example…
Assuming you’re about to enter a buying position from a volatility breakout setup:

The first thing that you need to ask yourself is:
“Where could potential sellers come in?
So, what do you do?
You figure out where the nearest resistance is:

Now, what’s the point of plotting out the nearest resistance?
To determine where your take profit is of course:

As you can see…
You must set your take profits below the area of potential sellers (resistance).
Because there are times when the price just “sniffs” your target profit level and then reverses against you.
Sounds familiar, right?
And by the way…
If ever you’re not familiar with support & resistance yet, feel free to check out this training video later:
So, to wrap this guide up let’s have a quick recap, shall we?
Conclusion
I’m sure you’ve noticed…
Every single chapter in this training guide is connected to form a trading strategy that will allow you to trade different types of breakouts.
However…
While most of the charts you see are cherry-picked and winning trades…
You still need to do the work by testing it yourself first and making the necessary tweaks according to your needs.
Because in this trading business, there will always be losses along the way.
Makes sense?
Now here’s what I want to know:
How do you go about trading breakouts?
Do you currently trade some of these types of breakouts?
Let me know in the comments below!
This is master piece! Anytime the market seems confusing, just visit tradingwithrayner. You’ll find the answer extremely simplified. Gosh! I wish I saw this before entering the market. You Rayner are my GOAT!
Great to hear that Eddie, you’re welcome!
I LOVE THE WAY THE WRITER HAS MADE THE COMPLICATED THINGS SO EASY.
KEEP SHARING YOUR KNOWLEDGE .
GOD WILL BLESS YOU FOR SURE FOR HELPING POOR TRADERS LIKE ME WHO CAN’T AFFORD COURSES.
Thank you for the kind words Anoop!
Thank you brother for your efforts and time and sharing knowledge
You’re welcome, Kk!
That’s very cool of you
Thank you, Jaybee!
Breakouts continues
Thanks for sharing, Reddy!
I just the simplicity with which complicated things are taught here , easy to understand. Thank you very much
Thanks, Linus! glad you found the explanation easy to understand.
Cheers!
Thanks, Linus! glad you found the explanation easy to understand.
Cheers!