
This post is written by Jet Toyco, a trader and trading coach.
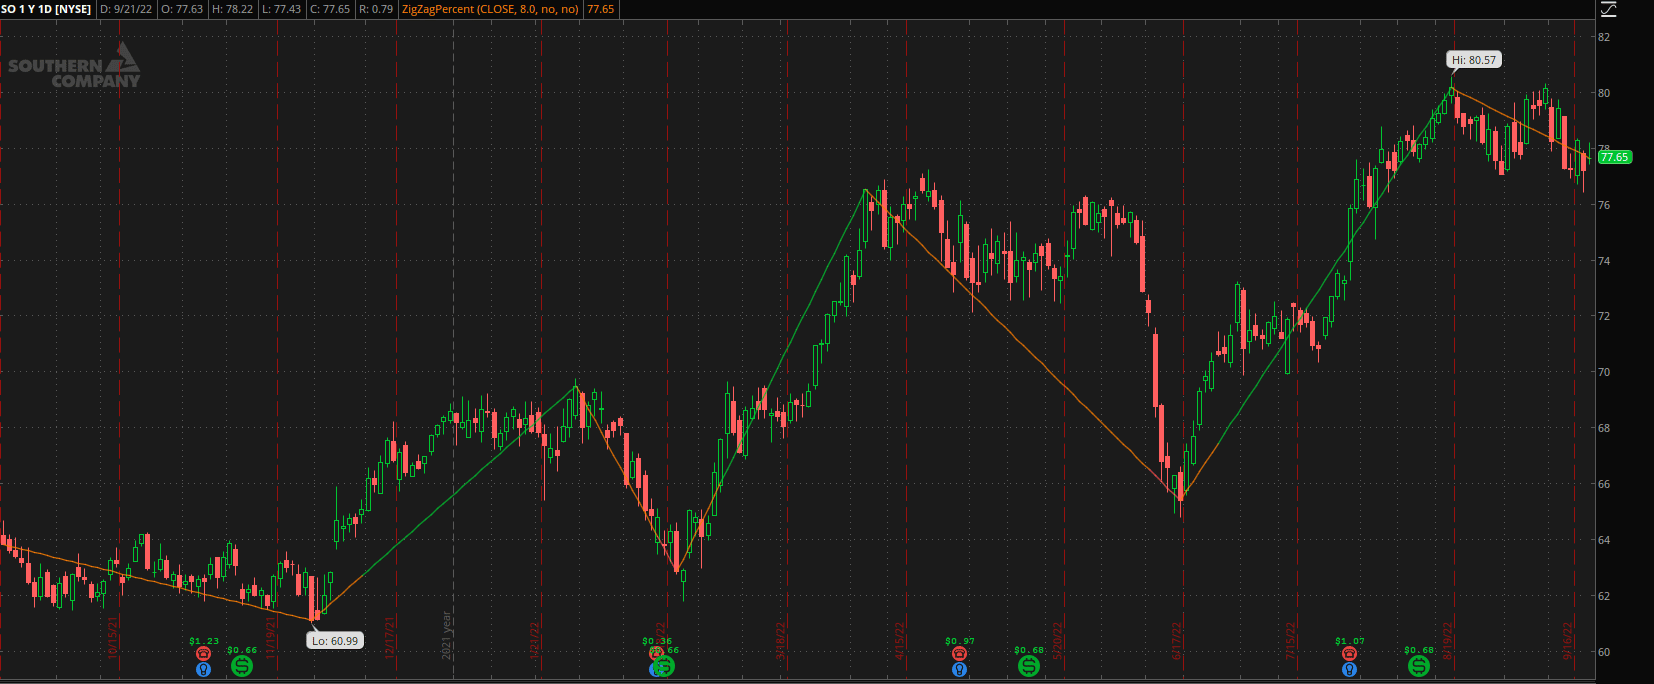
Take a look at this chart:
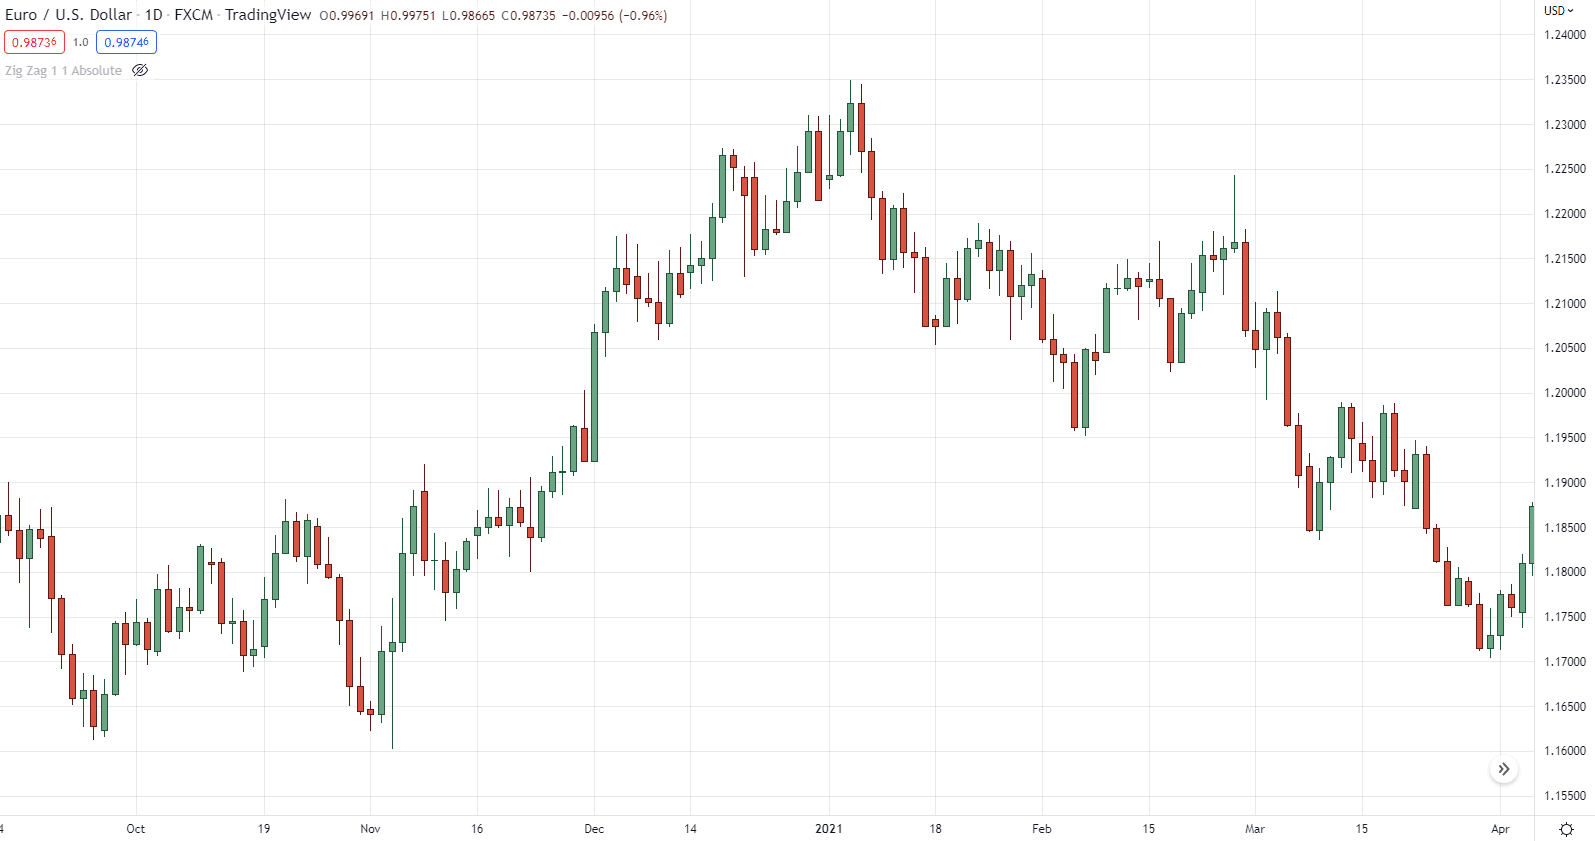
Let me ask you…
Where are the swing highs and lows?
Is it a valid downtrend? Or uptrend?
Now…
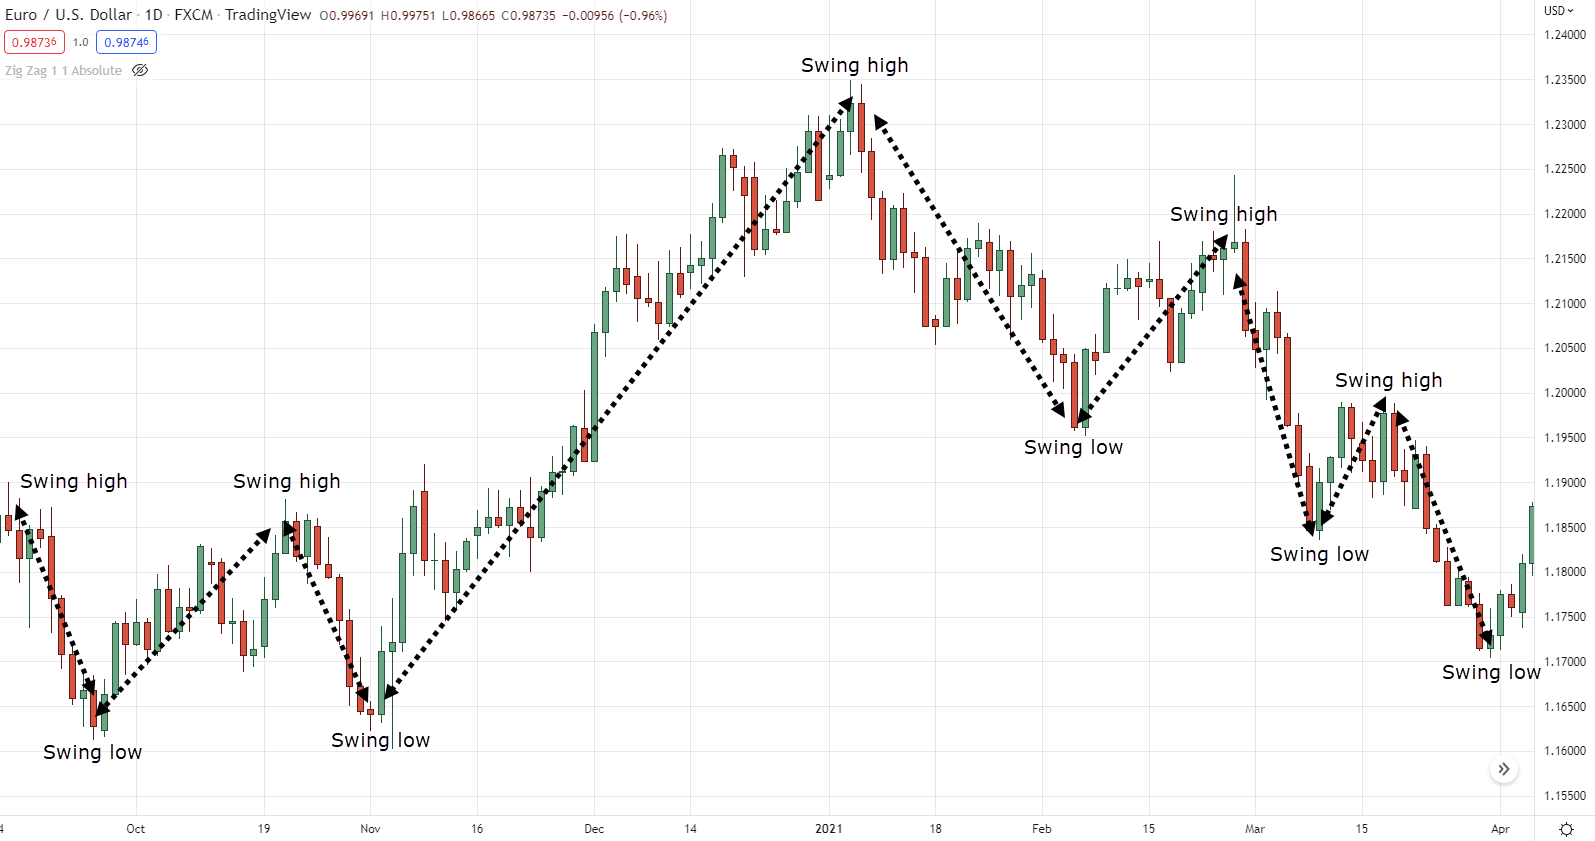
There’s a high chance that you could’ve plotted the highs and lows like this:
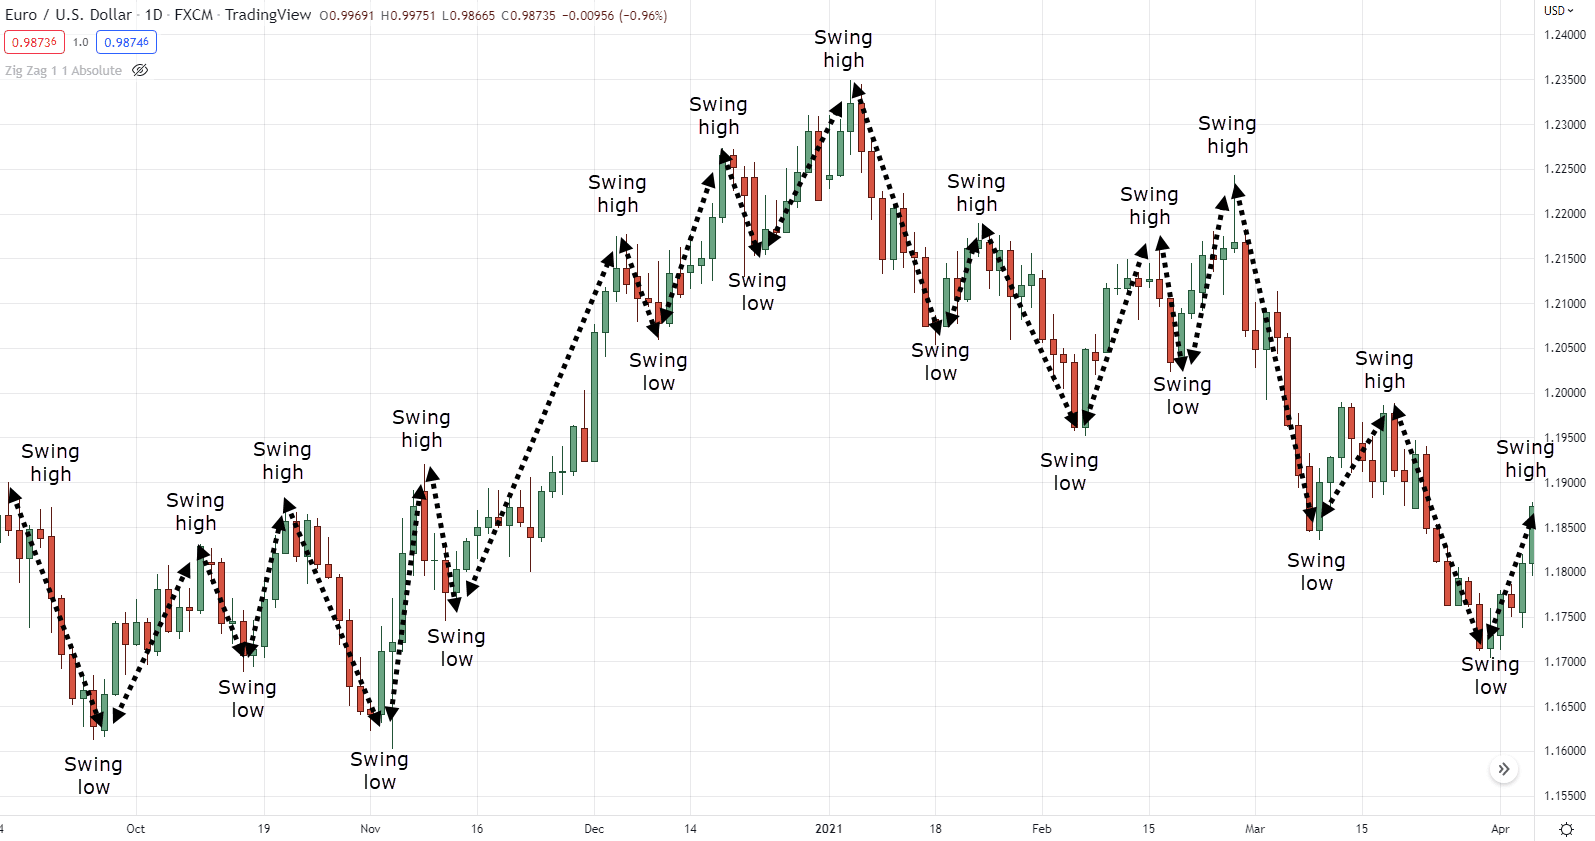
There’s also a chance that you could’ve plotted it like this:
or like this:
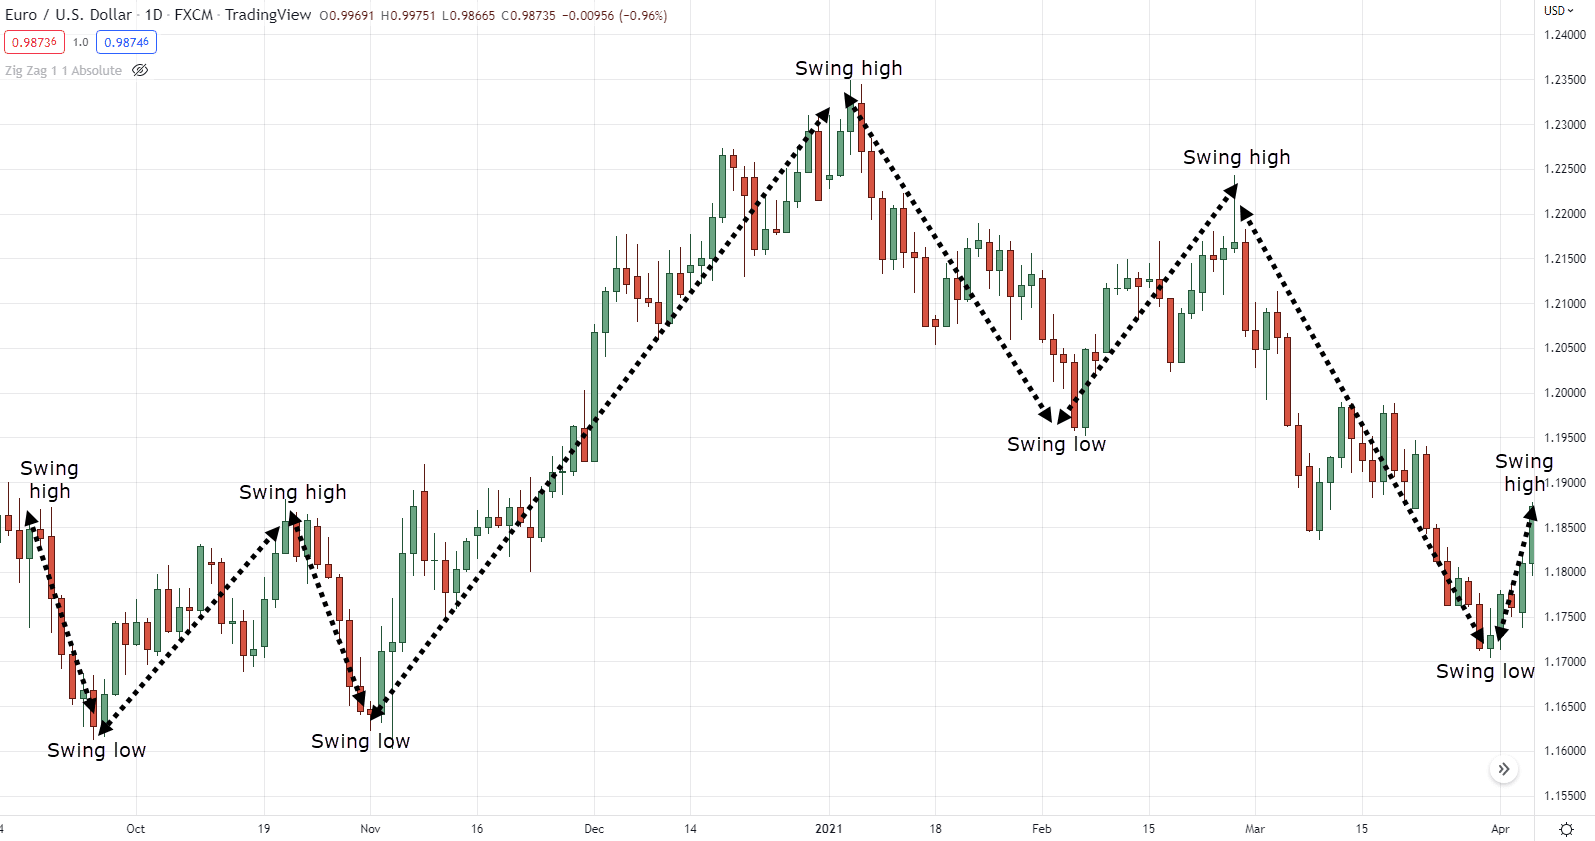
So, out of all the variations that I showed you…
Which one is right?
Which should you follow?
You see…
When markets get erratic and charts get harder to read, there’s a chance your trades could be subjective.
So, what’s the solution?
Let me introduce you…
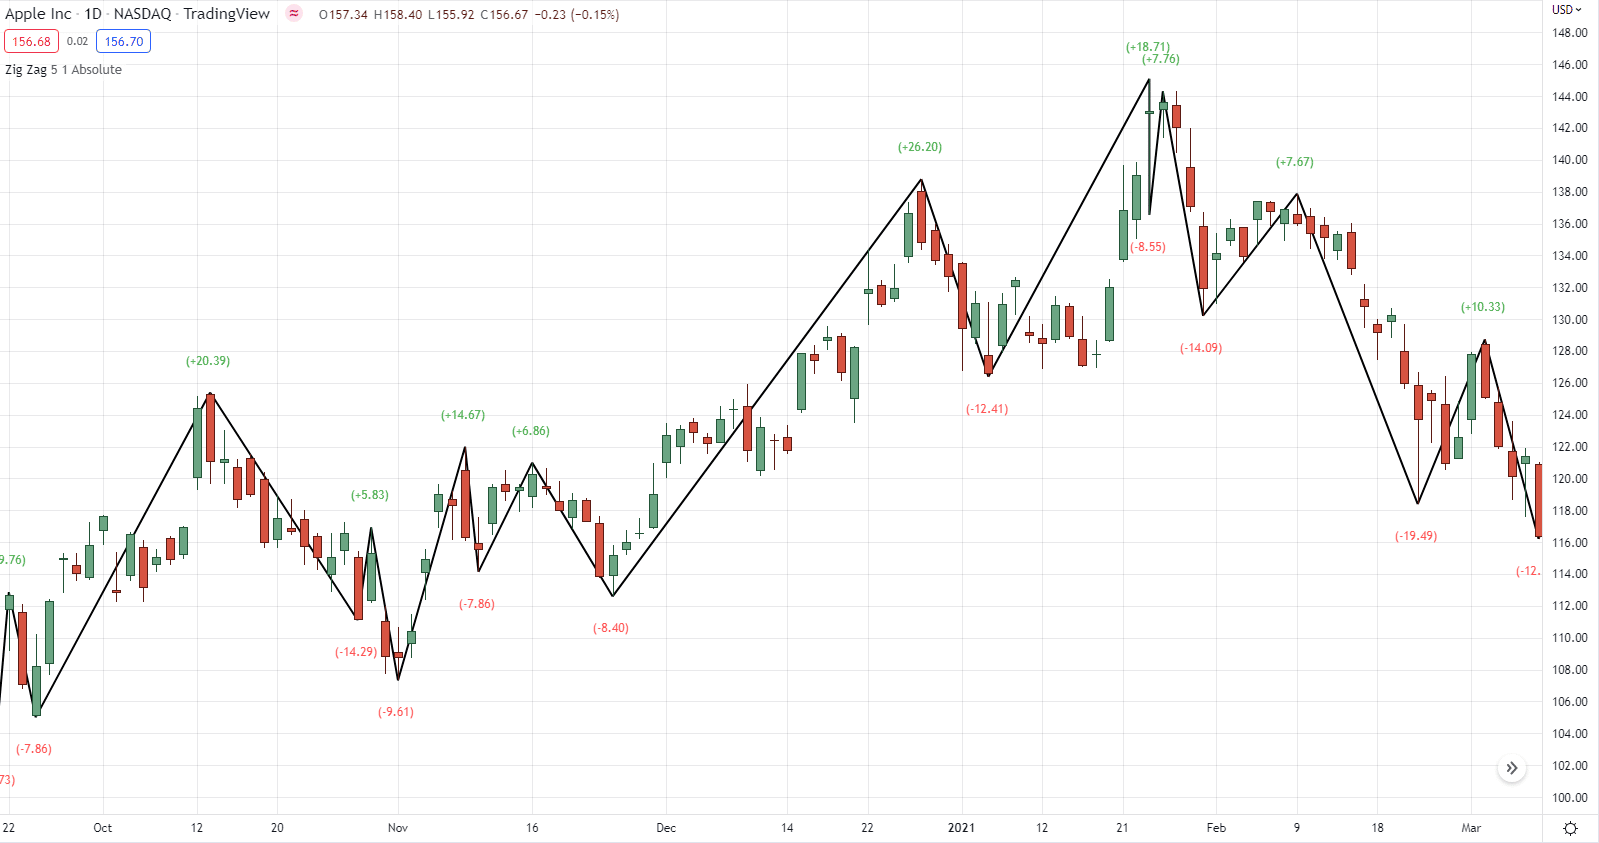
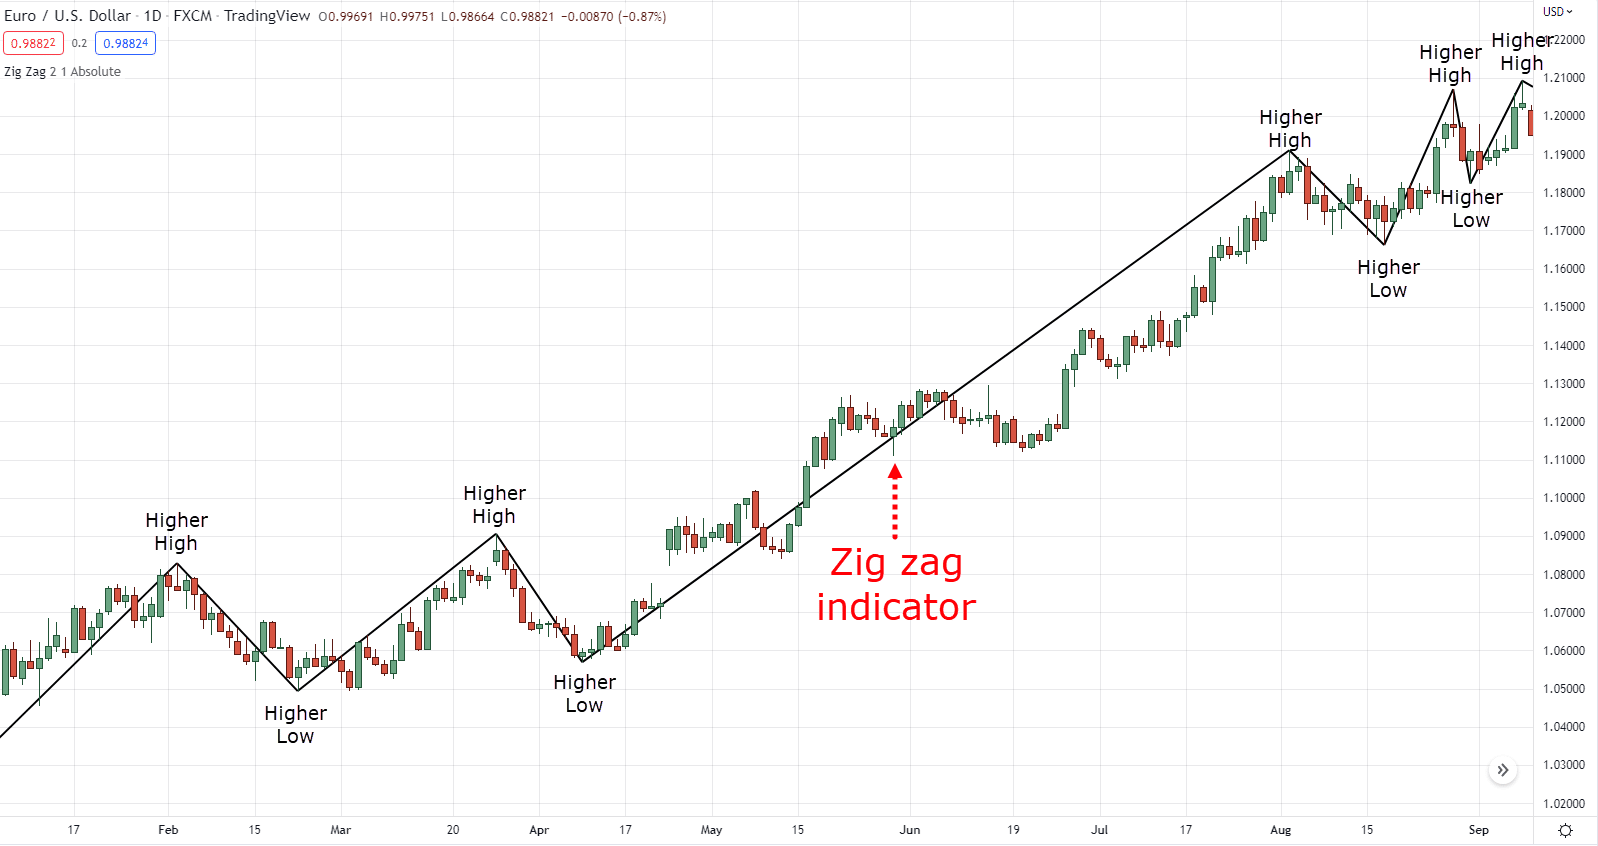
The zig zag indicator:
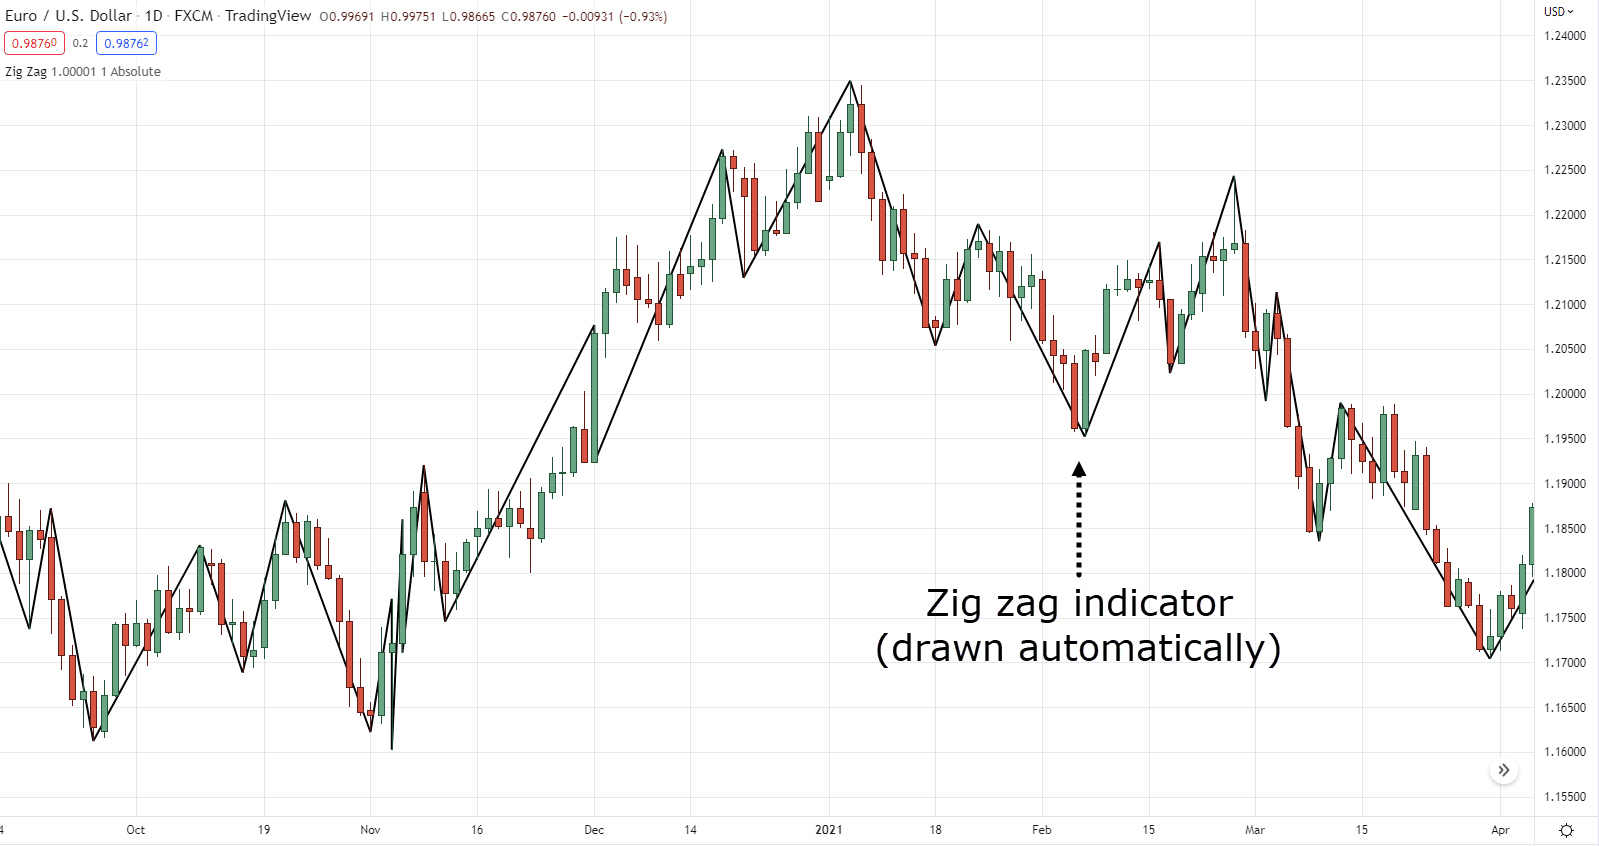
Pretty cool, right?
It brings order to chaos!
It brings objectivity to subjectivity so every trader sees the same thing when using this indicator!
And the zig zag indicator my friend, is what I’m going to share with you more about today.
Are you ready?
Then let’s get started…
What is the zig zag indicator and how does it work
I know this sounds surprising to you.
But the zig zag indicator is as accessible as the moving average.
You can find it on many different platforms!
Let me prove it to you:
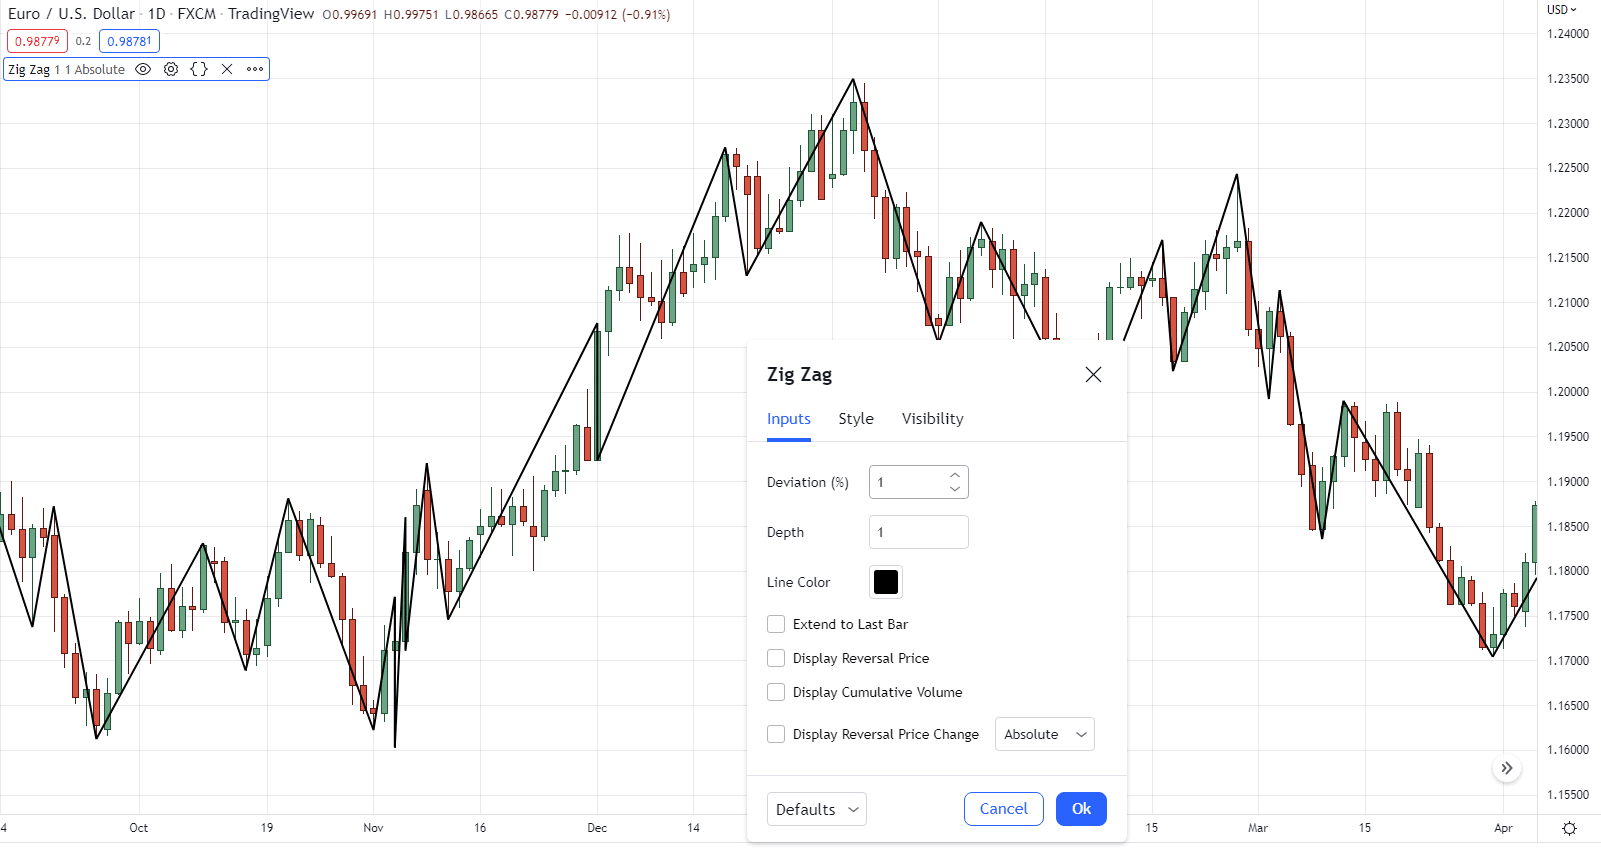
TradingView
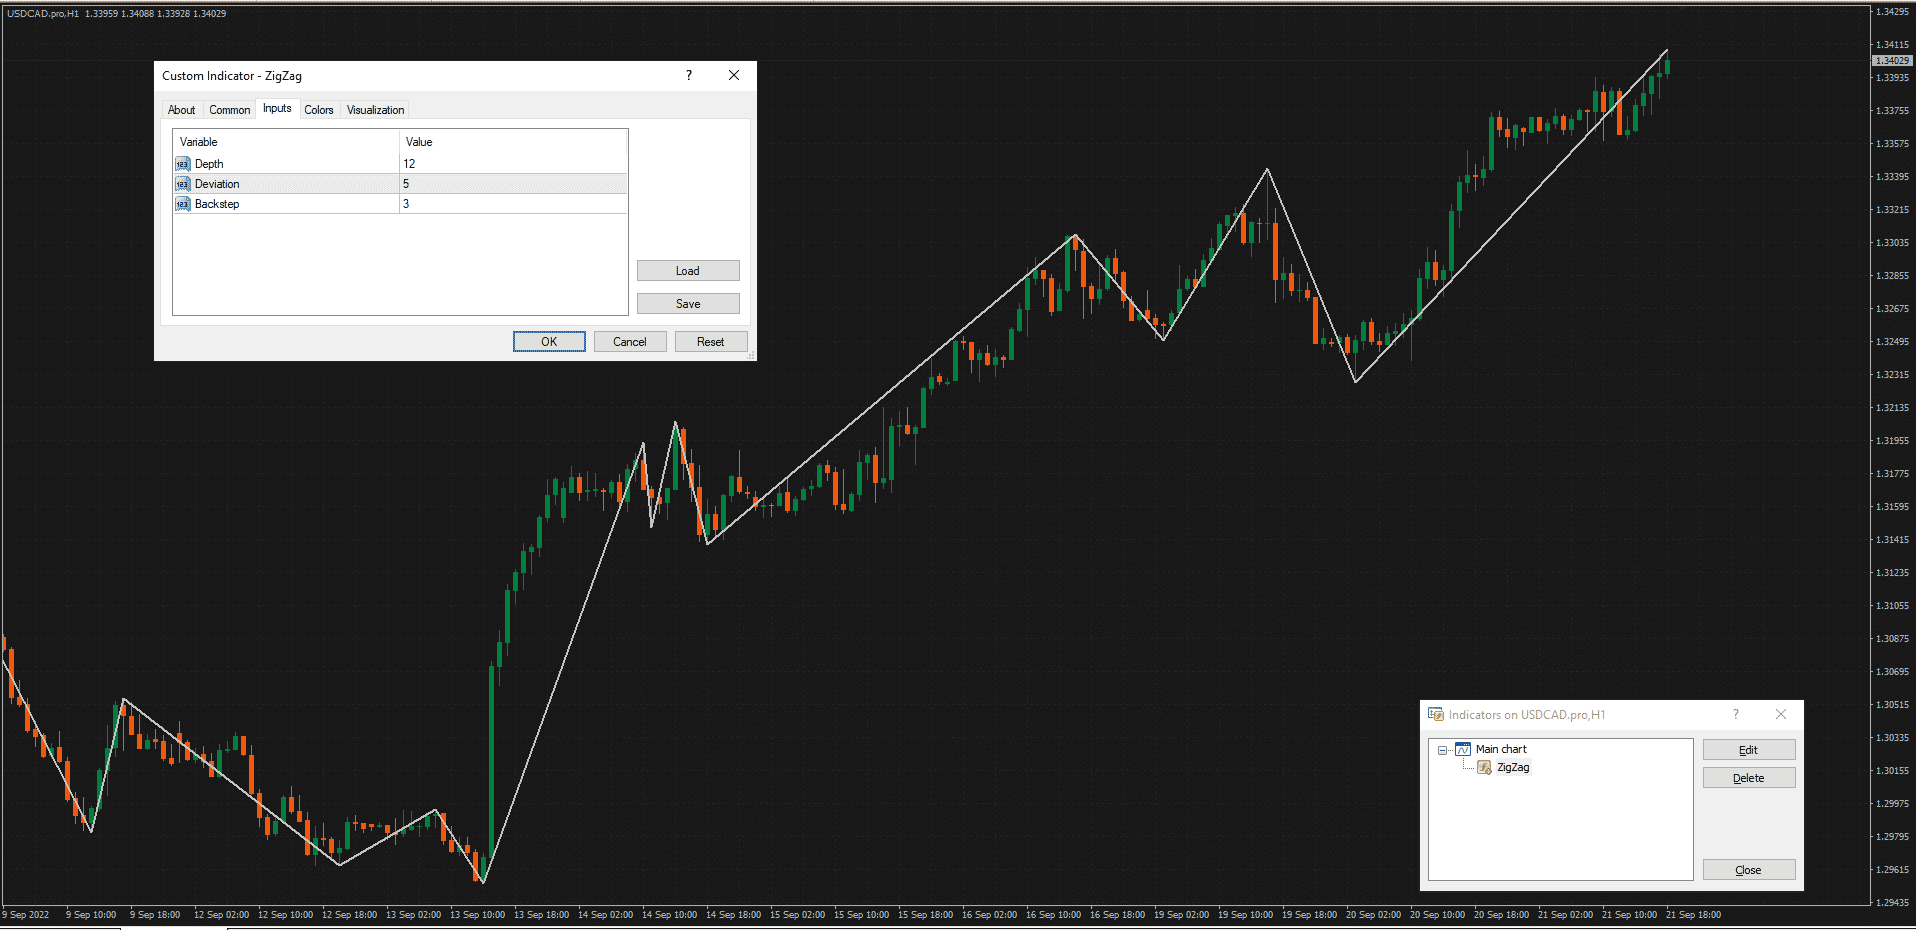
MetaTrader 4
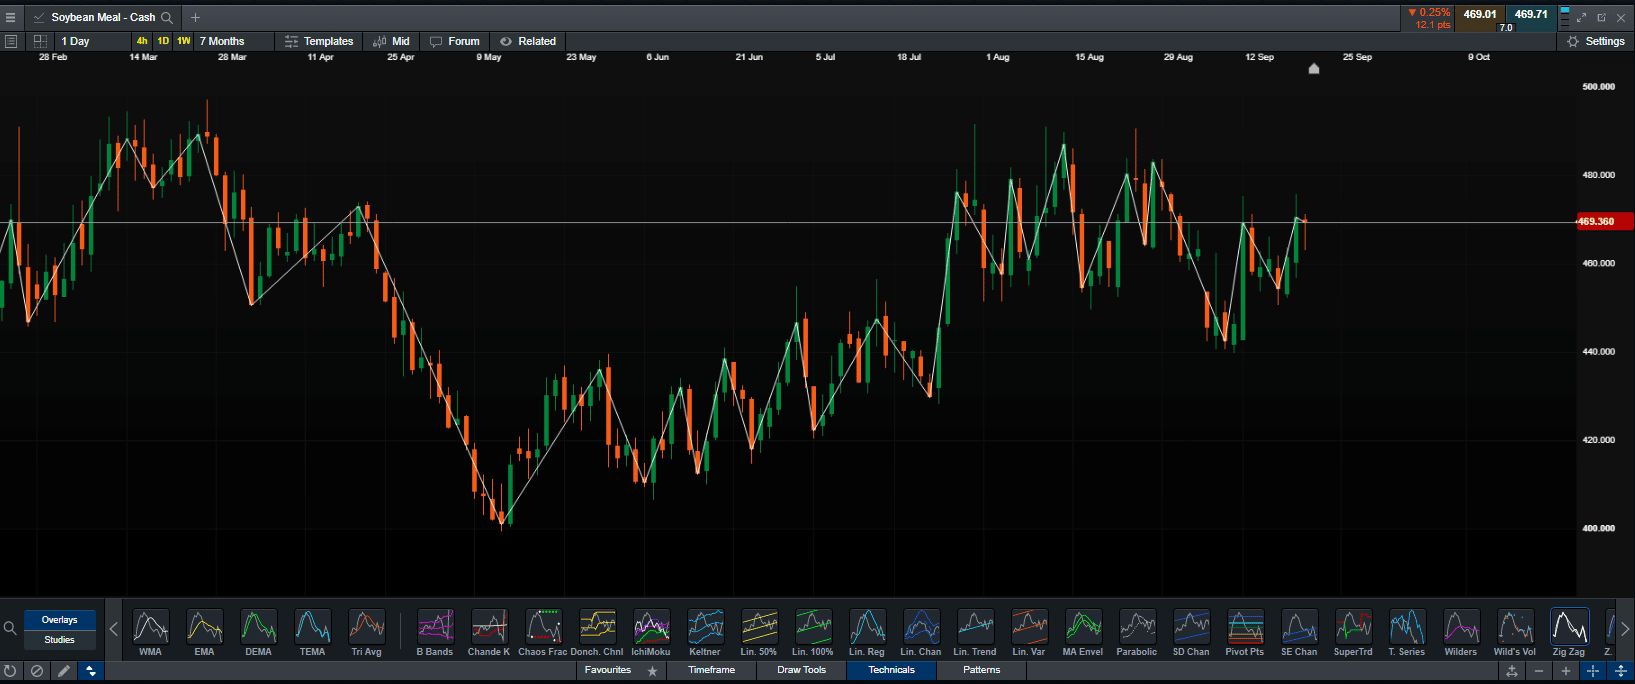
CMC Markets
Thinkorswim
So, how exactly does it work?
I mean…
HOW does it actually produce those lines?
When do those lines reverse exactly?
Here’s how…
Imagine that you’re in a car.
You’re lost and you’re wondering how to reach the nearest hotel.
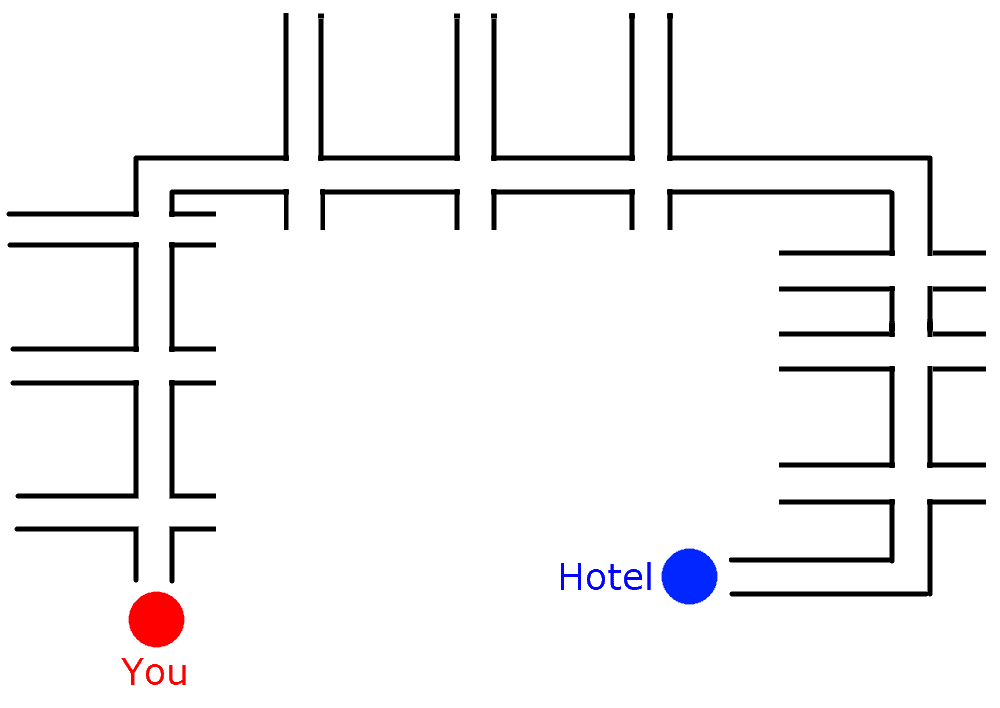
So you call me:
“Hey man, I’m lost, any directions to the nearest cozy hotel?”
Then I give you this specific instruction:
“Turn right after three road intersections.”
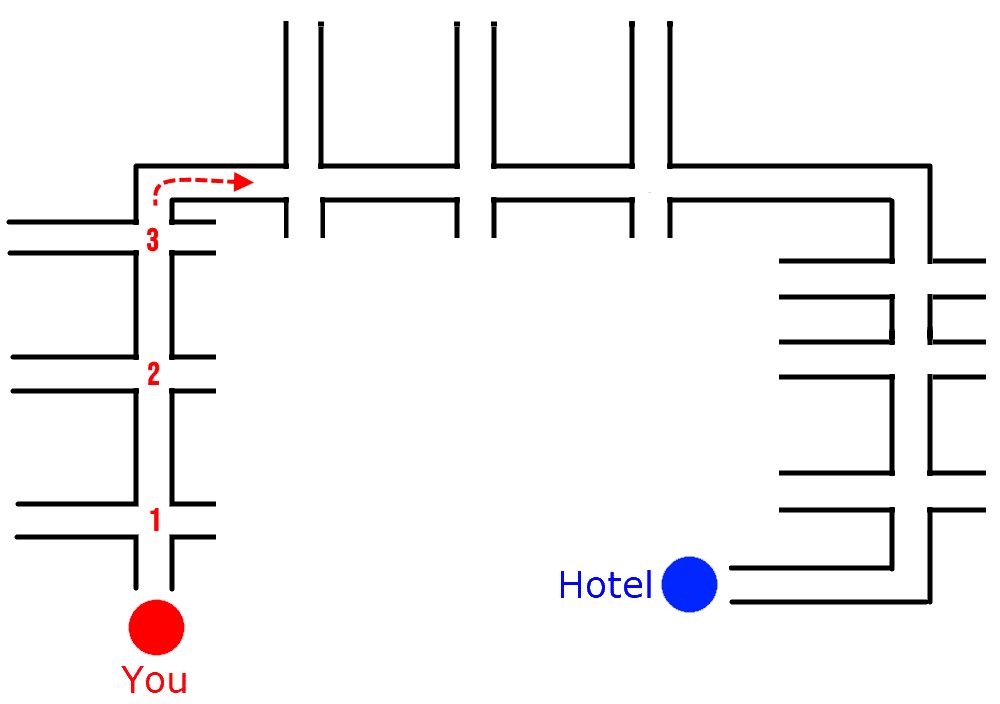
“And repeat until you reach your destination”
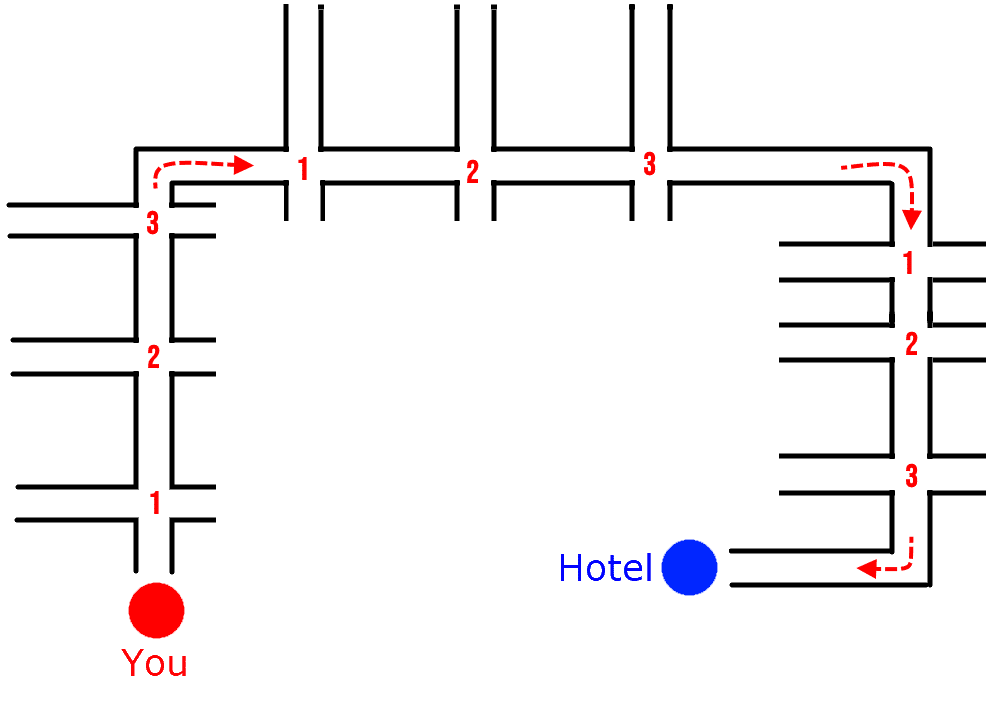
And it’s the same for the zig zag indicator!
If you give the zig zag indicator a specific instruction for example:
“Draw a line whenever the price makes a 5% advance or decline alternatively”
It would look something like this:
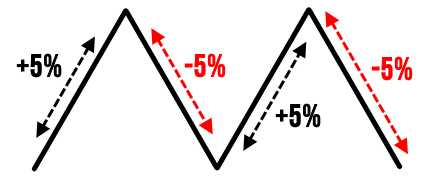
To break things down even further…
If the price makes a 5% advance or decline, then that’s the only time the indicator would visualize a line:
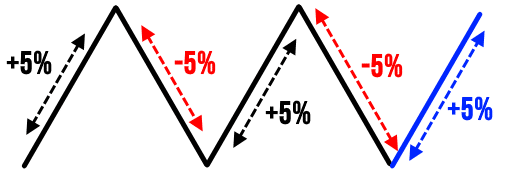
However, if it continues to advance further, the line will also extend:
Until it makes a 5% decline:
Now, these are just sketches.
So here’s how it looks like on a real chart (with the same 5% settings):
Again, the indicator will draw an opposite line only if the price moves at least 5% the other way.
Sounds pretty simple, right?
But of course…
Take note that you are free to change those values.
And that different types of zig zag indicators use “points” instead of percentages.
Makes sense?
So with that said…
Let’s dive deeper into the rabbit hole and see who this indicator is for and how will it help you improve your trading.
How the zig zag indicator helps you analyze charts and better time your exits
Whether you’re learning how to be a price action trader or an Elliot Wave trader, the zig zag indicator is an essential tool.
Because the zig zag indicator solves a major problem most traders have when they are starting:
Identifying market structure
As you know, there are four types of market structure:
- Higher highs
- Higher lows
- Lower lows
- Lower highs
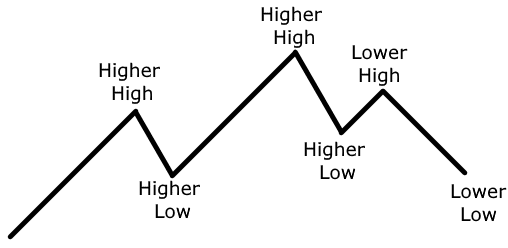
Of course, it makes perfect sense on the schematic because they look like lines.
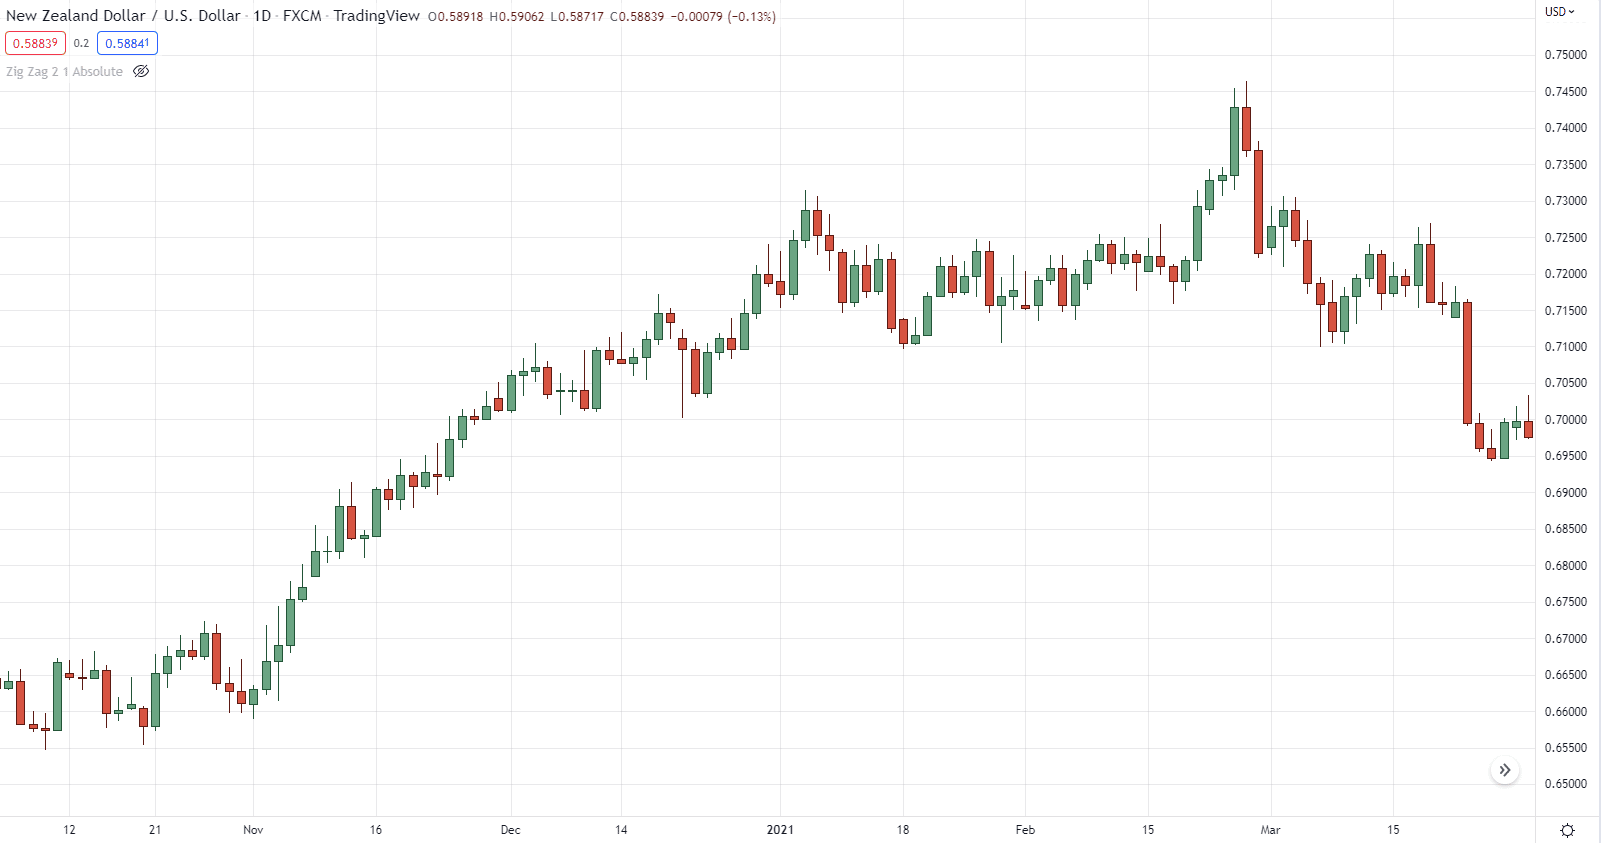
But in the real world, it’s not as simple as it seems:
So, using the zig zag indicator, helps you objectively define these market structures with ease.
And it doesn’t even take you more than 10 seconds to identify!
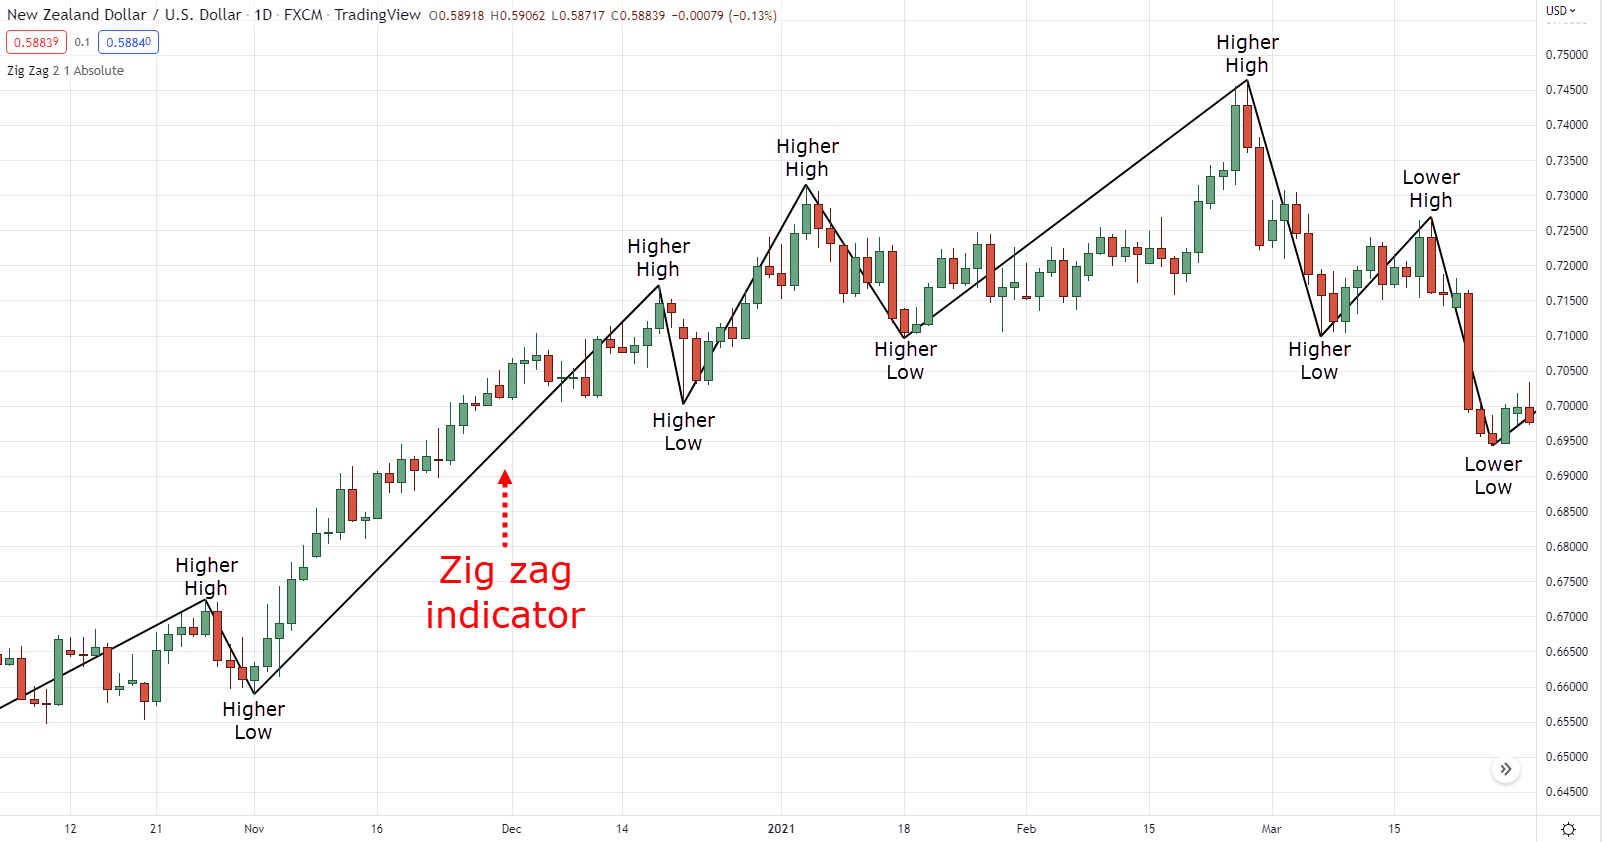
Pretty awesome, right?
Once market structures are crystal clear on your chart, identifying trends and ranges is easy peasy!
Such as an uptrend containing higher highs and higher lows:
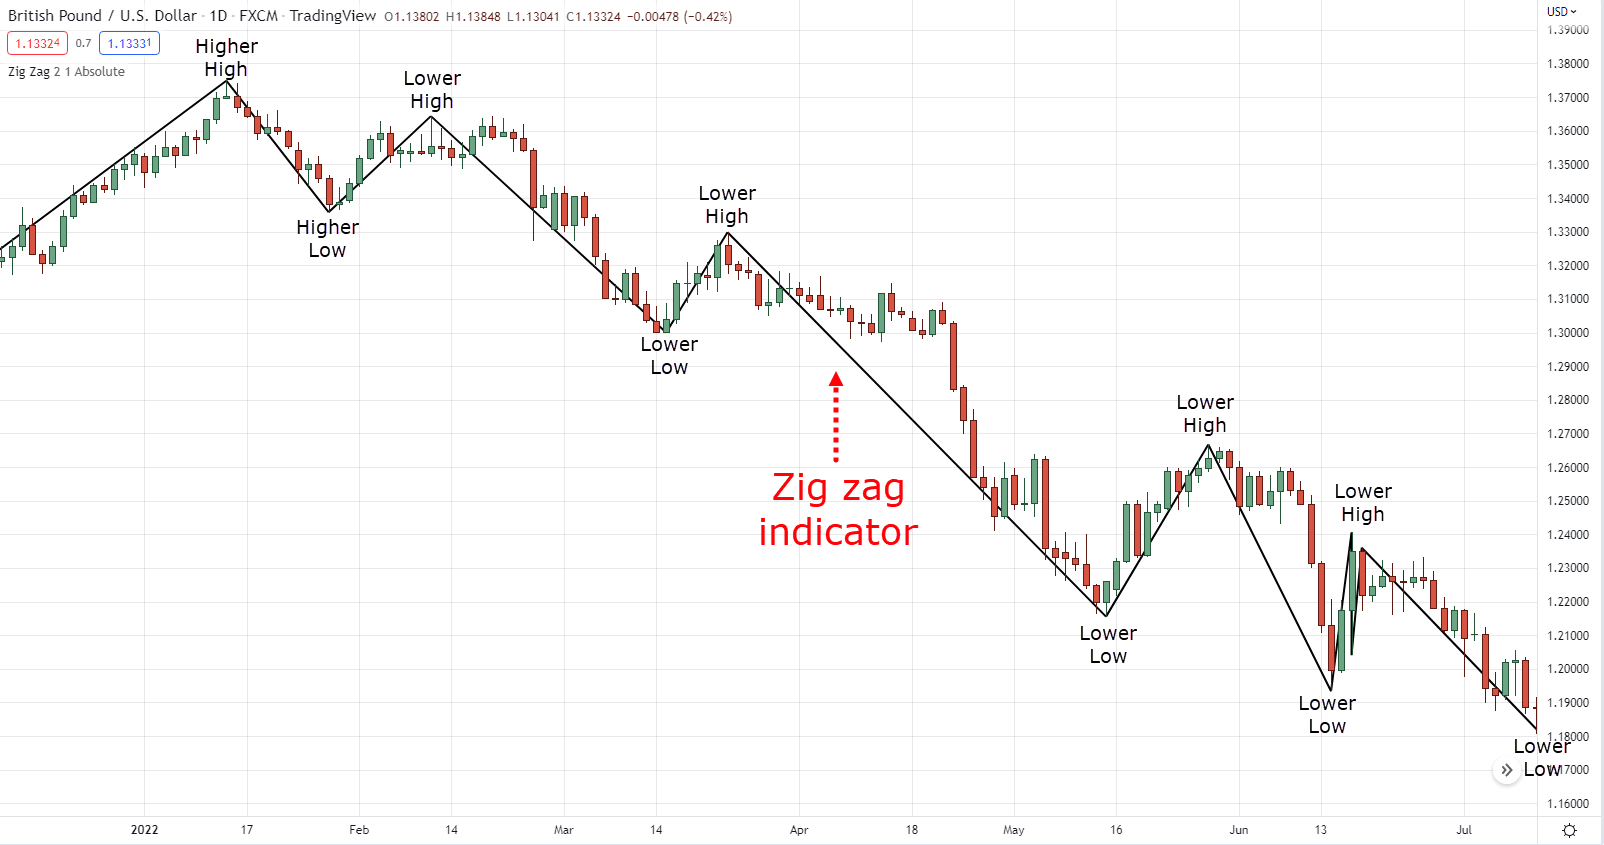
A downtrend containing lower highs and lower lows:
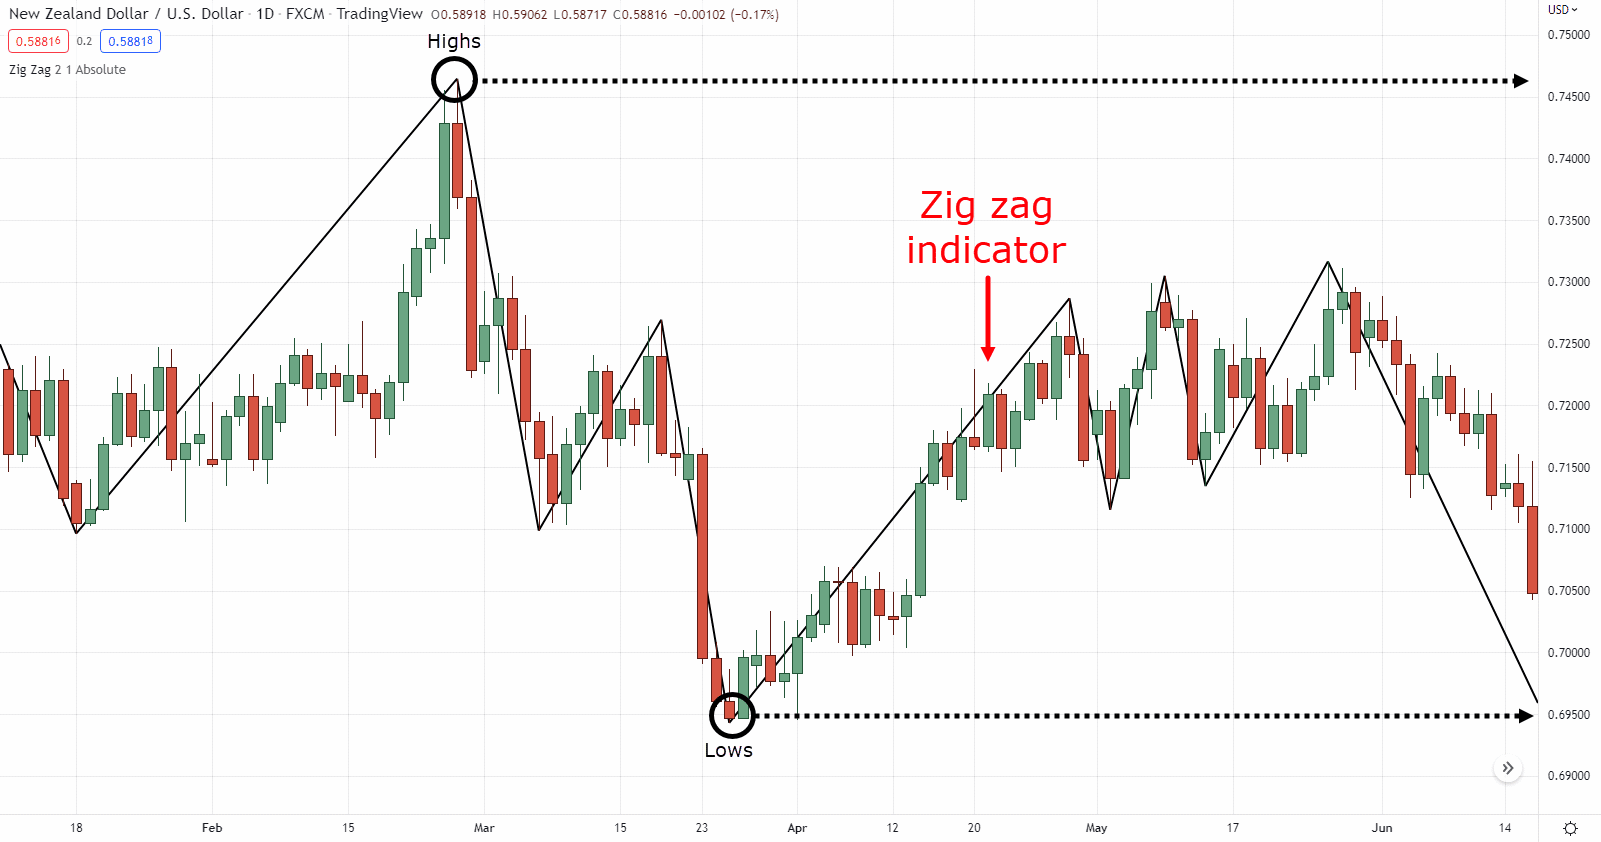
And a range where the market structure is contained within the highs and lows:
With the zig zag indicator, you’ll rarely second-guess your analysis, and it removes the subjectivity to it.
Here’s the best part…
This is not the only thing the zig zag indicator solves.
Identifying take profit and stop loss levels
What good is an indicator if it doesn’t help us trade the markets, right?
Also, what good are your trades if you don’t have a plan on when to exit them?
Because not only the zig zag indicator helps us analyze the market…
But also helps us trade by knowing when to exit.
So here’s the concept…
Take profit
When you want to take profits, you want to make sure that you exit before the opposing pressure kicks in.
Let’s say you are in a long setup:
Let me ask you.
Where do you think potential selling pressure could come from?
At the nearest swing high identified by the zig zag indicator, of course!
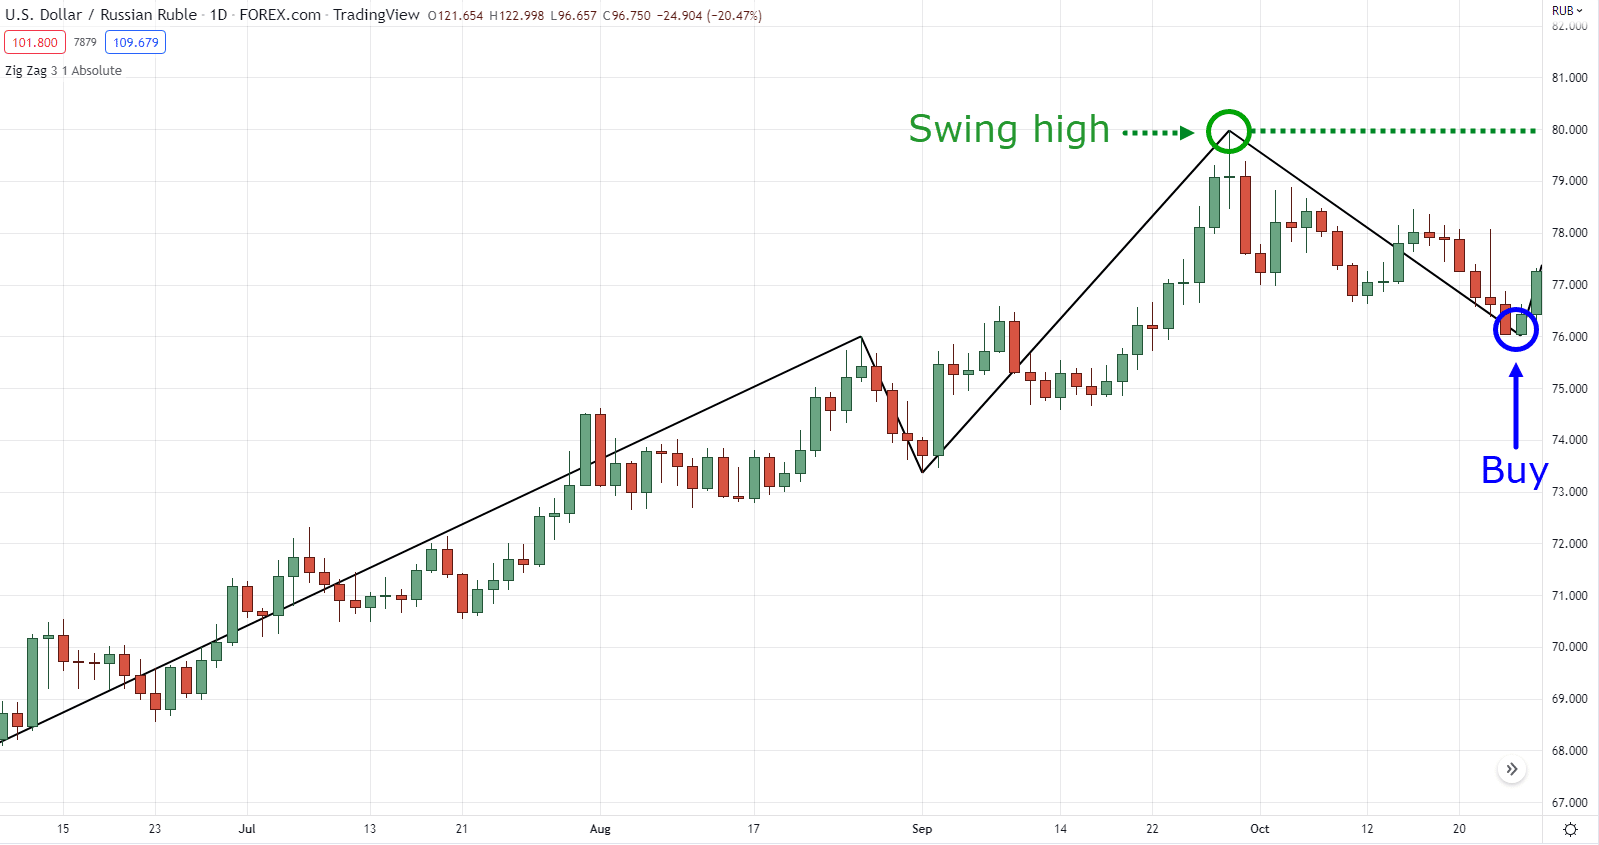
So, if you want to exit your trade at a reasonable and technical level with the help of the zig zag indicator, then you want to place your take profits below that swing high.
Makes sense?
Stop loss
I know, it sucks taking a loss and you’ll start “blaming” our stop loss for the loss.
However…
It’s worse when you’re in denial about holding a trade.
Especially when you know that it’s no longer valid or has ballooned into a bigger loss.
That’s where the zig zag indicator comes in, my friend.
How so?
Having the zig zag indicator in place, helps you identify when your market structure is invalidated.
So, if you enter a long breakout trade for example:

And you see that if the price breaches the higher low, your trade is invalidated:

So, you place a stop loss right below the swing low:

It is easier for you to accept that your trading idea is invalid and that you could potentially avoid account-killing losses:

Of course, there’s more to stop loss and having an edge in trading.
So I suggest you check these articles out:
The Complete Guide to Stop Loss Order
How to be a Profitable Trader Within the Next 180 Days
I know that I seem to be glorifying the zig zag indicator to the point that this is the “holy grail.”
In reality…
A zig zag indicator is still a trading tool at the end of the day.
It can be mishandled and used in the wrong way the same way it can help improve your trading.
So what are these mistakes you might ask?
Keep reading.
One mistake to avoid when using the zig zag indicator, do this instead
As I’ve said…
The zig zag indicator is still a simple trading tool that’s easy to understand.
But it’s not a magic indicator that brings in profits.
The zig zag indicator has its weaknesses as well.
Here’s what you shouldn’t do if you want to add the zig zag indicator into your trading arsenal…
Being too dependent on it
Here’s the zig zag indicator with a 10% deviation period on LULU:

Okay now here’s the same indicator with the same settings but on USDZAR:

Holy crap, they look different and they’re the same settings!
At the same time…
Here’s the zig zag indicator with a 10% deviation period on GOOGL on the daily timeframe:

And here’s what it looks like on the 1-hour timeframe on the same stock:

Man, what a headache!
And this is one of the main weaknesses of this indicator.
The settings may depend on which market and timeframe you trade.
Because if you recall…
The zig zag indicator ends by drawing a line when it crosses a certain percentage on your chart:

Since volatility depends on the specific market, what’s the solution?
There are two:
- Choose your entry timeframe
- Use the recommended settings
Let’s dive into this…
1. Choose your entry timeframe
Here’s the bottom line…
Only use the zig zag indicator on one timeframe.
Because the more consistent you are on which timeframe you trade on, the more effective the zig zag indicator would be for you.
So if you choose to trade on the 1-hour timeframe for example.
Hide the zig zag indicator when you are analyzing the higher timeframe.
Makes sense?
Next.
2. Use the recommended settings
Yes.
I will be giving you a “cheat sheet” on which indicator period to choose.
Assuming that the zig zag indicator you are using would be the percentage-based indicator.
However, the main principle behind the values would be this:
Choose a zig zag indicator period until you can see the “zig-zags” in the market.
Here’s what I mean:


Got it?
So, here are the recommended settings for the zig zag indicator for different markets assuming you are trading the daily timeframe:
- Stocks on D1 = Deviation (%) 8 to 10
- Futures on D1 = Deviation (%) 3 to 8
- Forex on the D1 = Deviation (%) 1 to 3
Makes sense?
Now at this point…
You’ve learned how the zig zag indicator can help you out in trading and also what not to do when using the indicator.
So how do we put everything in place?
What’s the step-by-step process on how you can use the zig zag indicator along with your strategy?
Well, stay tuned.
As that’s what we’re going to discuss next…
A simple zig zag indicator price action strategy that you can use in both bull and bear markets
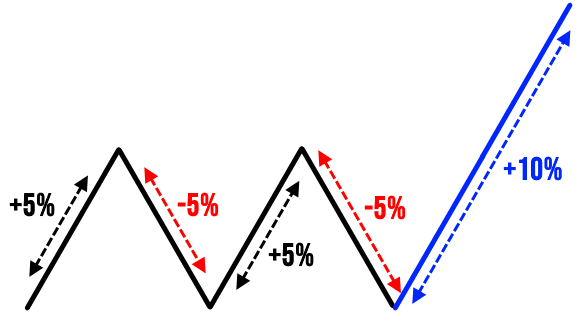
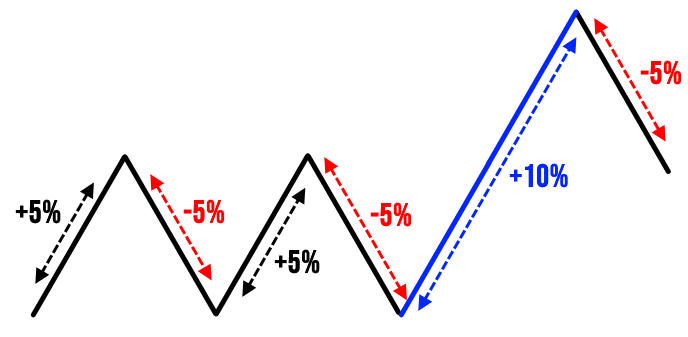
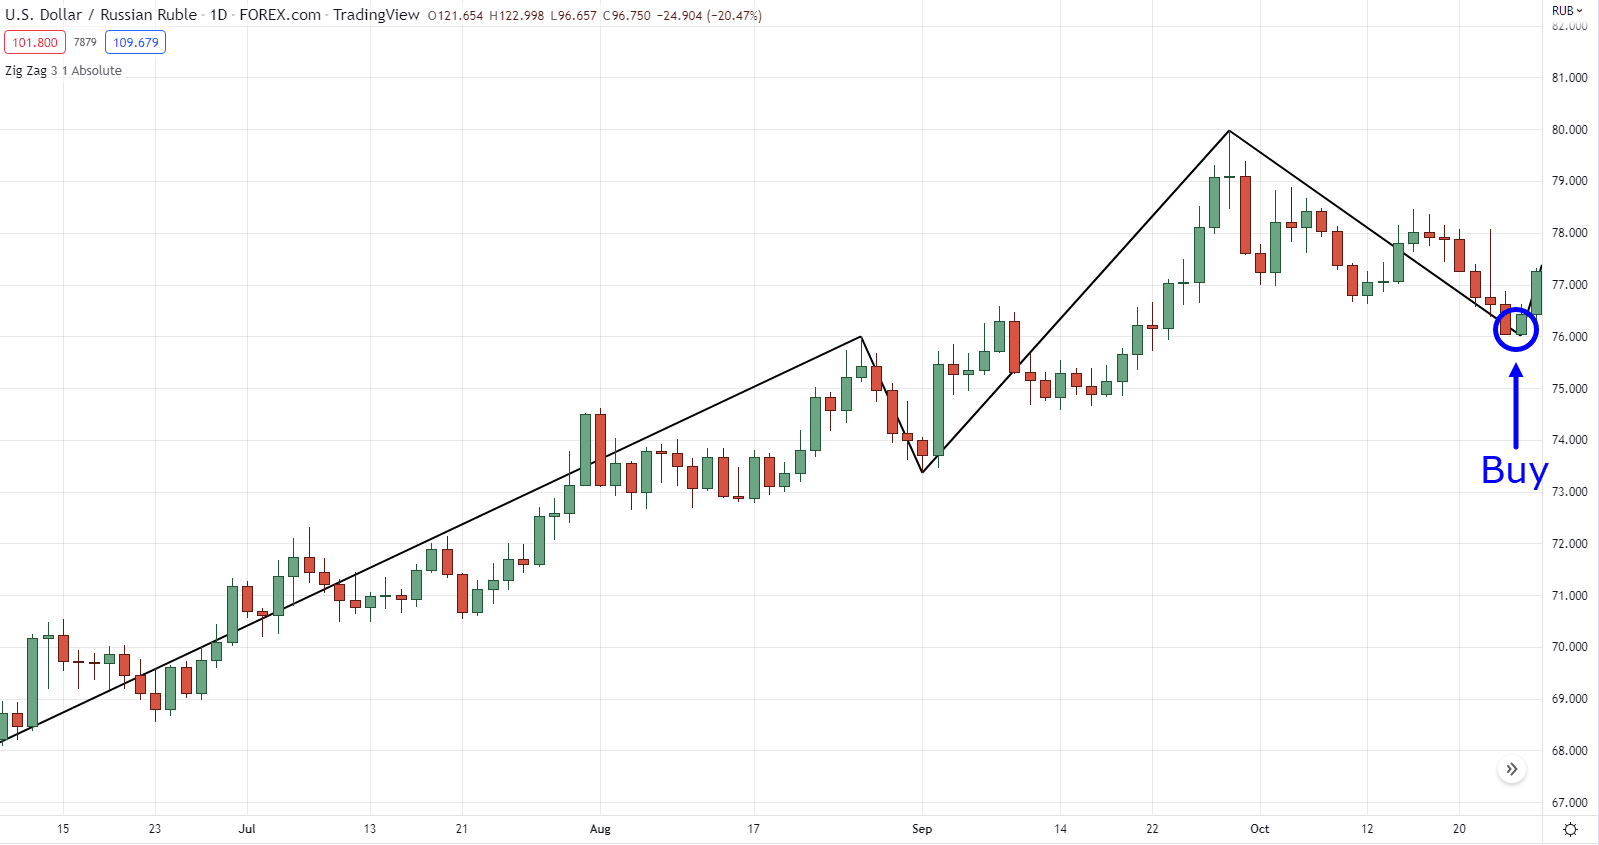
The zig zag indicator is often used as a trend reversal indicator.
So if you have a zig zag indicator that draws a new leg after a 10% drop…
It would indicate that the market is bound to bounce up anytime soon.
But what I’m about to show you is how you can use the zig zag indicator to compliment your method as a price action trader.
And a specific price action formula that we would use is the MAEE formula which stands for:
- Market structure
- Area of value
- Entry trigger
- Exits
So let’s have a deep dive on how the zig zag indicator works its magic with this formula, shall we?
Market structure
Quick reminder:
The MAEE formula is a step-by-step process on how you should approach your chart!
So, identifying the market structure is the very first thing you should look for.
Is the market in an uptrend?
Then look for buying opportunities.
Is the market in a downtrend?
Look for selling opportunities.
Is the market in a range?
Look to buy low and sell high or vice-versa.
So, in this example, what is the market condition?

With the help of the zig zag indicator, we can see that this forex pair is in an uptrend:

There you go!
So what’s next?
Area of value
Given that the market structure is in an uptrend, we will be looking for buying opportunities.
So, in this case, the area of value would be if the price retests the new area of support.

Pretty simple, right?
Entry trigger
Valid uptrend?
Check.
The price is currently at the area of value?
Check.
So, how do we enter this market?
Well, there are a ton of ways to do this.
But to keep things simple, a bullish rejection candle or candlestick pattern would do:

In this case, the price made a bullish engulfing pattern along the area of value, so what you can do is to enter at the next candle open.
Again…
Whether it’s a:
- Hammer
- Bullish engulfing
- Piercing
- Morning star candlestick pattern
It doesn’t matter.
As long as it is a bullish price rejection at the area of value, then it is a valid entry trigger.
Sounds good?
Finally, the easy part.
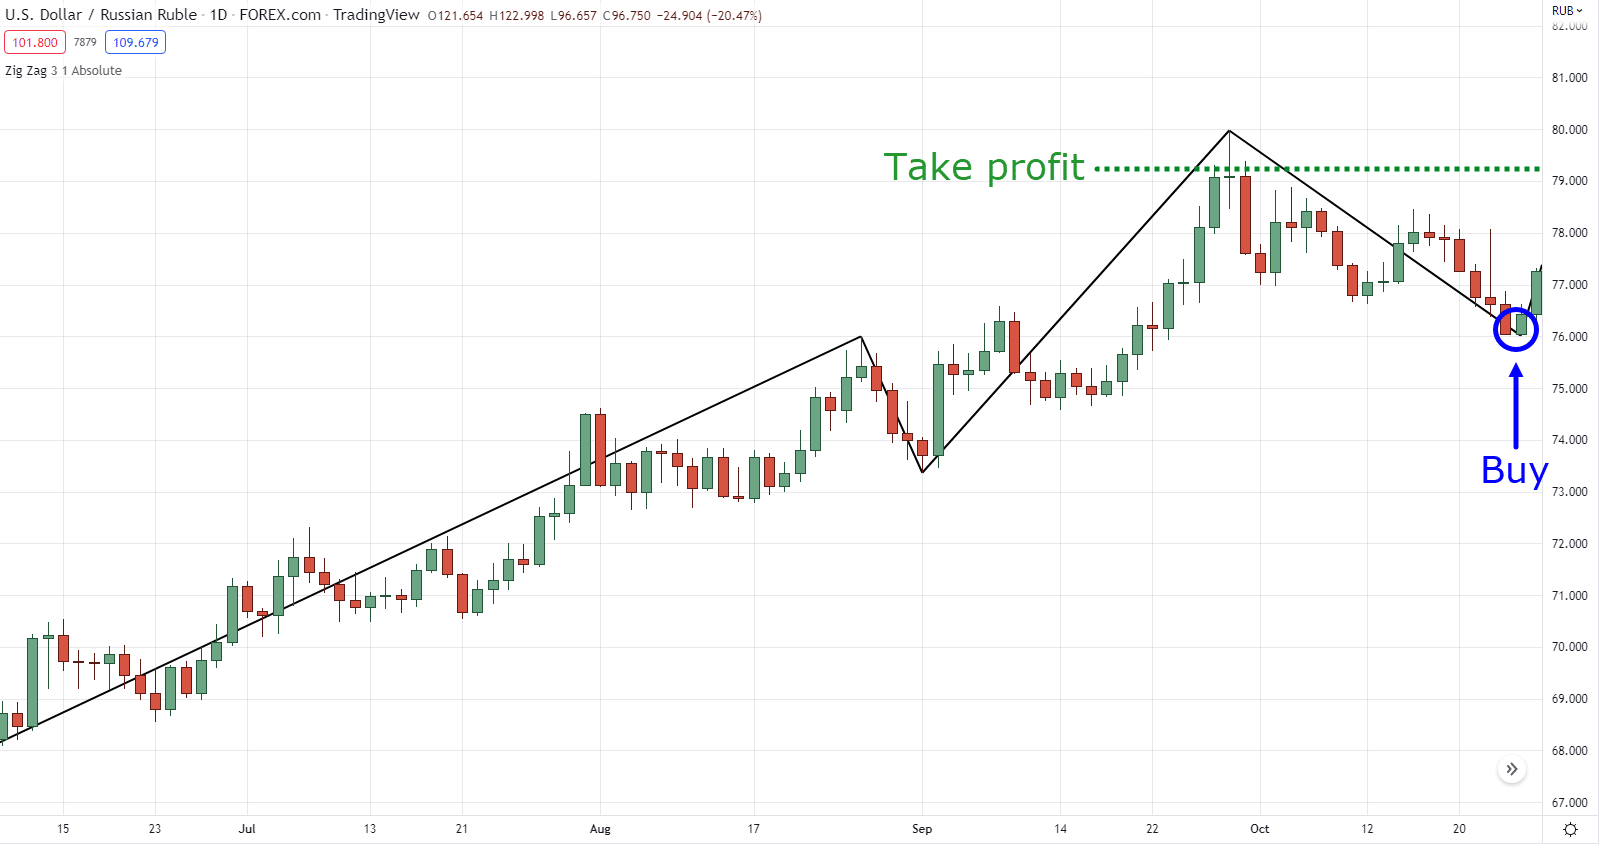
Exits
Why is this the easy part you may ask?
Because a while ago, I’ve taught you how the zig zag indicator can easily be a reference to your take profit and stop loss, remember?
So in this example, your stop loss would be below the swing low, and take profits before the nearest swing high:

The same concept applies whether you are trading downtrends and ranges as well.
The key is to always trade in the direction of the trend, or appropriate to the current market condition.
And there you go!
So before we end this ultimate guide to the zig zag indicator…
Let’s do a quick recap, shall we?
Conclusion
- The zig zag indicator is an accessible trading indicator that produces and visualizes swing highs and lows in the market
- The zig zag indicator is often used as a trend reversal indicator, however, it also benefits price action traders by almost instantly visualizing swing points in the market
- The setting of your zig zag indicator should depend on the market and the timeframe you are in
- You can use the MAEE formula along with the zig zag indicator to look for trading opportunities across different market conditions
So over to you…
Have you tried the zig zag indicator before?
Have you seen it on your platform but never tried it before?
If you’ve tried it already, how did it go?
Let me know in the comments below!
Thanks for clarity
You’re welcome, Ken!
i command to read it and take note its useful one
Let me know how it goes when you try to use it Abushadi!
Thank you Boss
You’re welcome, Onajite!
Thanks so much sir for your help god bless u
You’re welcome, Tenzing!
Sir which zigzag setting is suitable for 15 minutes timeframe
You can use the same settings in the article:
Stocks on D1 = Deviation (%) 8 to 10
Futures on D1 = Deviation (%) 3 to 8
Forex on the D1 = Deviation (%) 1 to 3
This can apply still on the lower timeframe
However, if the market structures are too “clamped” to determine, then feel free to modify the period until the swing highs and lows of the zig zag indicator is clear!
I thought using zigzag tool is effective but my problem is, i never see this tool on my flatform. Also if there is a zigzag tool on my flatform, would i be able to set it up.
Hey there Alexander, the Zigzag tool is a built-in tool or MT4, MT5, as well as in TradingView
But let me know which platform you are using!
Hello thanks for this brilliant breakdown. I was wondering if I was to fix up the zigzag indicator on my 15M on USD/GBP
Hey there!
Jarin here from TradingwithRayner Support Team.
there’s no fixed ZigZag setting for 15M on USD/GBP, so it’s best used as a visual guide. you can start with the default settings and gently adjust them until the swings look clear and meaningful for your timeframe.
I hope this helps!