This post is written by Jet Toyco, a trader and trading coach.
Here’s the truth:
Parabolic stock trading is a “fool’s trap” for new traders.
Why?
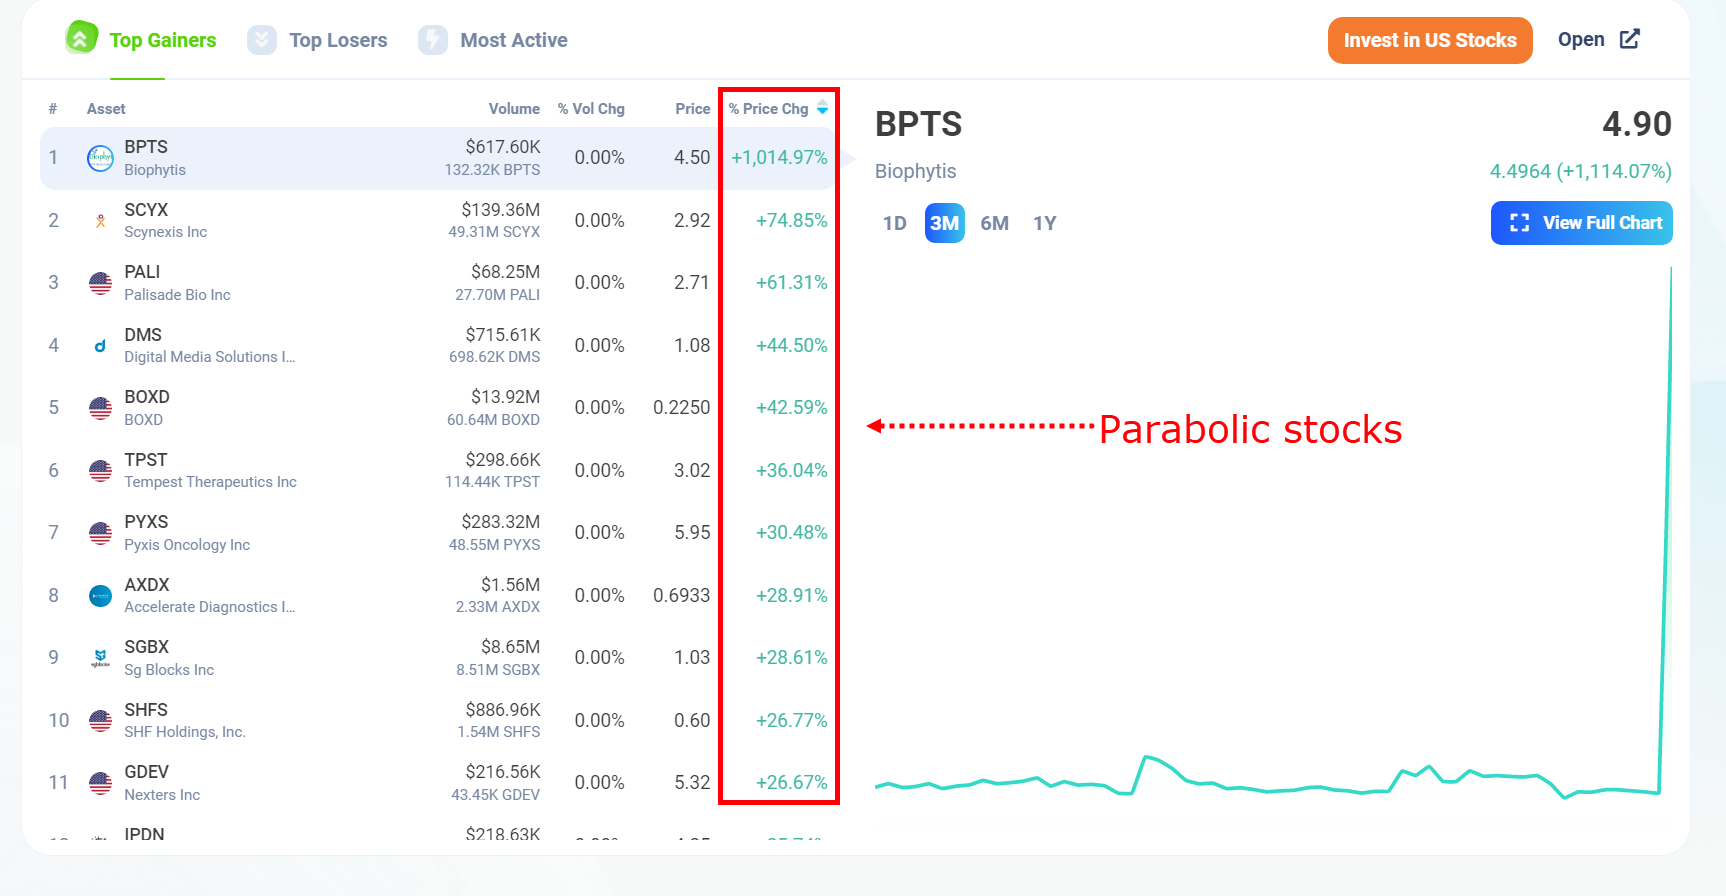
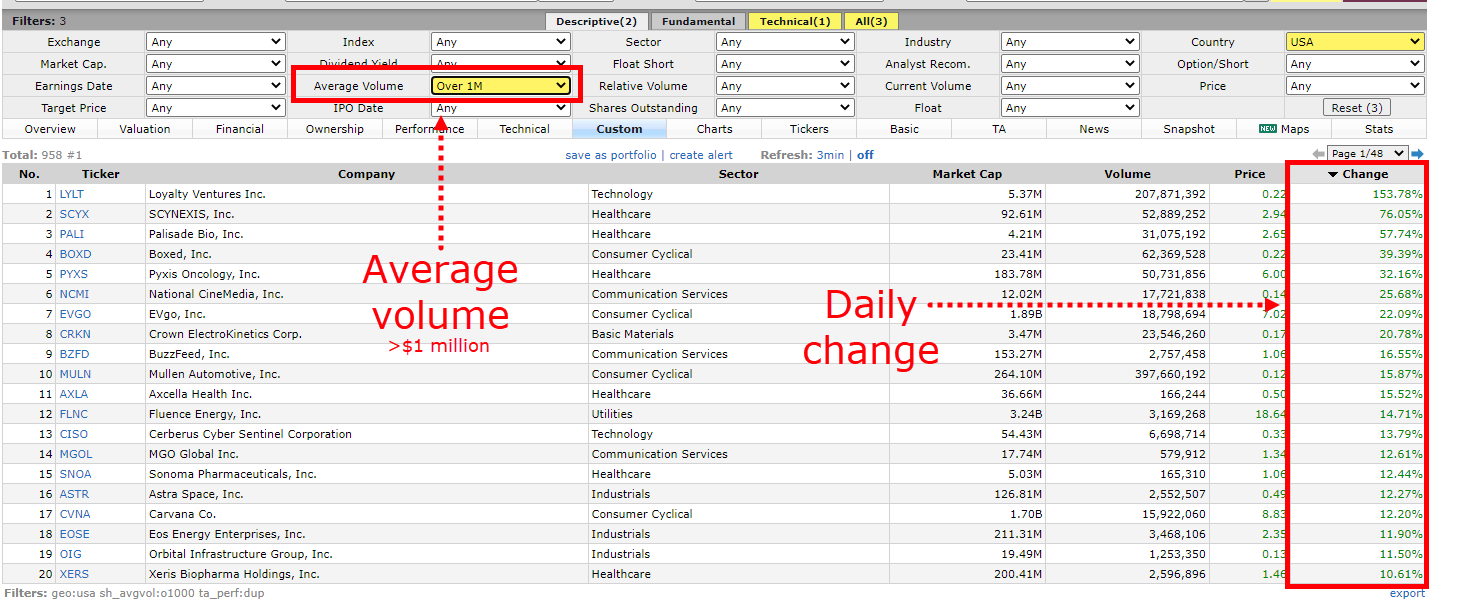
On almost every platform you always see this:
It’s so easy to spot!
So, what comes to your mind whenever you see those lists of stocks flying?
That’s right.
Money.
Quick profits.
Greed.
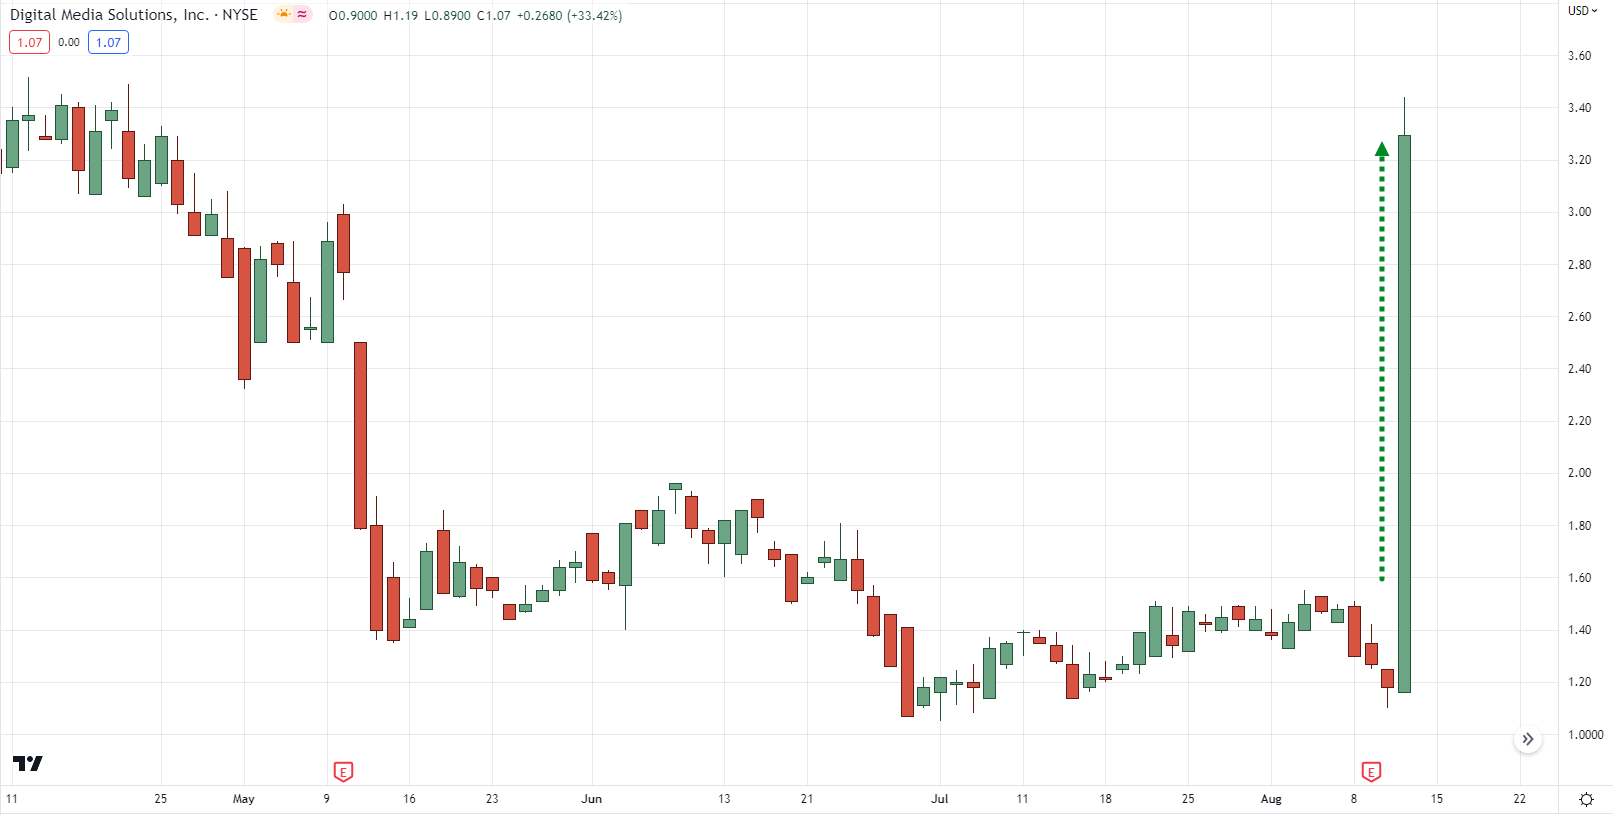
But when you look at one of the charts, you see this:
That looks like a freakin morse code!
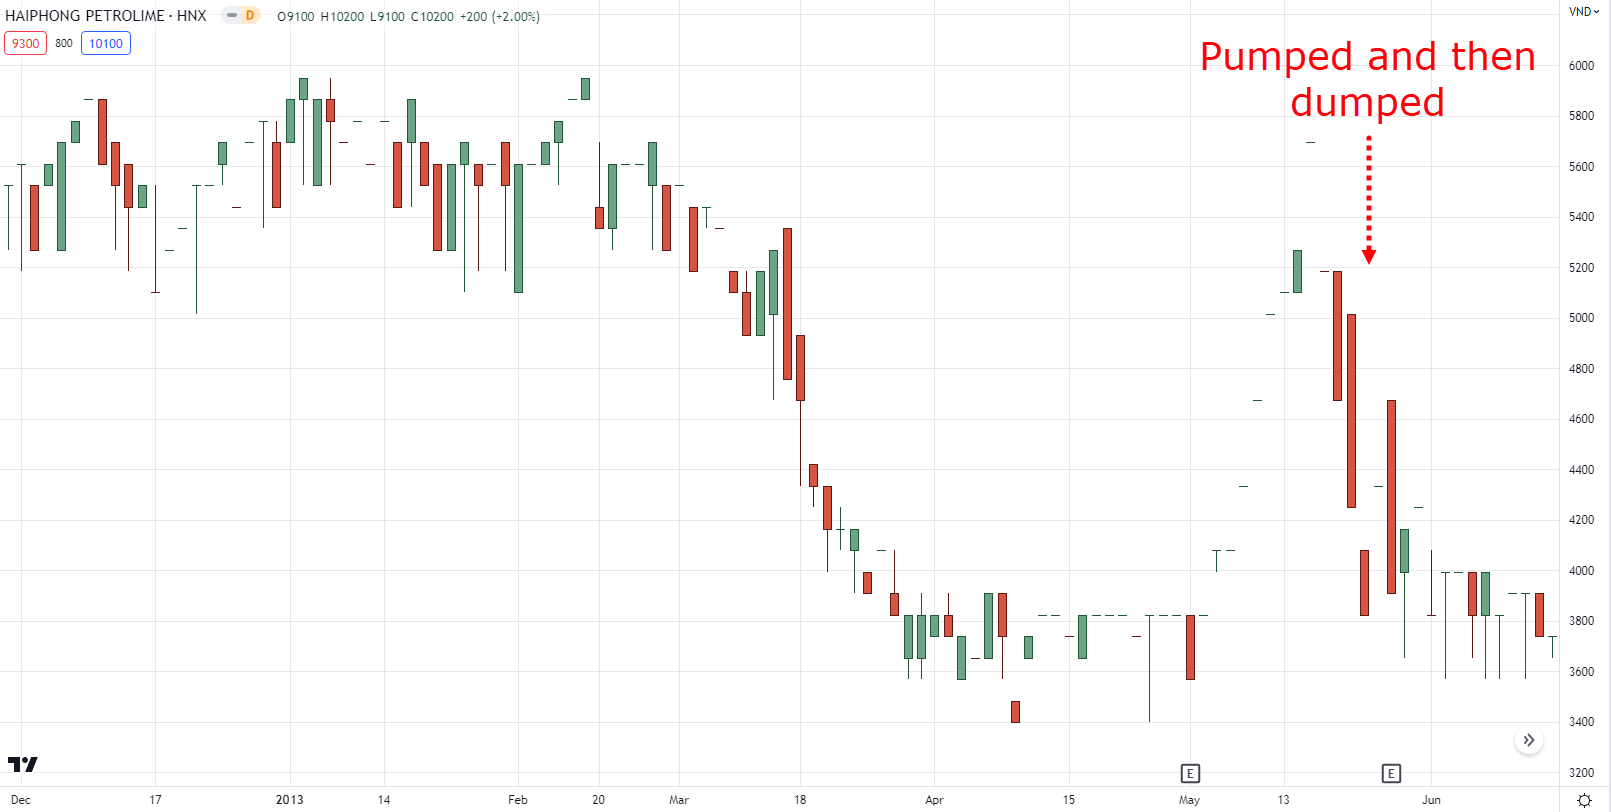
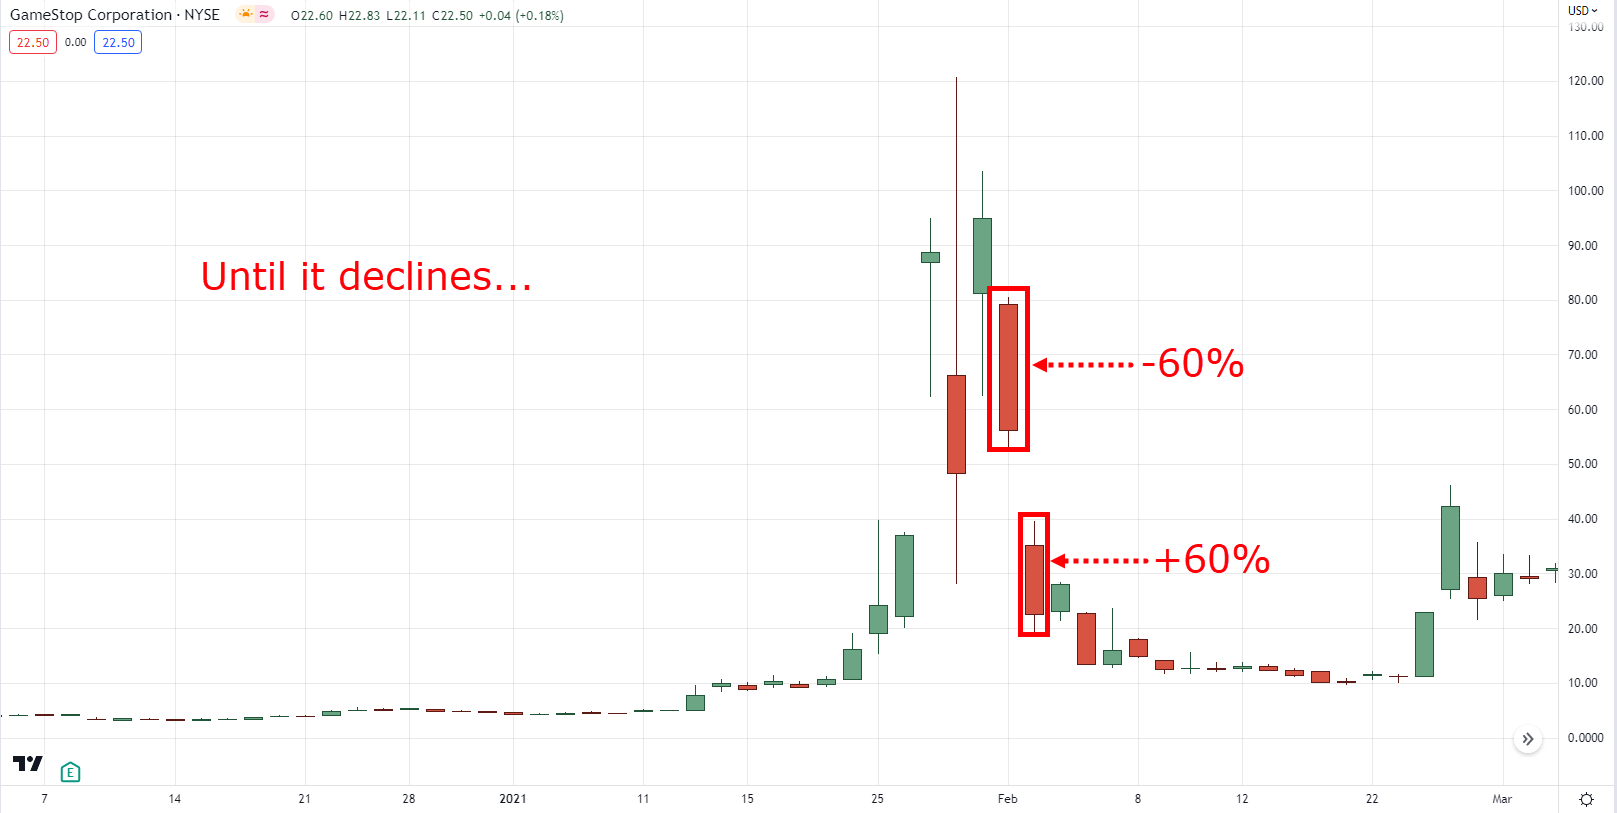
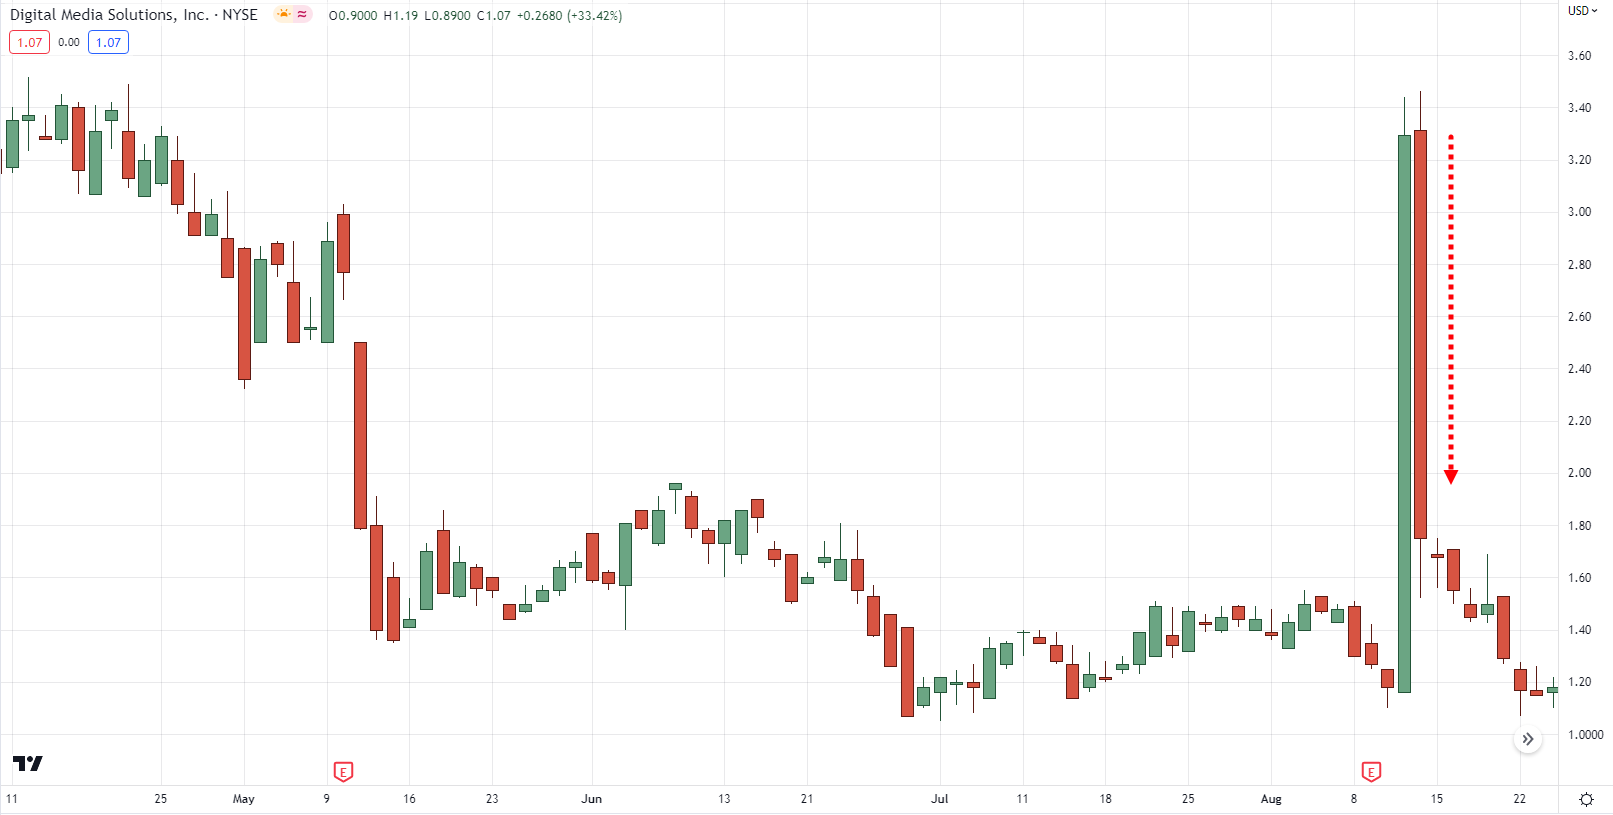
Now, it’s obvious that these kinds of stocks are to be avoided as this tends to happen:
Yep, a pump and dump.
However!
What I’m going to teach you today will be something different.
Especially on how to find a sustainable stock for parabolic stock trading.
More specifically, you’ll learn:
- What a parabolic stock is and its different forms
- A hidden (dark) secret about parabolic stock trading that you should know
- Two indicators you should use when trading a parabolic stock
- A complete top-down parabolic stock trading strategy
Are you ready?
Great!
Oh, and by the way…
This applies to almost all stock markets out there.
So, let’s get started!
Parabolic stock trading: What is it and when does it happen?
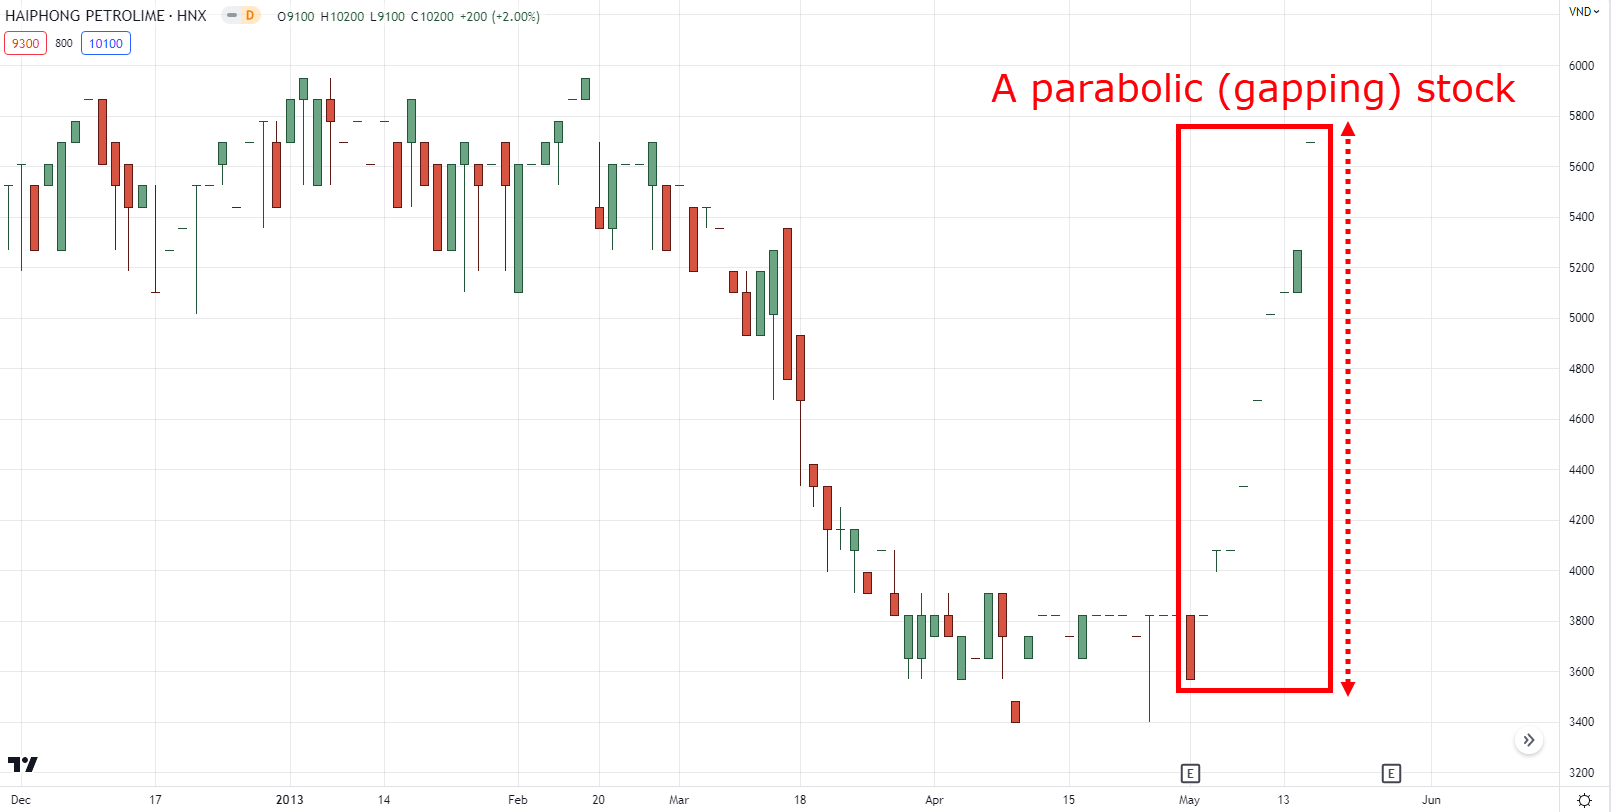
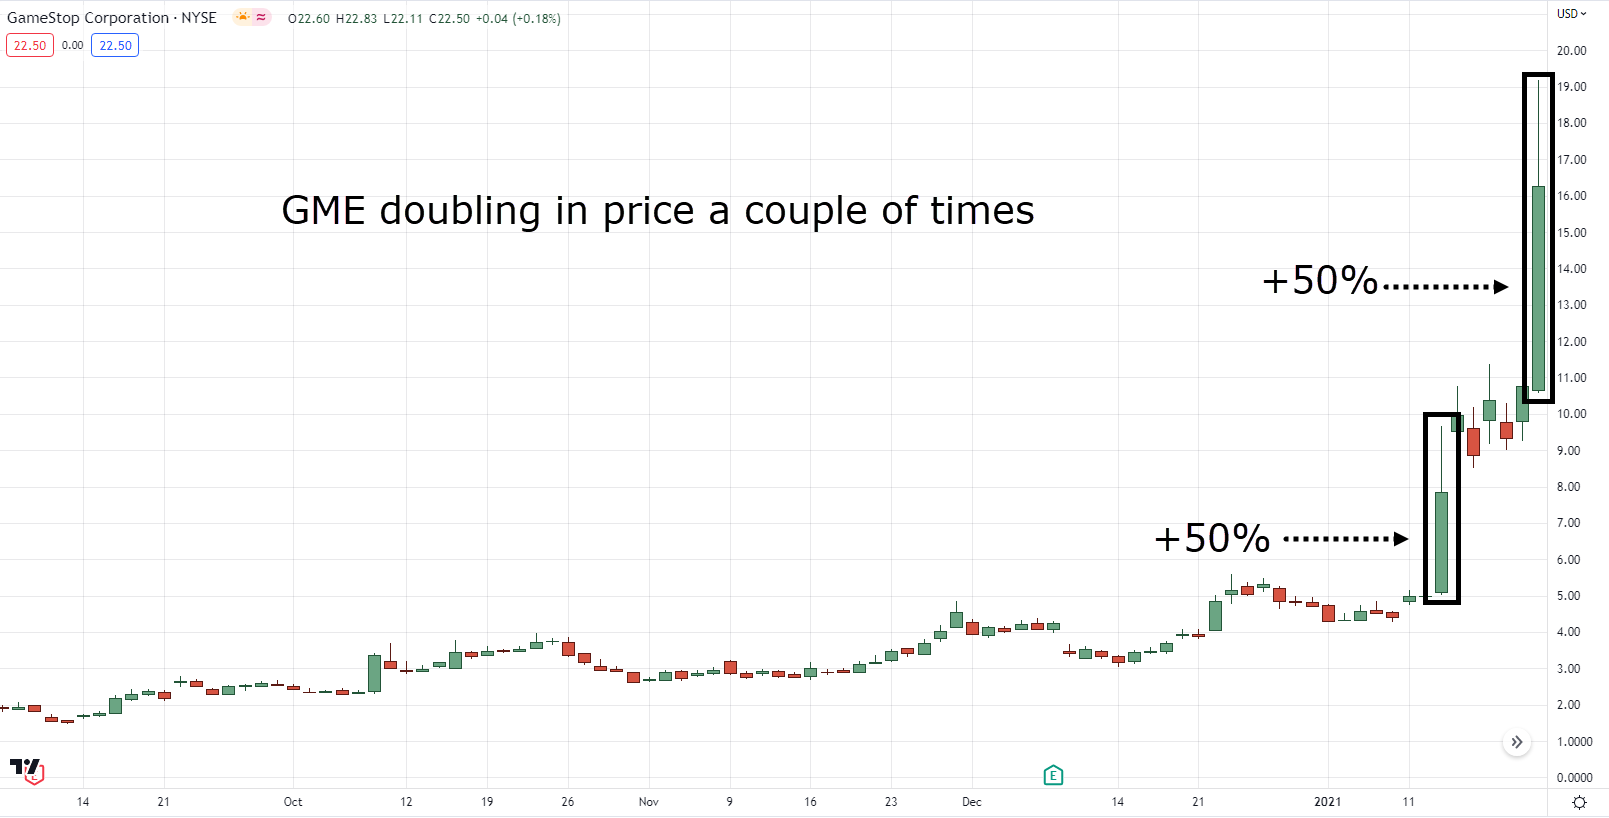
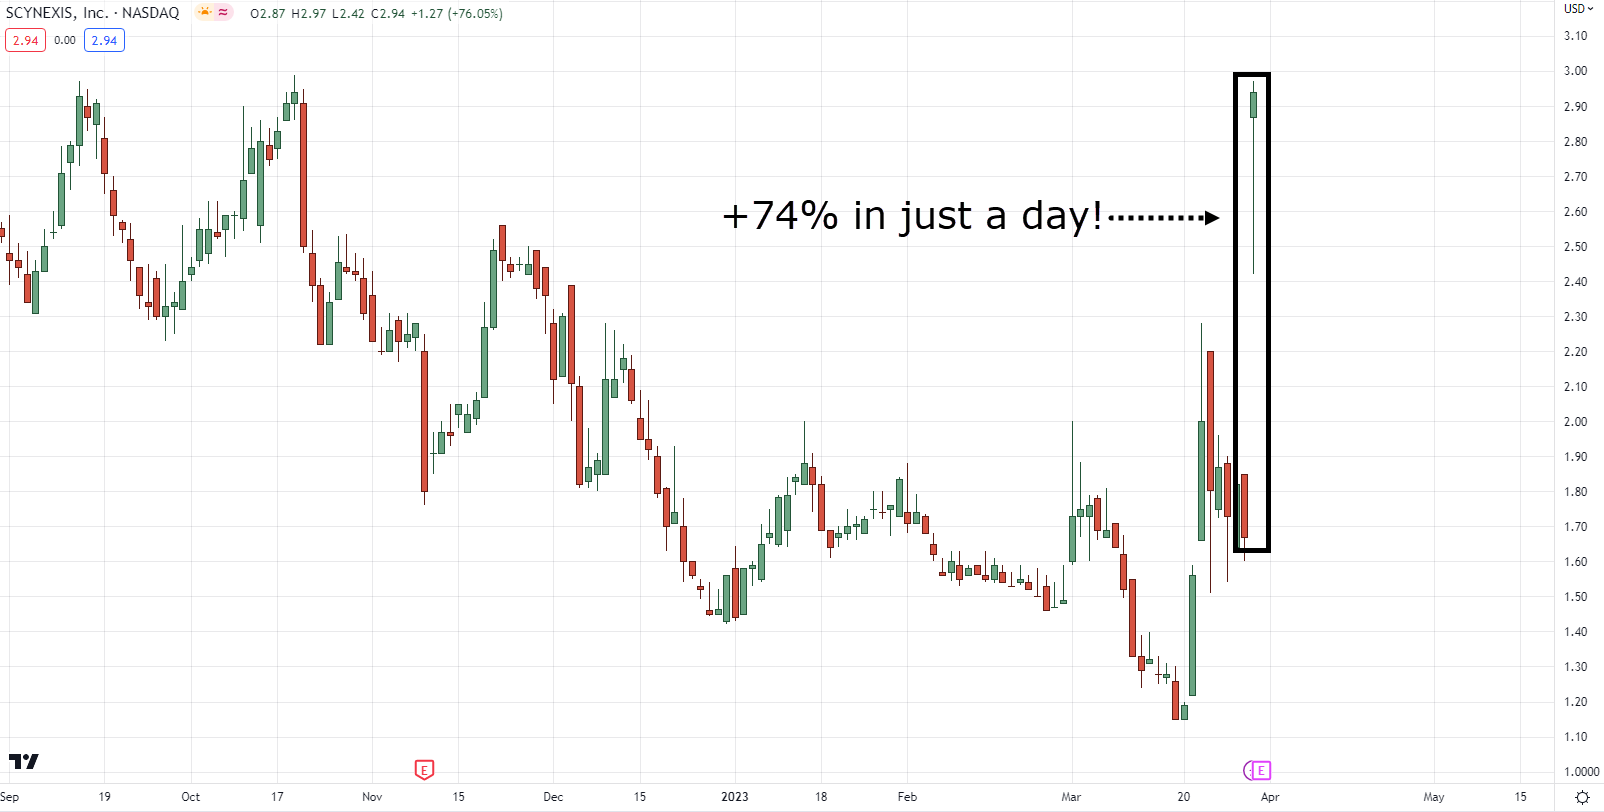
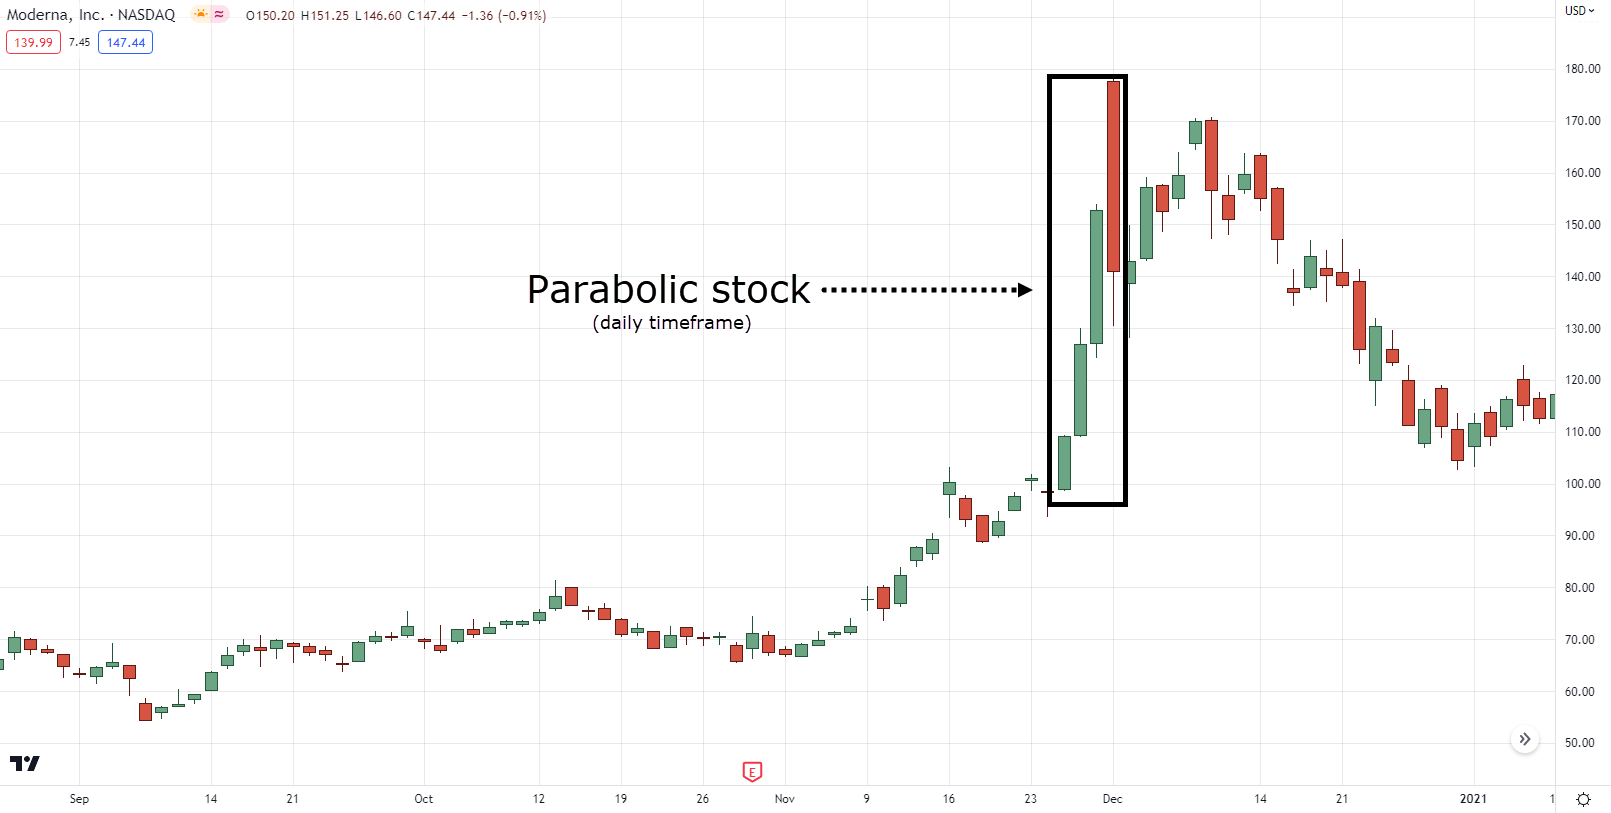
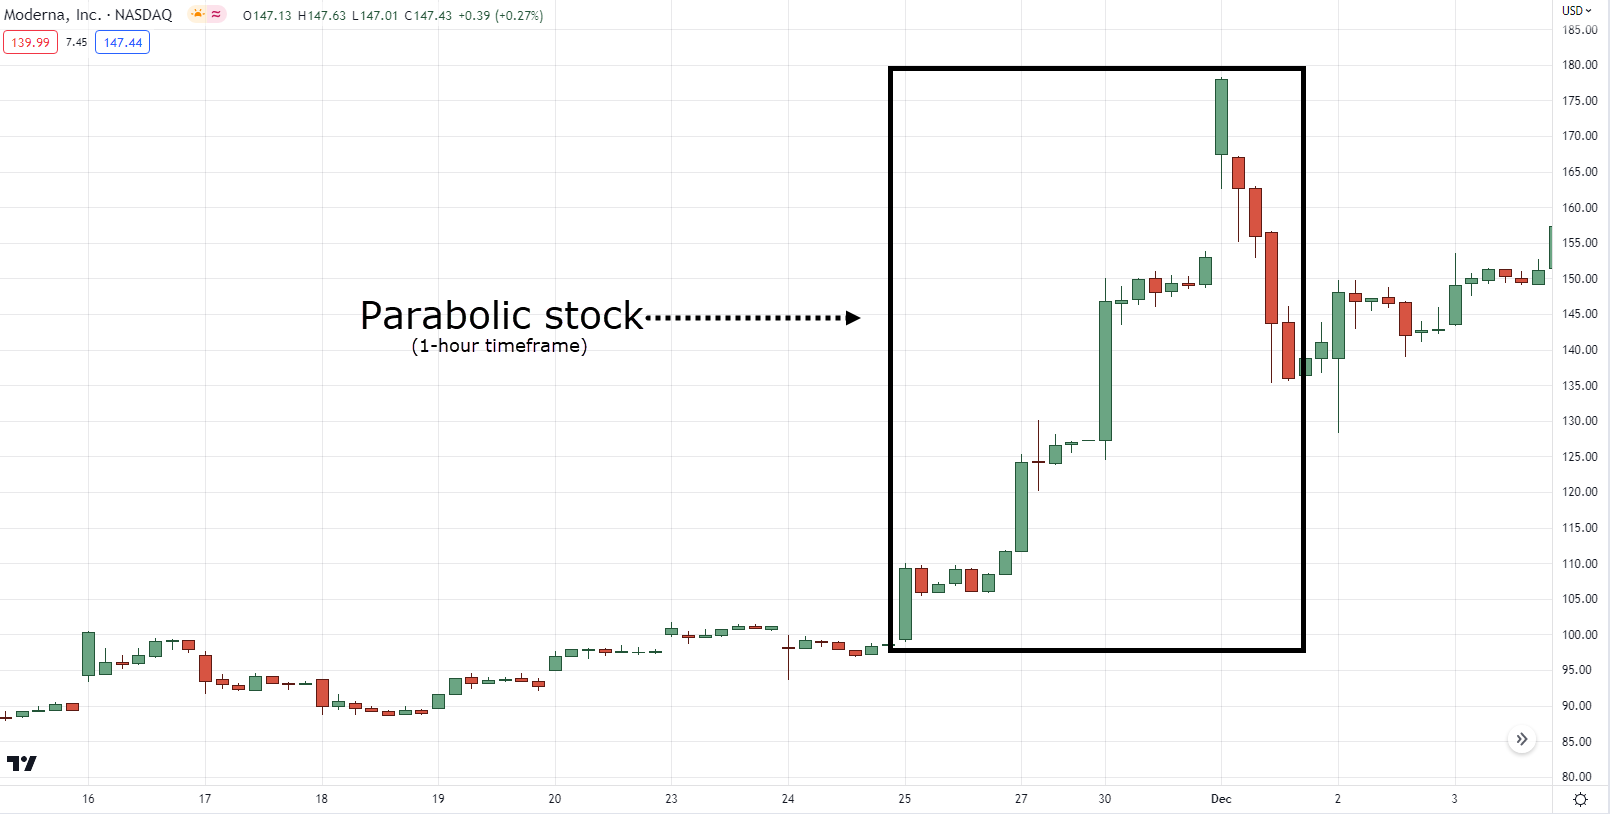
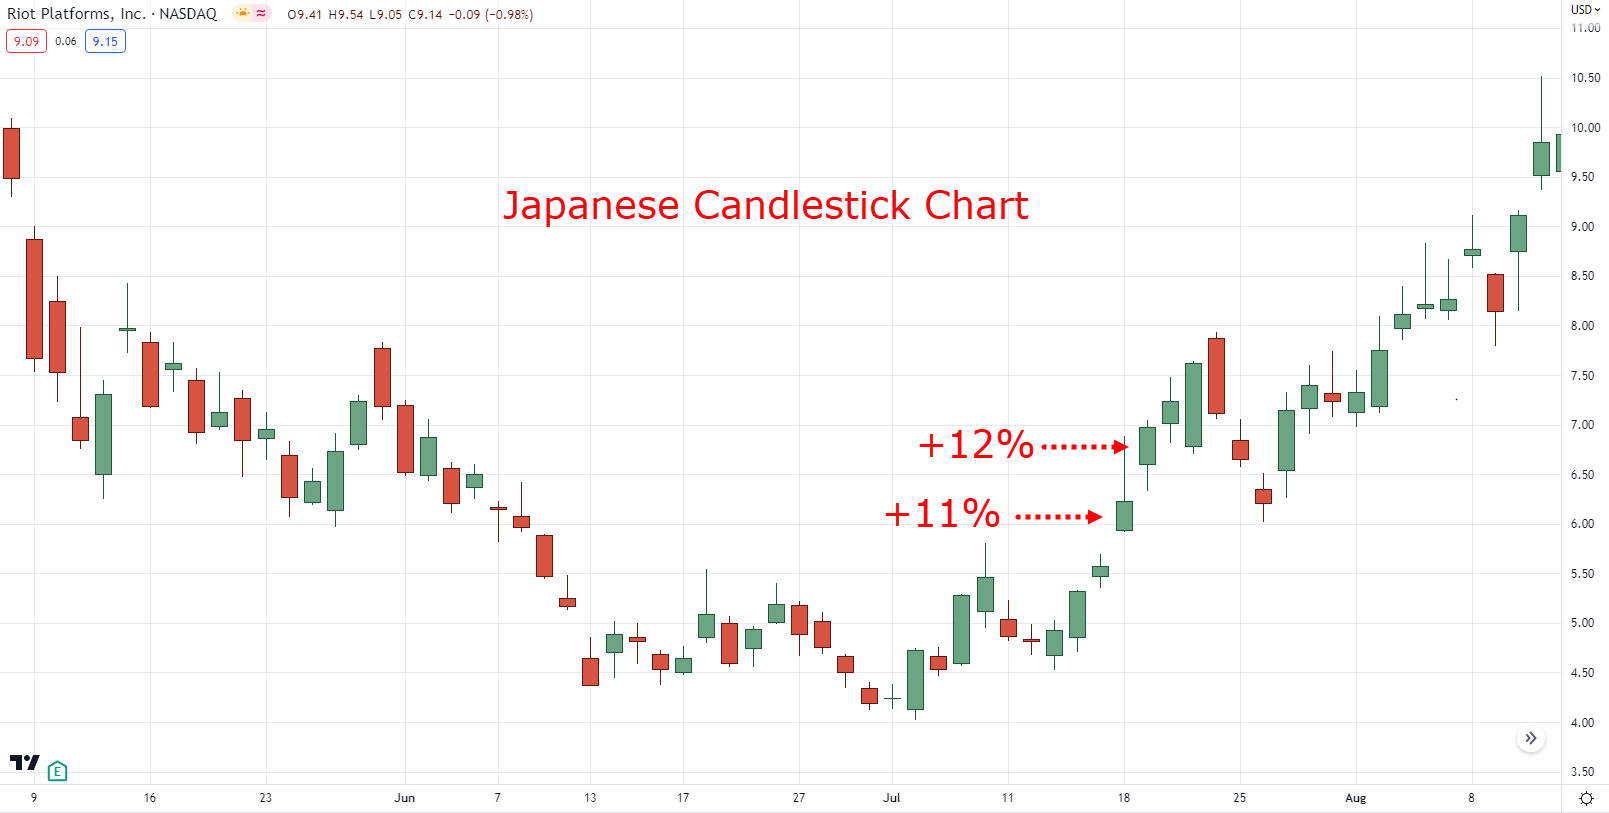
A parabolic stock is produced when its price increases (or is increasing) in a short amount of time such as gaining more than 10% in a single day.
It looks something like this:
In other words…
It often looks like a big fat middle finger on your chart!
Now, these kinds of movements are quite the anomaly.
Why?
Because with just the snap of a finger…
A parabolic stock suddenly gained popularity even (and often) without an established trend in place!
Seems pretty fishy, right?
How come a stock you’ve most likely never heard of suddenly came into popularity?
This, my friend…
Is something that we’ll dive into in the next section.
So, stick with me here.
The HIDDEN truth about parabolic stock trading
Here’s the thing…
I’m not here to tell you to:
“Follow the institution’s money!”
“Parabolic stocks are manipulated by hedge funds!”
“Parabolic stock trading is a scam!”
Why?
Because we’ll never truly know and I’ll just be making assumptions!
But what do we know?
What can we consistently point out whenever we’re looking a stock for parabolic stock trading?
Two things:
- The Volume
- The Fundamentals
Let me explain…
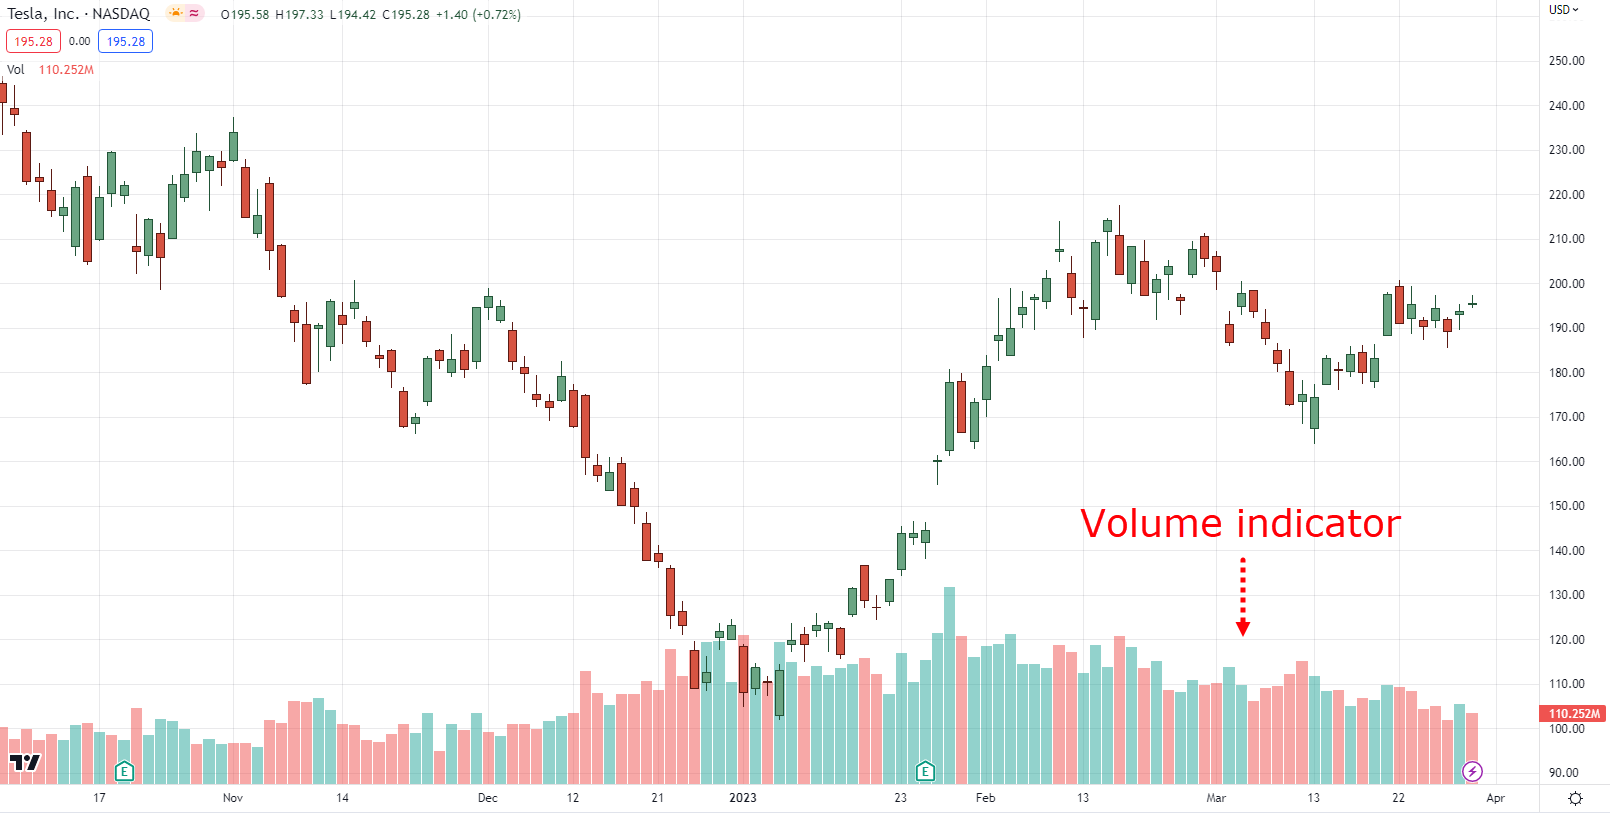
The average volume
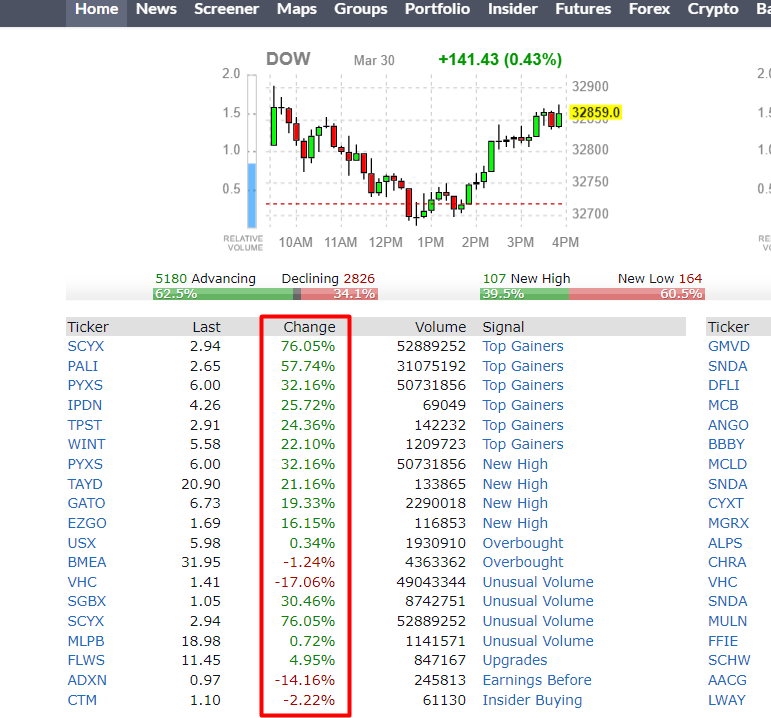
When I say volume I don’t mean this:
That’s right, actual numbers!
So, why should this be the first thing to look for?
Simple!
If the price is being pushed by a few people, then it’s a parabolic stock you must avoid.
However, if the volume that is being traded has great value…
Then you can be damn sure that it’s a celebrity stock that tons of fans are riding into!
It’s like you spotting Bruno Mars in the public!
But you can be damn sure that you’re not the only one craving for a selfie with him (which is good).
Makes sense?
P.S. Such volume scanners can be found on free scanning tools such as finviz for the US stock market.
Now…
The next one will be a little bit different than usual.
The Fundamentals
Imagine…
You’re at a public place and you suddenly see Bruno Mars as mentioned previously.
A celebrity!
You must get his autograph!
You must kiss his cheeks!
But as mentioned in the previous section…
You’re not the only one who’ll be trying to do the same thing!
But then something happens…
One of the crowd pulls his hair and his eyeglasses fall…
It turns out?
It’s a Bruno Mars impostor!
Then what happens?
That’s right, everyone either runs away or bashes that impostor!
And this, my friend…
Is the same when it comes to parabolic stock trading:
People leave when they realize that there’s no story behind it!
That the move is not sustainable!
So how do you look for a sustainable stock for parabolic stock trading?
That’s right, with fundamentals.
Now if you’ve been following our training guides you know that technical analysis is enough.
As it is what we mostly use!
But when it comes to parabolic stock trading, it’s a different case as fundamentals give volume an extra pump or boost into the move!
So, aside from volume…
What fundamentals should you look out for?
P/E Ratio?
Financial reports?
Earnings per share?
Good news…
It’s none of those!
As what you need is a “story” behind that recent +10% move.
That’s right!
Not numbers, ratios, and formulas, but simply a compelling story!
Now…
Trading with fundamentals deserves in-depth training in itself.
But to consistently look for good stories behind a parabolic stock you must always consider two things:
- You must be consistent with the platform of the story you are looking for
- The source/platform must be credible
Makes sense?
So, here’s the thing…
What I’ve taught you recently is how to find and select a stock for parabolic stock trading.
But how exactly do you trade it?
How do you manage the trade after you buy?
What should you do?
Well…
Let me show you in the next section!
Parabolic stock trading: 2 secret ways on how to ride a parabolic stock
Now that you have a consistent method of finding and selecting a parabolic stock…
How should you trade it?
Well, there are two ways you can go about trading this:
- Lower timeframe (H1)
- Higher timeframe (D1)
Let me show you how…
Lower timeframe (H1)
First!
The reason why I chose the 1-hour timeframe is that the stock market isn’t open 24 hours just like the Forex or Crypto market.
This is why the 4-hour timeframe won’t apply.
Second!
You should only choose this method only if your lifestyle supports it.
If you’re a part-time dad with two babies with a full-time job…
The only thing you’d gain from this is not more money but more eye bags!
Now…
The reason why we go to the lower timeframes is that it gives you a better picture of what the price action is.
From this…
To this…
And what are the things that you should look for?
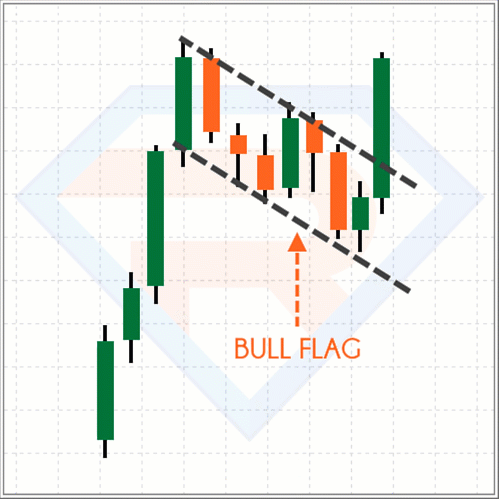
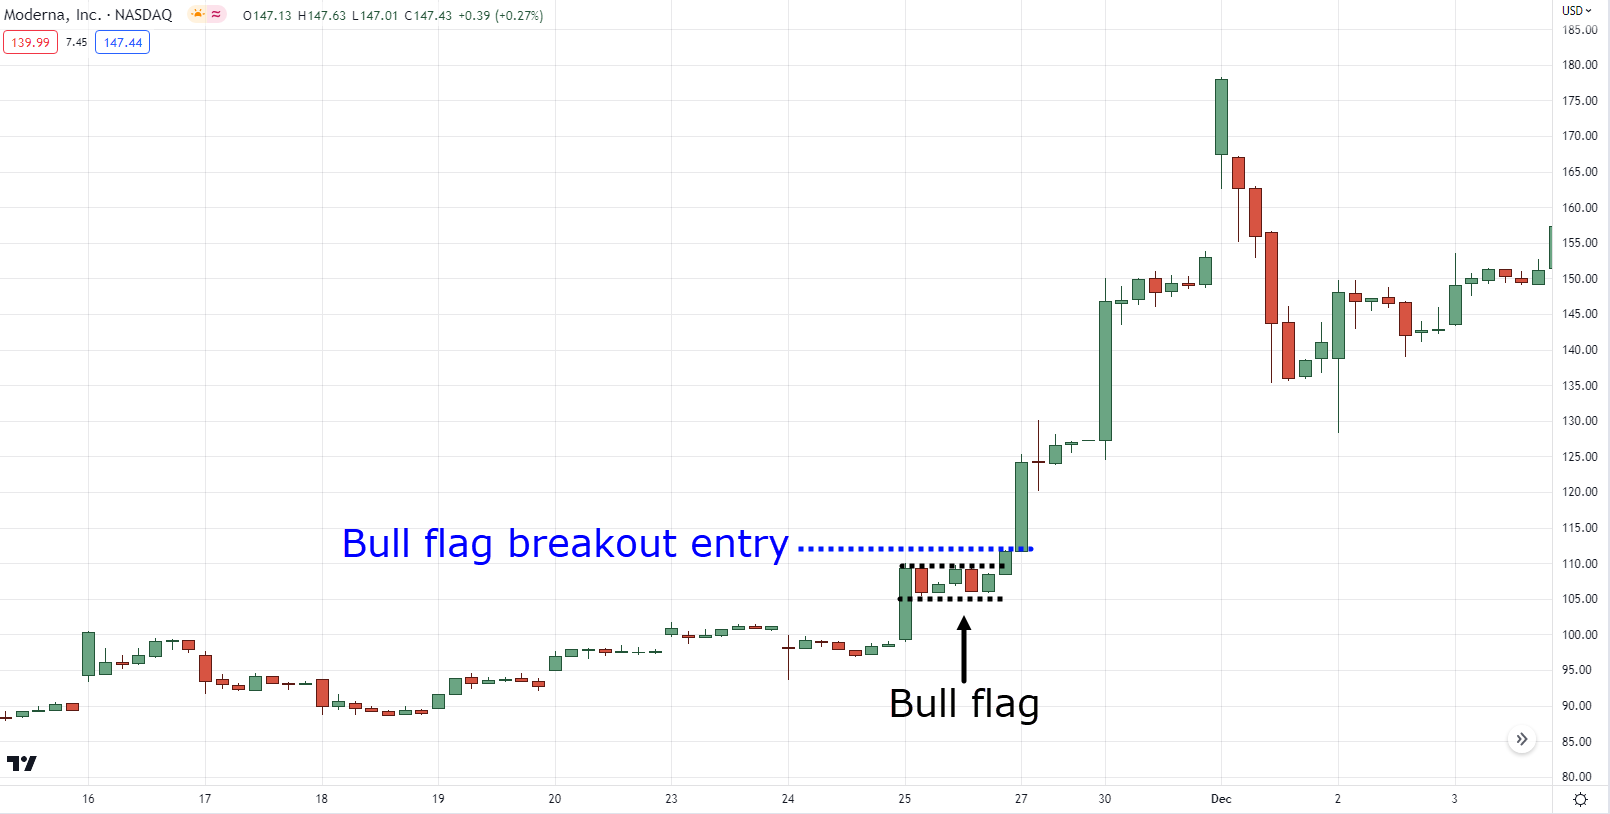
Simple, a flag pattern:
As you know…
Flag patterns are a brief pause in an existing trend!
(And by the way, they can come in different shape or form.)
Which makes it an area of value for you to hop into the hype train.
So, once it makes a bullish candle breakout, then you can enter at the next candle open:
(and by the way, I suggest you be conservative and only allocate 10-20% of your capital)
So, once you’ve entered…
How do you manage the trade?
The answer?
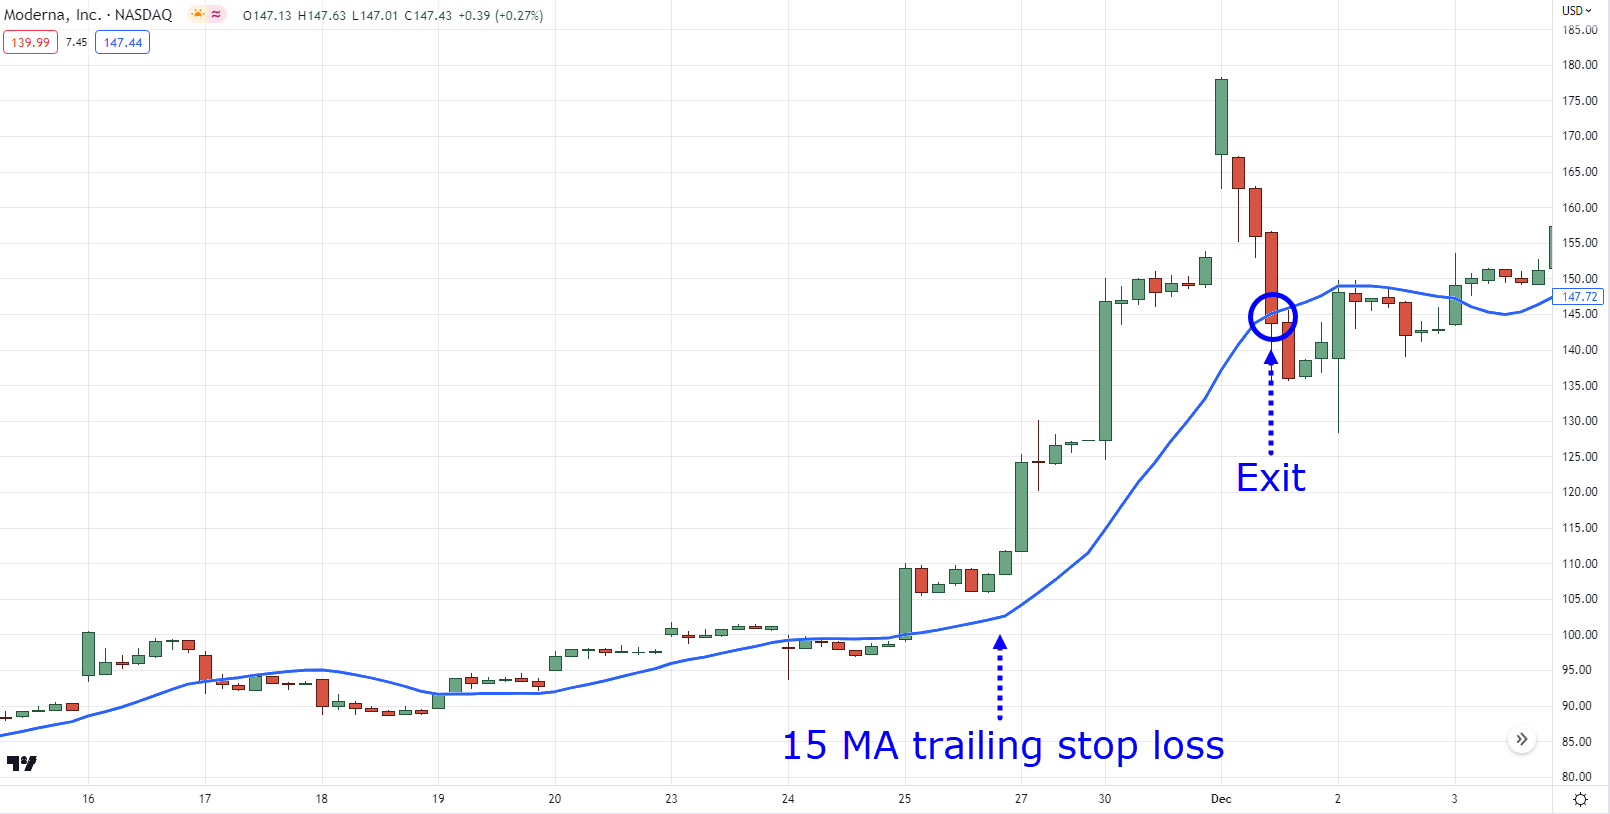
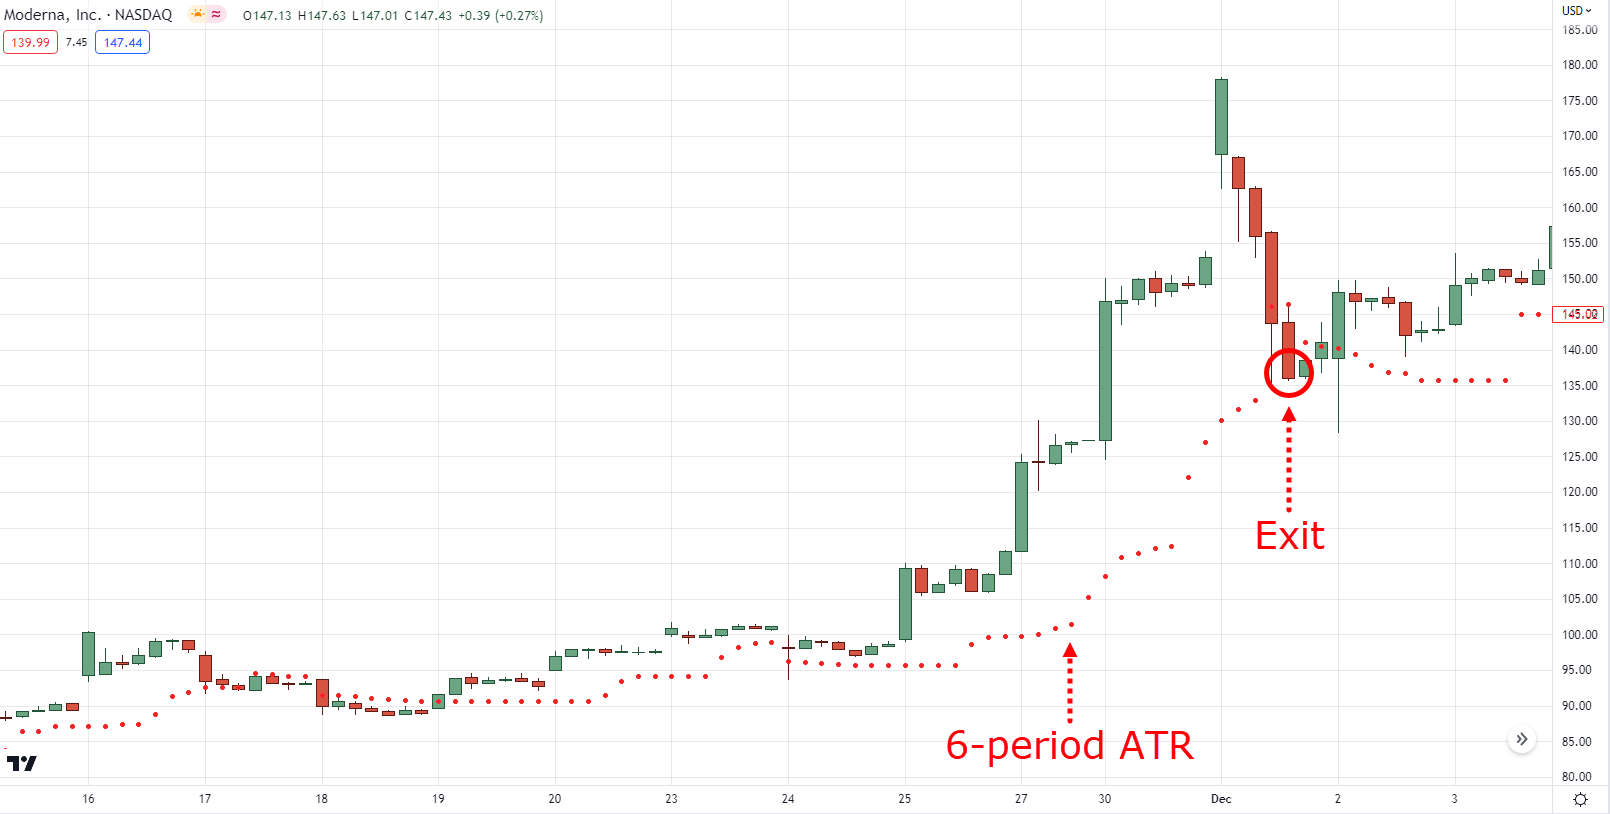
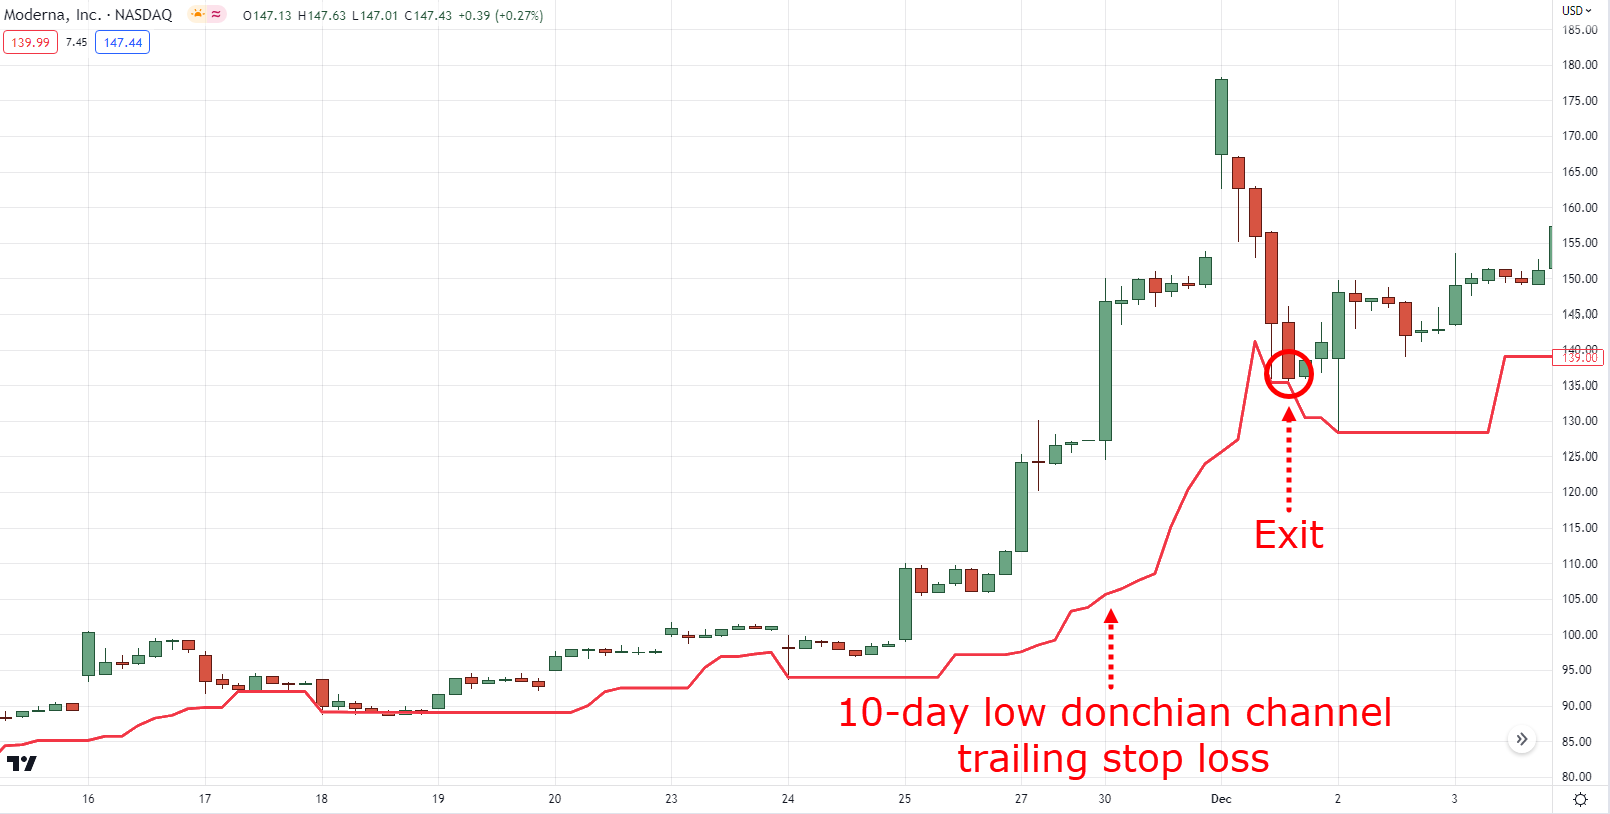
A tight trailing stop loss.
Ah yes, I know, not the answer you’re looking for.
But this is because there are many indicators to go about this!
It can be through a…
15-period moving average exit:
6-period ATR exit (chande kroll stop):
Finally, a 10-day low Donchian channel exit:
Holy *beep* that’s a lot of indicators?
Which one should I choose?
In this case my friend…
I am encouraging you to understand the indicator and choose one that makes sense to you the most!
So, if you want to learn more, you can check out these guides…
The Moving Average Indicator Trading Strategy Guide
Donchian Channel Strategies That Work
The Complete Guide to ATR Indicator
Next!
Higher timeframe (D1)
You’re probably thinking:
“Eeeew the daily timeframe, it’s so booriing”
“There’s no money to be made in the daily timeframe ugh!”
Now, hold on my friend!
Since we’re dealing with a parabolic stock trading method (which doesn’t last long mind you)…
You want to make sure that you’re also using a “tight” trading tool to enter and exit quickly!
So, what is this tool you may ask?
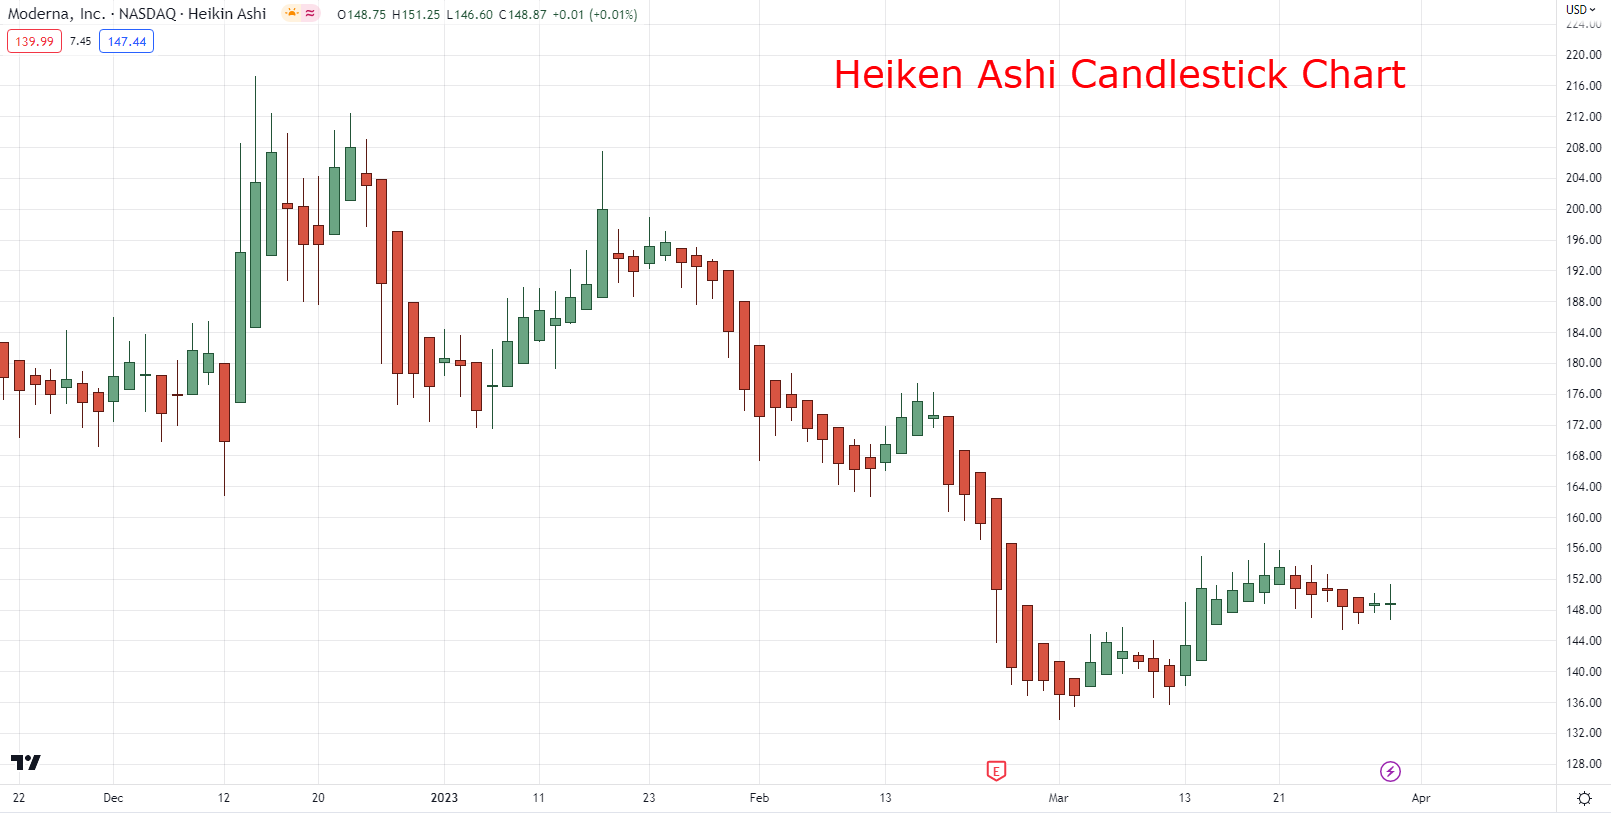
The Heiken Ashi Candlestick!
I could spit out a lot of formulas on how it works.
But basically, it’s like a candlestick moving average!
So, when do you hop into the trade?
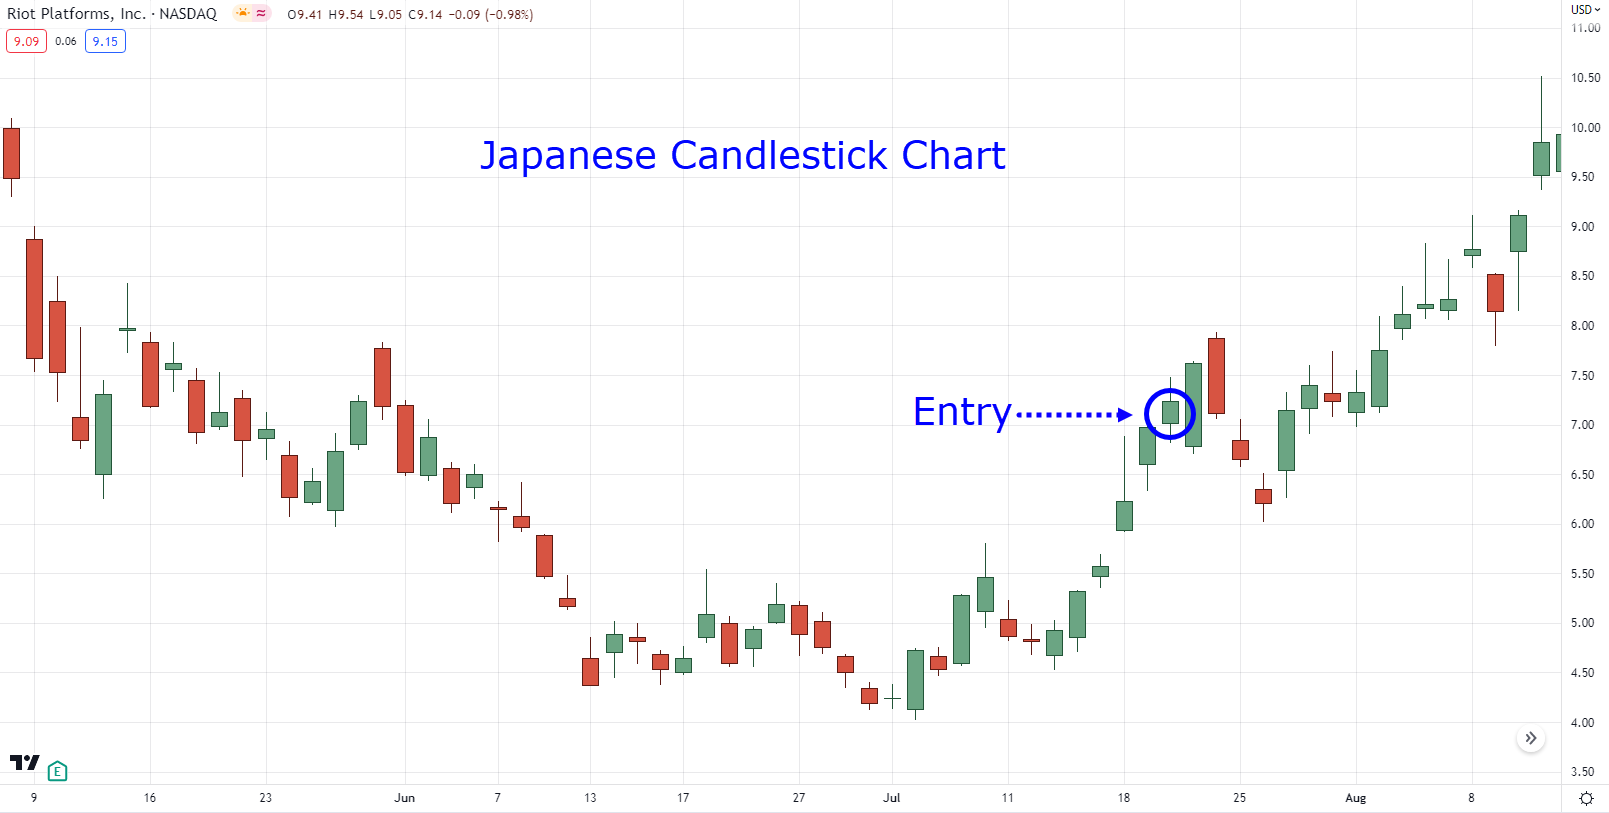
First, is when you’ve identified a stock that’s made +10% two days in a row (with a good “story” behind it)…
Then enter at the opening of the 3rd day…
By the way, it’s easier to us the usual candlestick charts to determine the +10% entry condition and entry trigger for the first steps!
But you might be wondering…
“Why do I enter the 3rd day?”
“Why not the 1st day?”
Good question!
You see…
Our entry condition with the Heiken Ashi is too loose.
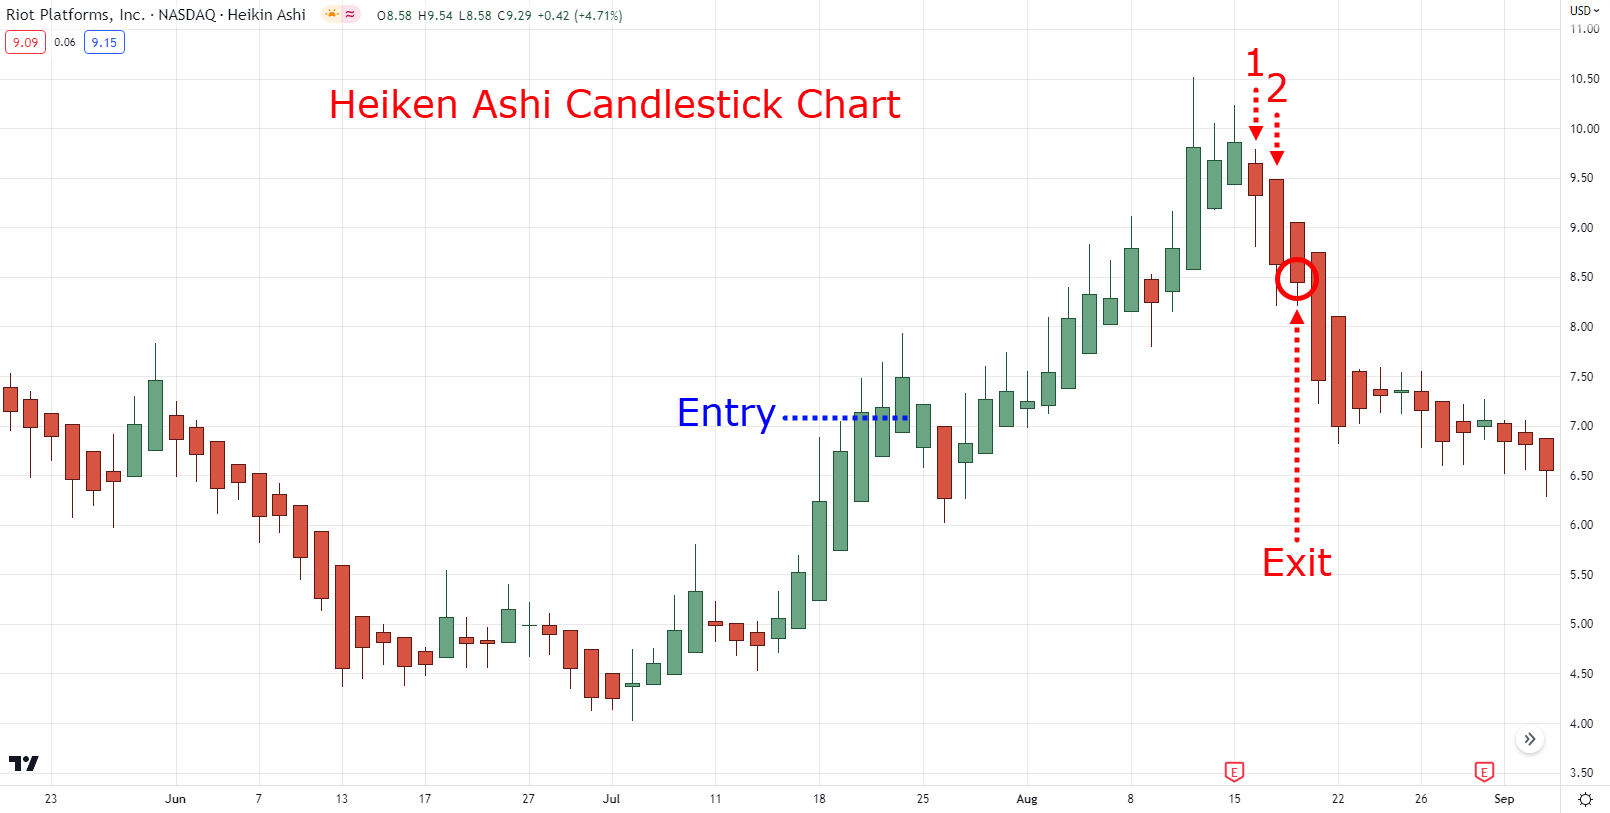
Simply enter if the current Heiken Ashi bar is green!
Which is why we need an extra layer of confirmation.
Makes sense?
So, when do you exit?
The opposite thing!
You exit when the Heiken Ashi closes two red candles in a row!
Now…
I know I’ve spent a lot of time sharing with you the principles of each element in this parabolic stock trading strategy.
So, let me give you a quick recap…
On the lower timeframe (H1):
- You look for a stock that has gained +10% in a single day with a good story/fundamental behind it
- You enter when that stock makes a bull flag pattern breakout on the 1-hour timeframe the next day (after it has made a +10% gain)
- You use a tight trailing stop loss on the 1-hour timeframe as your exit trigger
On the higher timeframe (D1):
- You look for a stock that has gained +10% in a single day with a good story/fundamental behind it
- You wait for a stock to close +10% again on the second day and as a green Heiken Ashi bar
- You enter the market open on the 3rd day
- You exit if the stock makes a red Heiken Ashi bar two times in a row (exit on 3rd-day market open)
There you go, my friend!
A complete parabolic stock trading strategy with the flexibility for you to tweak some settings!
Now before I end this guide…
Here’s something you must know about the parabolic stock trading strategy…
As discretionary traders…
You must test this method first before you risk your hard-earned money.
Why?
Because you must build the confidence to trade it!
Why trade with blind trust, right?
Also…
This training guide is written in a way that also applies to other stock markets in the world.
That’s right, not just in the US Stock Market.
This is why I kept things more generalized!
Sounds fair?
And finally…
There are many ways how you can go about selecting stocks using fundamental analysis.
So, I suggest you incorporate the concept into your method if you use fundamentals!
Got it?
P.S. If you want to know the opposite of parabolic stock trading then you can check out our falling knife guide here.
So, with that said, let’s do a quick recap of what you’ve learned today!
Conclusion
- A parabolic stock is formed when a stock jumps in price by more than 10% in one day
- Using both volume and fundamentals is crucial to identifying good stocks to trade for parabolic stock trading
- You can trade a parabolic stock from the 1-hour or from the daily timeframe depending on your lifestyle
Over to you…
Which stock market do you trade?
The Indian stock markets?
The Philippine stock markets?
If so, do parabolic stocks often happen?
And what are some tools that you can recommend?
Let me know in the comments below!




The parabolic trading strategy is more like timing the pump and selling the dump.. Can this this strategy also work in forex and crypto currency market?
Hey there Festus, definitely!
Parabolic movements occur in all markets, especially in the crypto during its booming years