I’m sure you can agree:
Price action trading helps you to better time your entries & exits—without relying on indicators, news, or opinions.
Awesome!
But the problem is, there’s so much information out there (like candlestick patterns, chart patterns, trendlines, support & resistance, etc.) which makes it difficult to piece the puzzle together.
Where do you start?
What should you look for?
Is there a price action indicator to make sense of everything?
Well, the thing is…
When it comes to price action trading, less is more.
And after years of trading and experimenting, it turns out there are only 6 things that matter when it comes to price action trading—and you can ignore 90% of everything else.
Do you want to know more so that you can build your own price action trading system?
Then let’s start with #1…
#1: Market structure
The first thing a price action trader must learn is, market structure.
Because if you don’t understand it, then a chart won’t make any sense to you—and you won’t know when to buy, sell, or stay out of the markets.
But if you do understand market structure, then a world of opportunities unfolds before your eyes.
So, what is market structure?
It’s a framework to categorize the stages of the market so you know what to do in different market conditions.
In other words, market structure tells you what to do, whether you should be buying, selling, or staying out of the markets.
Moving on…
Market structure can be broken down into 4 stages:
- Accumulation stage
- Advancing stage
- Distribution stage
- Declining stage
Let me explain…
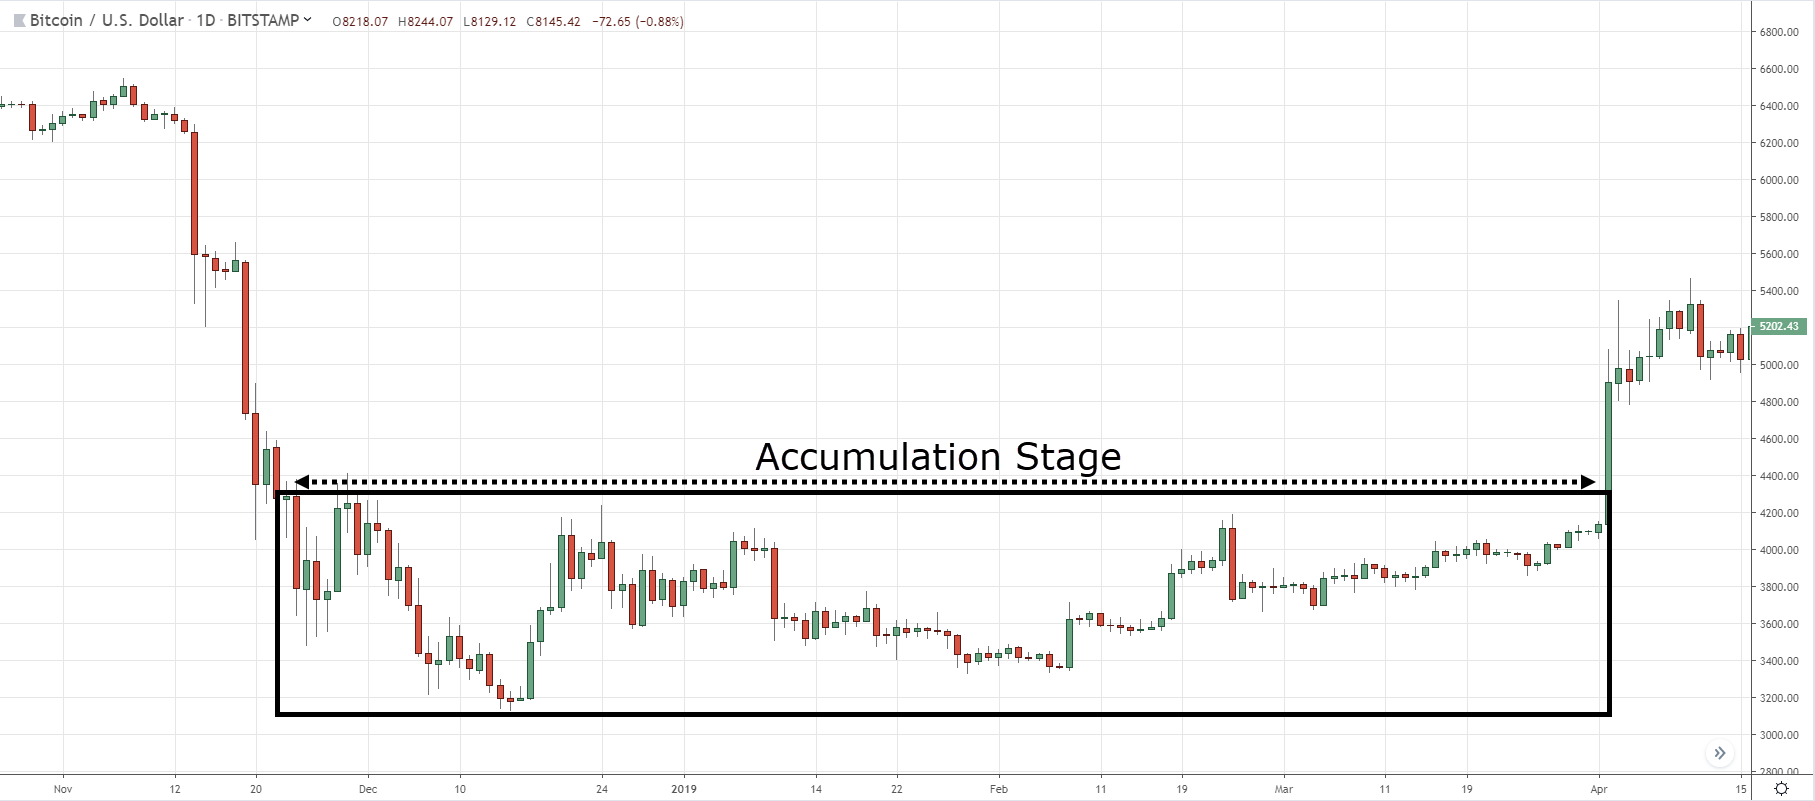
Accumulation stage
The accumulation stage looks like a range market—in a downtrend.
Here’s what I mean:
Now, there are 2 reasons which contribute to the accumulation stage.
Bullish traders
As the price moves lower, bullish traders will buy as the price is “too low”—which puts buying pressure in the market.
Bearish traders
At the same time, there are still bearish traders entering the market hoping the trend will continue.
Now…
When you combine both buying and selling pressure, you get in equilibrium in the market (otherwise known as a range market).
Now…
Just because the market is in an accumulation stage doesn’t mean it will breakout higher—there’s also a possibility it could break down lower.
So, if you’re bearish in an accumulation stage, then you can look for selling opportunities at resistance.
Or if you’re bullish, then you can look for buying opportunities at support or when the price breaks above resistance. When that happens, that’s when we move onto the next stage…
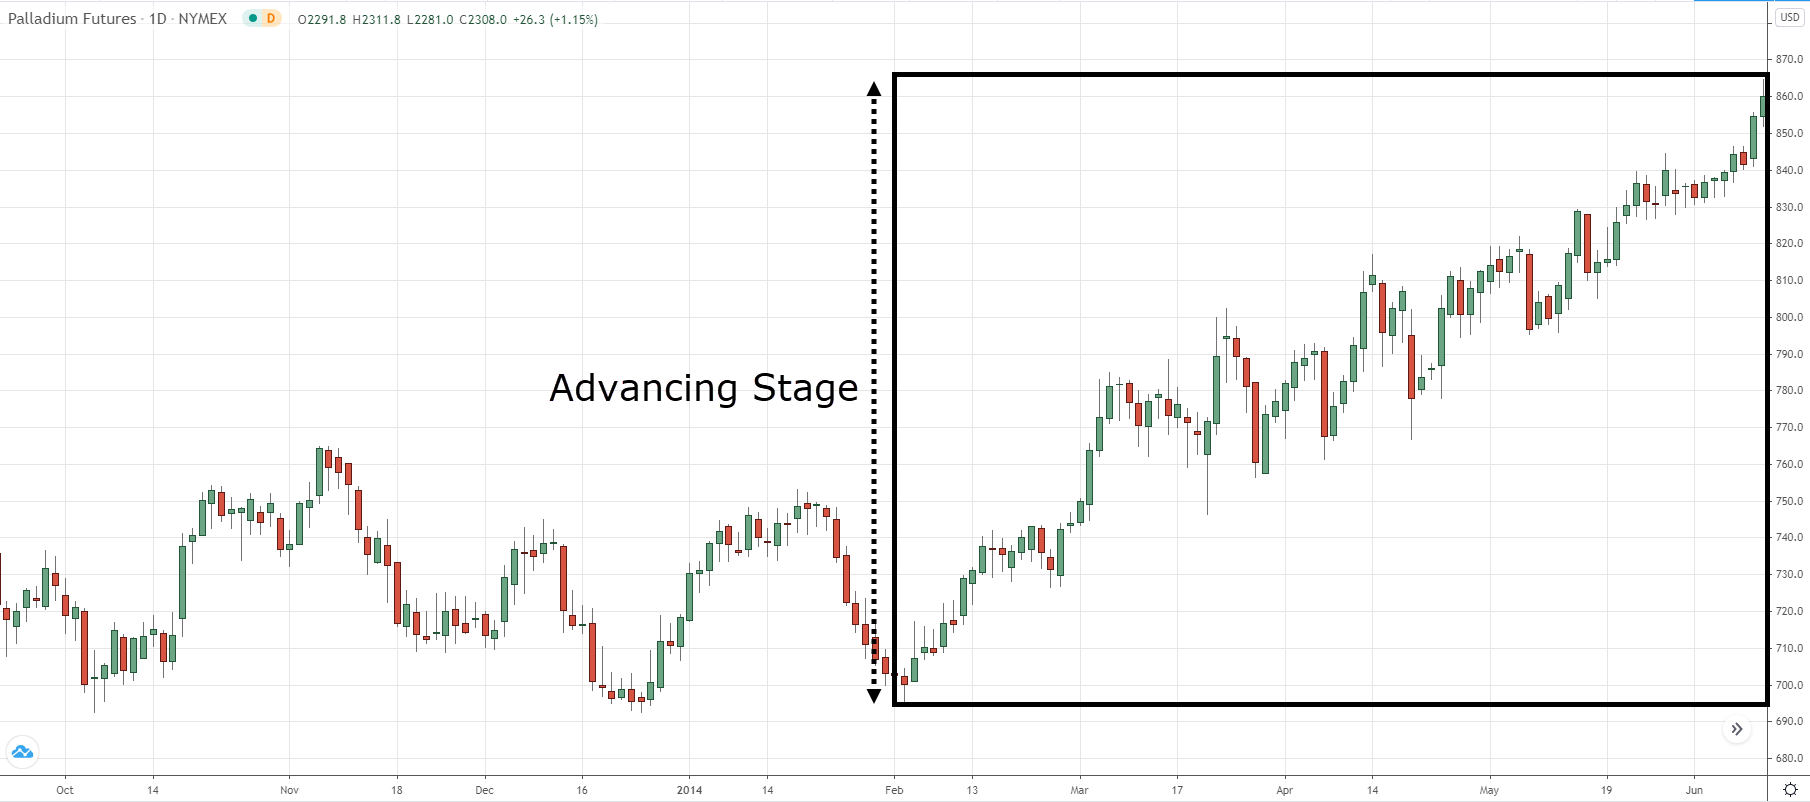
Advancing stage
The advancing stage is an uptrend—with a series of higher highs and lows.
At this stage, most traders can recognize the trend and are looking for buying opportunities.
Here’s an example:
However, no market goes up all the time.
Eventually, it’ll start to show signs of weakness and that’s when we move onto the next stage…
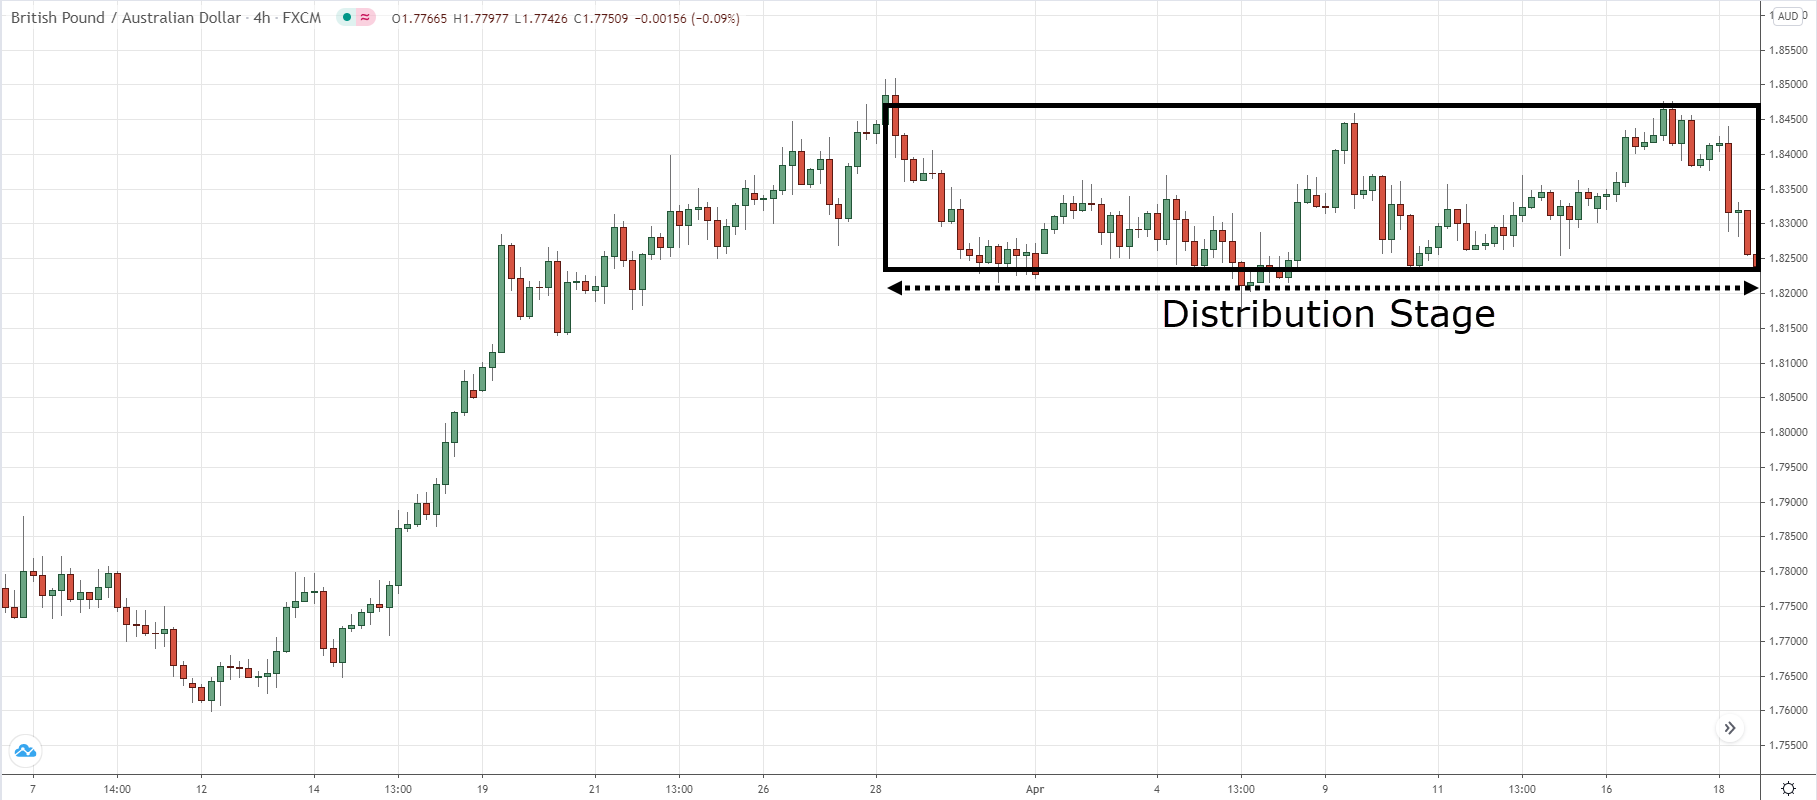
Distribution stage
The distribution stage looks like a range market—in an uptrend.
Here’s what I mean…
Now, there are 2 reasons which contribute to the distribution stage.
Bearish traders
As the price moves higher, bearish traders will short the market as the price is “too high”—which puts selling pressure in the market.
Bullish traders
At the same time, there are still bullish traders entering the market hoping the trend will continue.
Now…
When you combine both buying and selling pressure, you get in equilibrium in the market (otherwise known as a range market).
However, if the price breaks below the lows of the range, that’s when we enter the last stage…
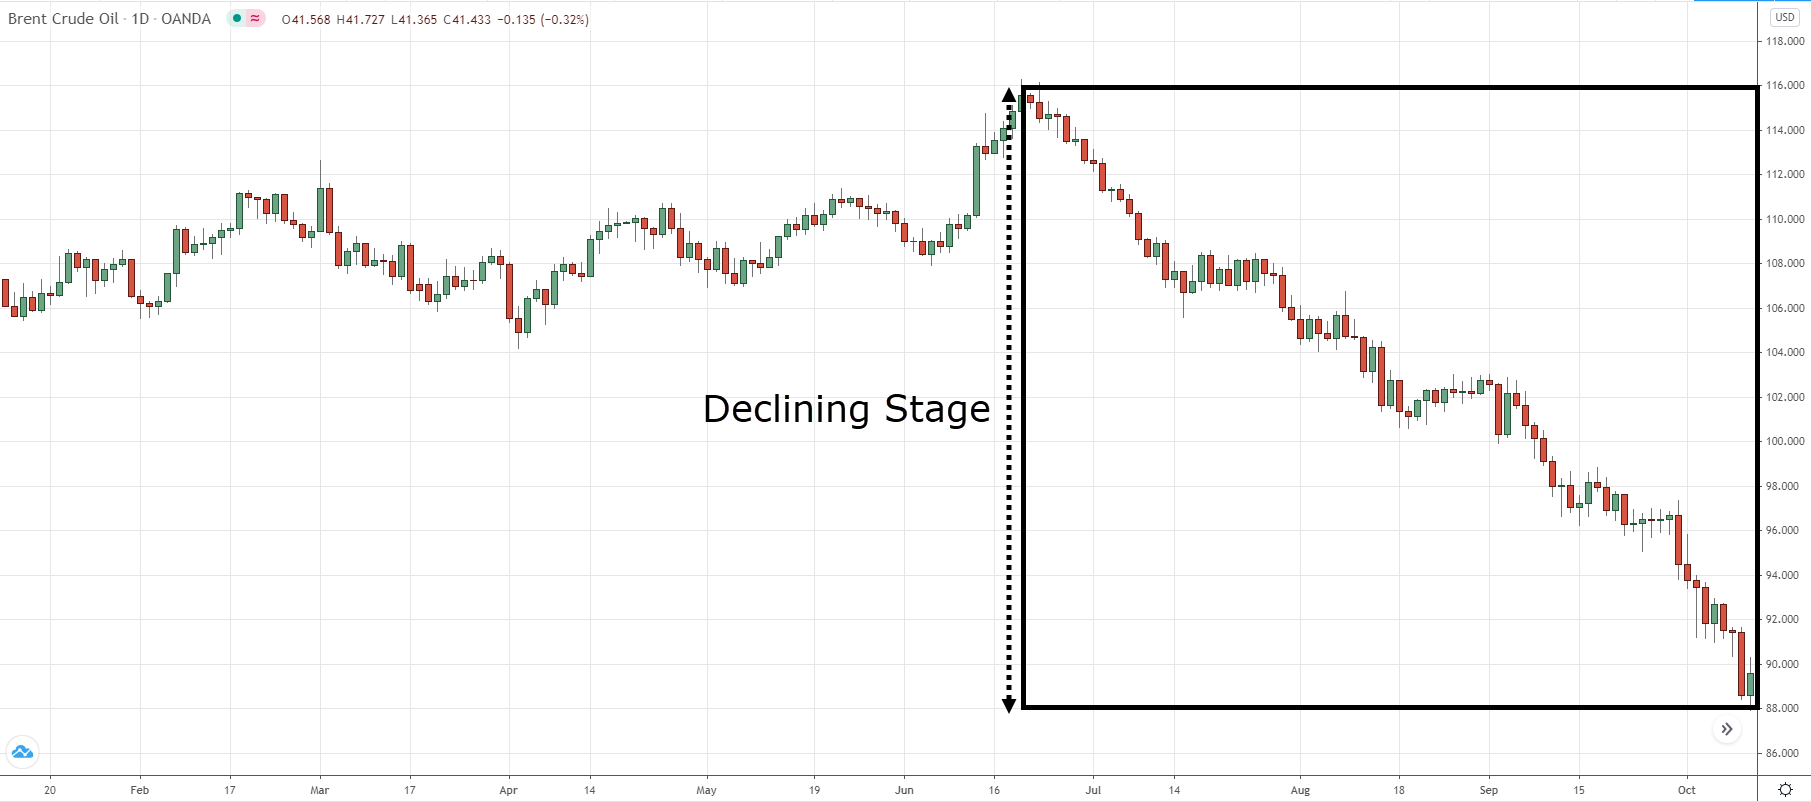
Declining stage
The declining stage is a downtrend—with a series of lower highs and lows.
At this stage, most traders can recognize the trend and are looking for selling opportunities.
Here’s an example:
However, no market goes down all the time.
Eventually, it starts to show signs of strength and that’s when we move back to stage 1 (the accumulation stage).
Moving on…
#2: Area of value
At this point:
You’ve learned how market structure gives you a framework so you’ll know whether to buy, sell, or stay out of the markets.
So now the question is, where do you buy and sell?
Well, that’s what we’ll cover in this section.
Let’s get started…
So what is an area of value?
An area of value refers to an area on your chart where potential buying/selling pressure could step in.
It could be things like:
- Support and Resistance
- Moving average
- Etc.
Let me explain…
Support and Resistance
So, what is support & resistance?
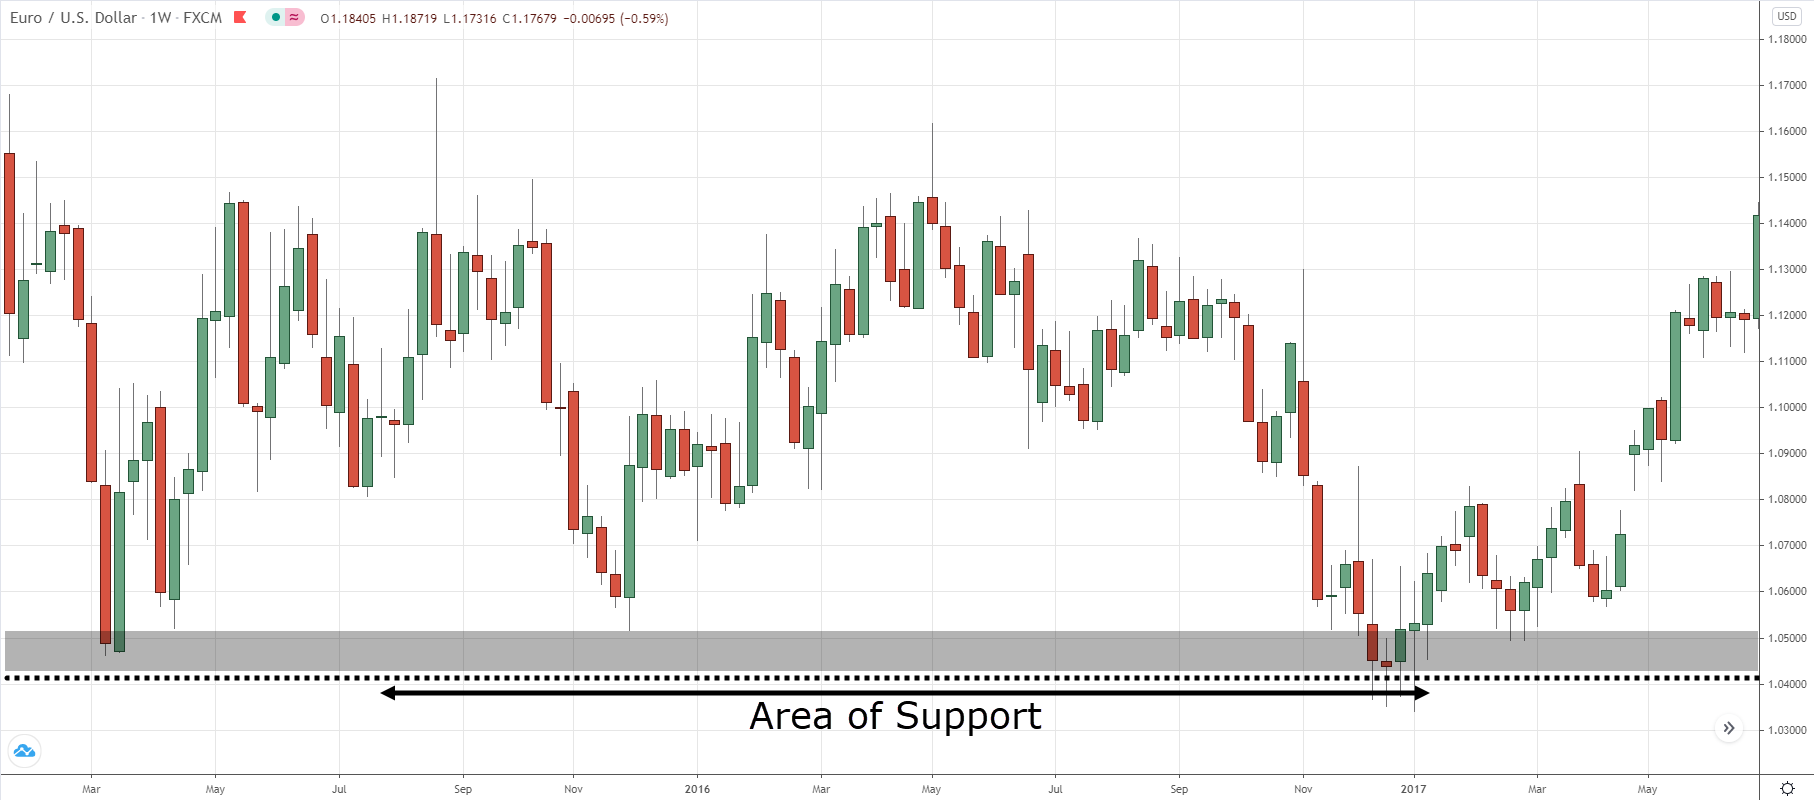
Support – an area of value as potential buying pressure could step in and push the price higher.
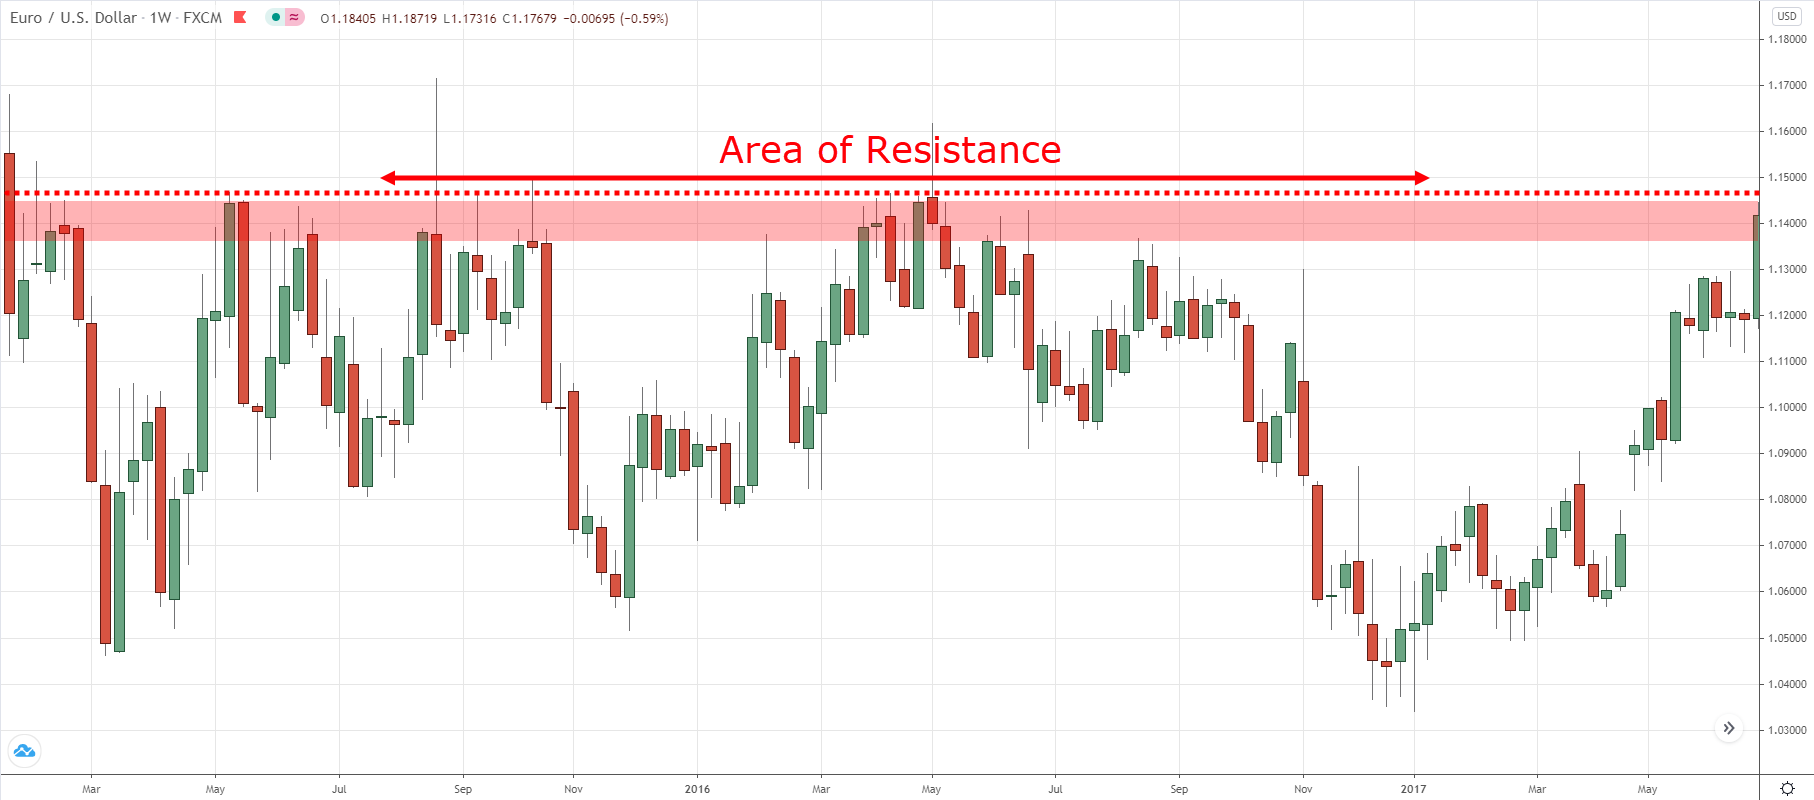
Resistance – an area of value where potential selling pressure could step in and push the price lower.
Here’s an example…
If you want to learn more, then go read The Support and Resistance Trading Strategy Guide.
Moving average
Moving average is an indicator that averages the historical prices on the chart.
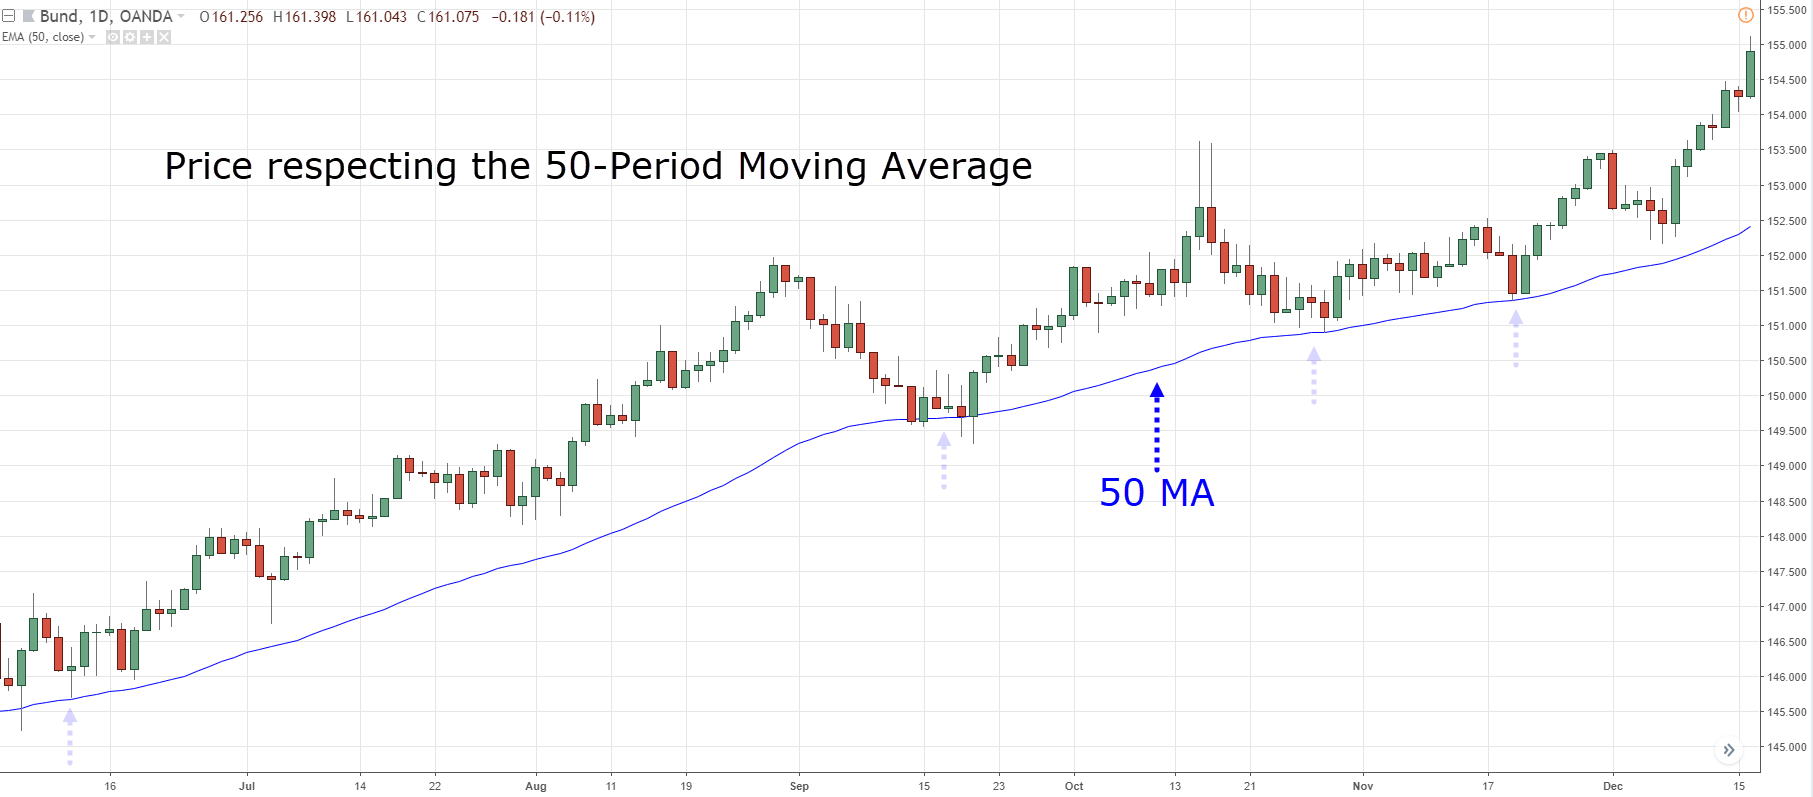
And in a trending market, the price might respect the moving average as it finds potential buying (or selling) pressure—which acts as an area of value.
Here’s an example:
Clearly, looking for buying opportunities as the price retraces towards the moving average isn’t a bad idea.
Now, bear in mind an area of value doesn’t mean just support & resistance or moving average because it could also extend to things like trendline, trend channel, etc.
Cool?
Then let’s move on…
#3: Entry trigger
Quick recap:
Market structure tells you what to do (whether to buy, sell, or stay out of the markets).
Area of value tells you where to buy and sell.
And now the question is…
When do you enter a trade?
Well, that’s the purpose of an entry trigger… to tell you when exactly to enter a trade.
So here are 2 techniques you can use:
- Break of structure
- False break
Let me explain…
Break of structure
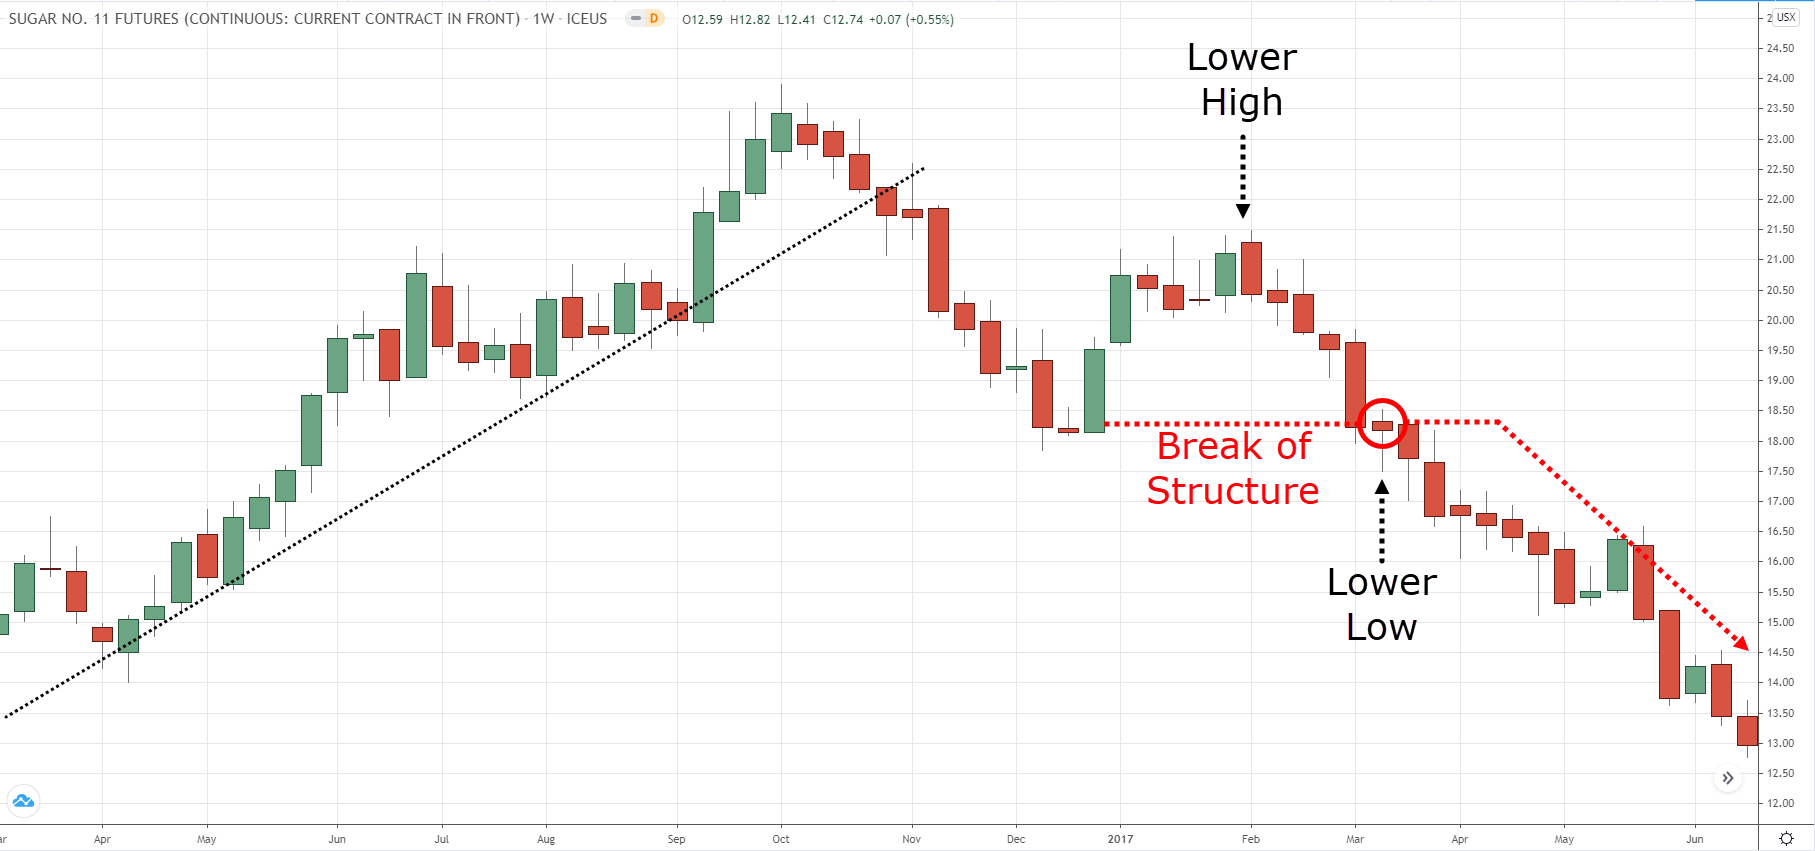
The break of structure is a reversal price action pattern which allows you to enter the start of a new trend—with low risk.
Here’s what to look for:
- An uptrend approaching resistance which can be seen on the higher timeframe (you want the resistance area to attract attention from the sellers on the higher timeframe)
- The price fails to make a higher high but instead, made a lower high (this gives us a reference point to set our stop loss)
- Go short on the break of swing low or support
(And vice versa for a long trade)
Here’s an example:
Next…
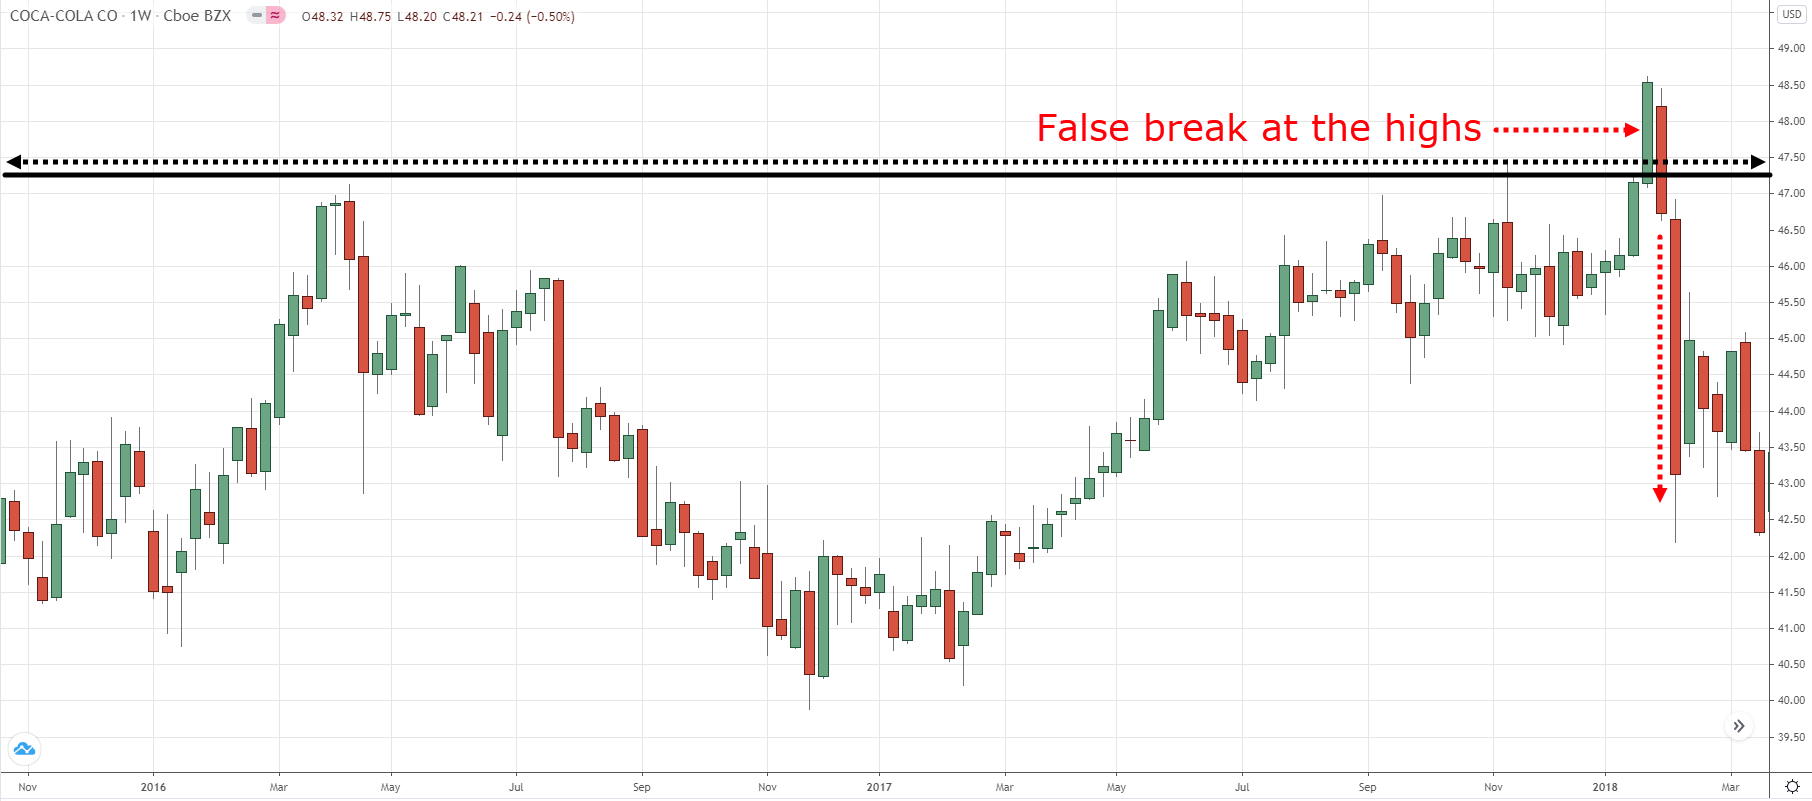
False break
The false break is a reversal price action pattern which allows you to buy low and sell high.
Here’s how it works…
- Look for a strong bullish momentum into resistance (the bigger the candles, the better)
- Let the price take out the extreme highs of resistance (so that more traders will buy the breakout)
- Wait for the false break pattern where the price makes a sudden reversal and closes below resistance
- Go short on the next candle’s open
(And vice versa for a long trade)
Here’s an example:
Does it make sense?
Great!
Then let’s move on…
#4: Stop loss
At this point:
We’ve covered your trading setup which includes market structure, area of value, and entry trigger.
But here’s the thing:
The best trading setup could still result in a loser. That’s why it’s matter to know when to get out of your trade before things get worst.
And that’s the purpose of your stop loss, to protect your trading account so you don’t lose everything on one trade.
So now the question is:
Where do you put your stop loss?
Simple.
Your stop loss should be at a level where if reached, will invalidate (or “destroy”) your trading setup.
Let me explain…
If you buy at support, expecting buying pressure to step in and push the price higher, then your stop loss should go below support.
After all, if the price breaks below support, then it means your original hypothesis is wrong and you should get out of the trade.
So now the question is, do you place your stop loss smack under support or give it some buffer?
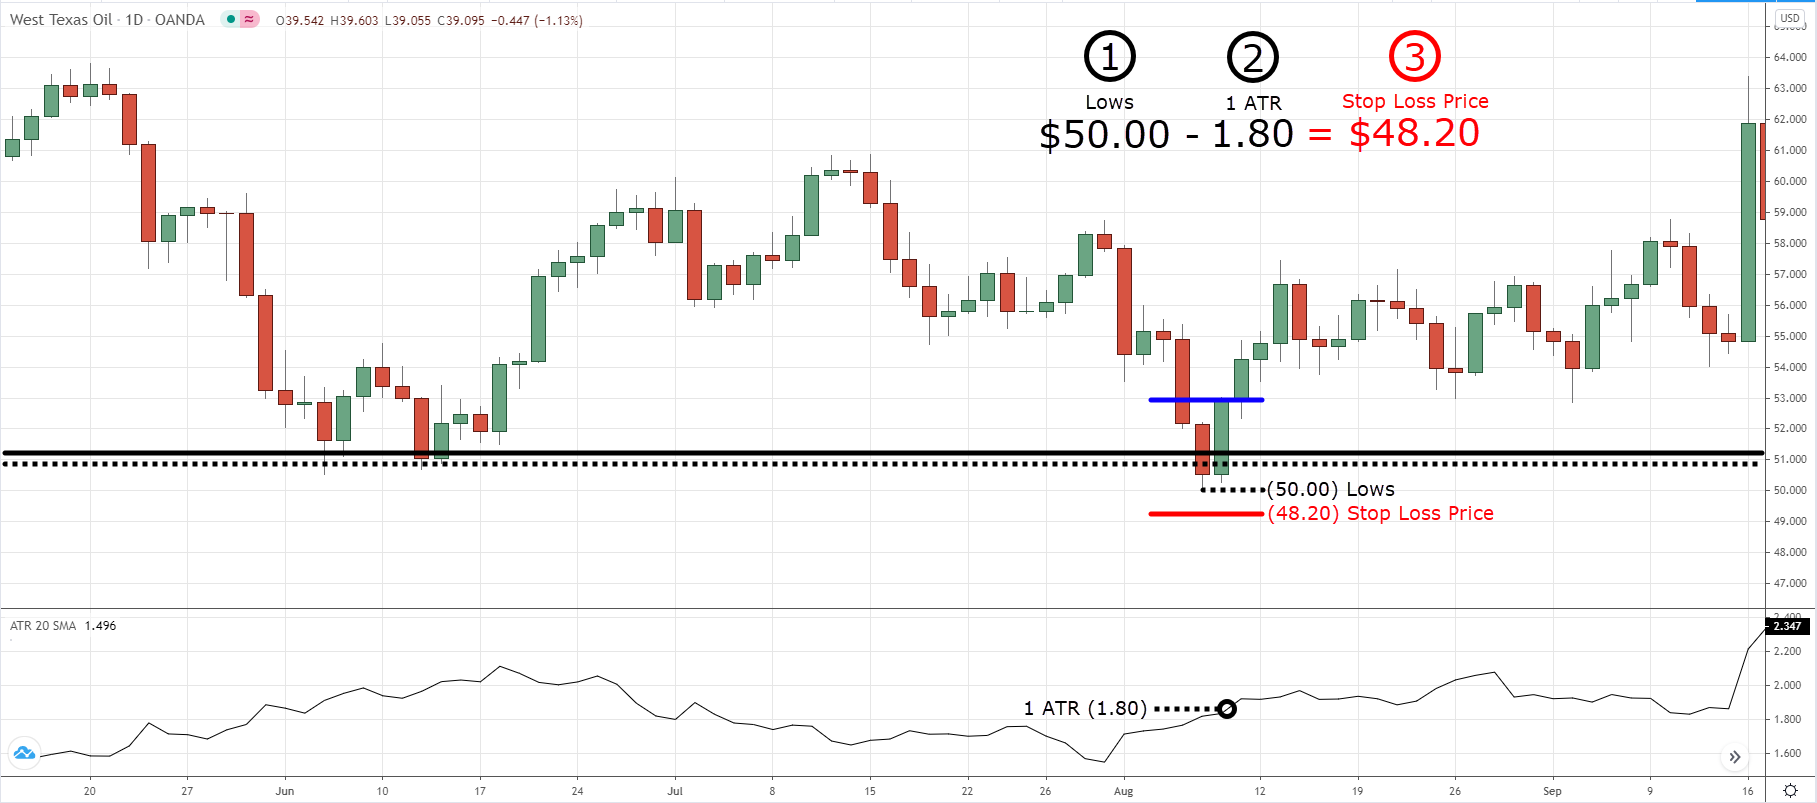
My preference is to give it a buffer of 1 ATR below support to prevent stop hunting.
Here’s how to do it:
- Identify the lowest low at support
- Identify the current ATR value
- Take the lowest price point of support and subtract by the current ATR value—that’s your stop loss
Here’s what I mean:
Now, you can apply this concept not just to support & resistance but to any form of area of value.
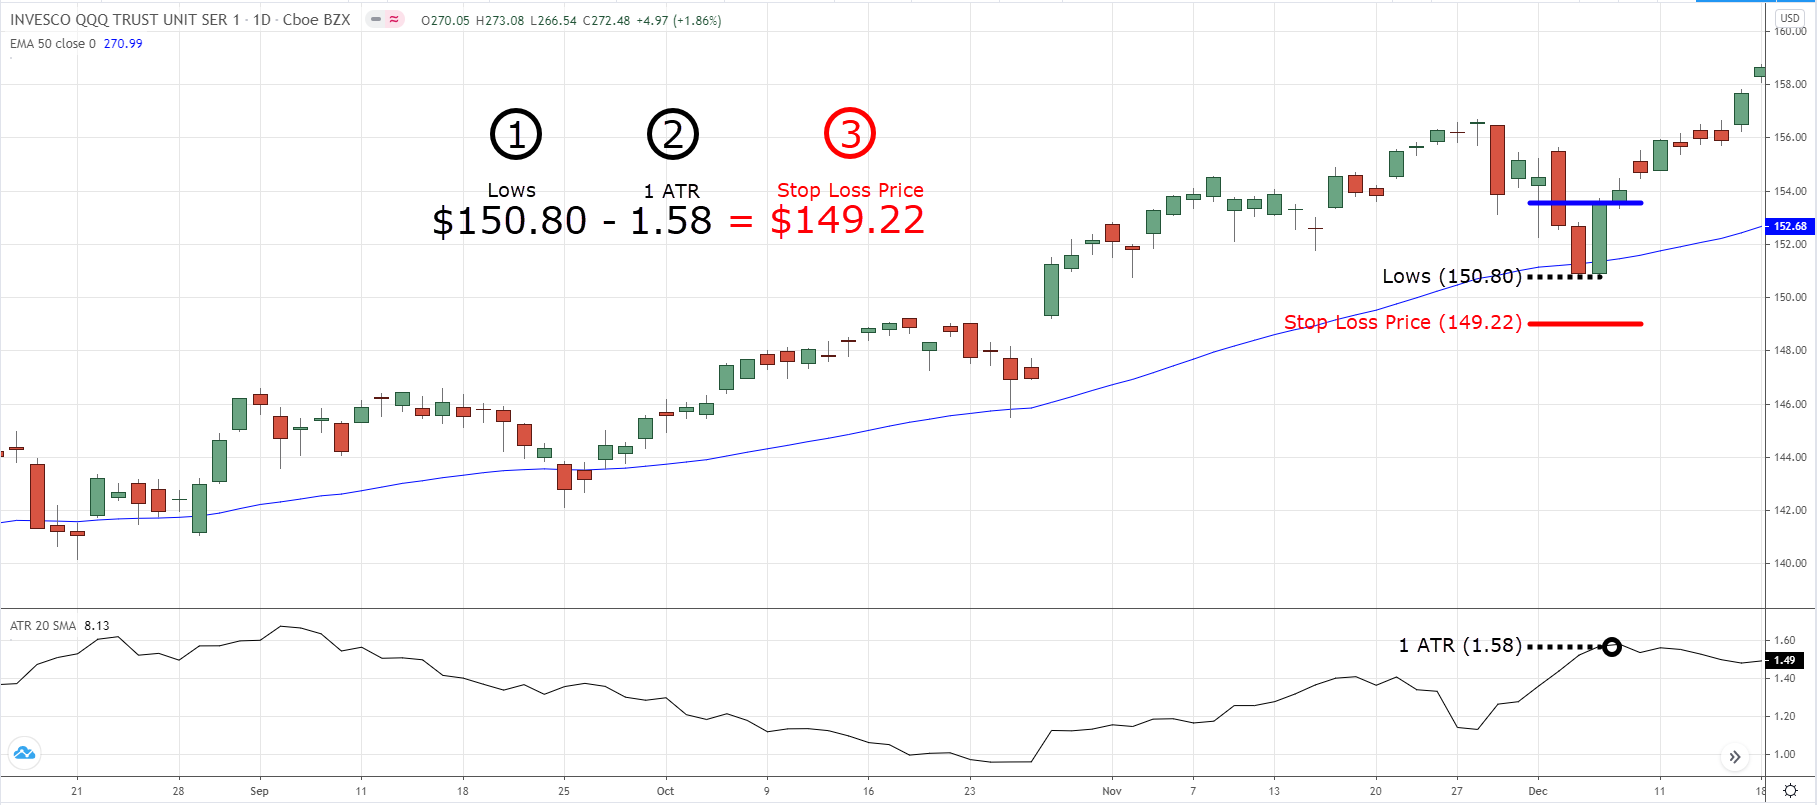
Here’s a moving average example…
If you buy near a moving average, expecting buying pressure to step in, then your stop loss should be below the moving average.
Because if the price breaks below it, it means the moving average is no longer “respected” and your trading setup is invalidated.
Here’s what I mean…
Clear?
Onward…
#5: Higher timeframe market structure
At this point:
We’ve covered your trading setup which includes your entry and stop loss.
Next, let’s talk about the higher timeframe market structure.
Why?
Because it gives you an idea to whether you should hold your winners longer, or just capture one swing in the markets.
Trading against the higher timeframe trend
Let’s say you went short on the 4-hour timeframe and you’re sitting on profits.
However, on the daily timeframe, the market is in an uptrend.
So, what should you do?
- Hold onto your short trade with the hopes the market continues in your favour
- Exit your short trade at the nearest swing low as the market might reverse against you
Now, there’s no right or wrong here.
But for me, I’d want to exit my trade at the nearest swing low as the market could reverse higher and continue its uptrend (on the daily timeframe).
Now, let’s flip the scenario around…
Trading in the direction of the higher timeframe trend
Let’s say you went long on the 4-hour timeframe and the market quickly moves in your favour.
At the same time, the daily timeframe is also in an uptrend.
So, what do you do?
- Hold your long trade with the hopes the market continues in your favour
- Exit your trade at the nearest swing high as the market might reverse against you
In this case, I’d want to continue holding my long trade as the higher timeframe is also working in my favour.
Now when I say “continue holding”, I don’t mean buy and hold forever. Instead, it’s to trail my stop loss so I could ride the trend if the market continues in my direction.
Low volatility on the higher timeframe
Here’s the thing:
The market moves in volatility cycle—from a low period of volatility to high volatility, and vice versa.
This means if the market is in a low volatility environment, it’s a sign the market is about to make a big move (and you want to be prepared for it).
Here’s an example…
Let’s say you went long on the 4-hour timeframe and the market quickly moves in your favour.
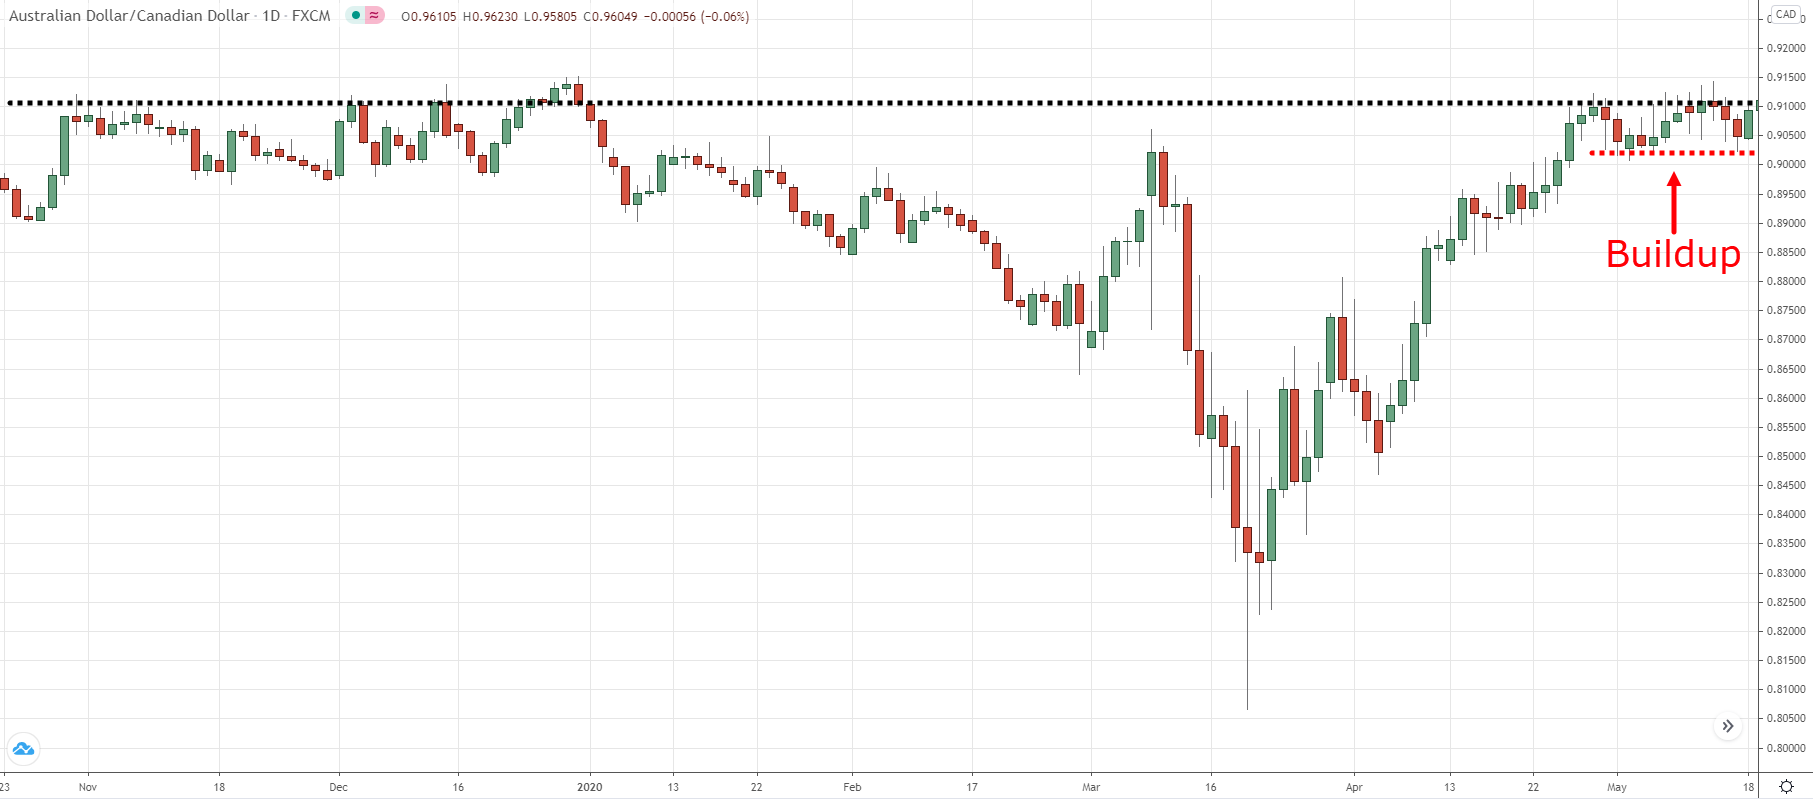
Also, you noticed the daily timeframe has formed a buildup, a low volatility price pattern which looks like a “squeeze”.
So, what do you do?
- Hold your trade with the hopes that if volatility expands, it does so in your favour
- Exit your trade at the nearest swing high as the market might reverse against you
- I don’t know
For me, I’d hold my trade because there’s a huge profit potential if volatility expands in my favour.
Here’s an example…
AUD/CAD buildup on the daily timeframe:
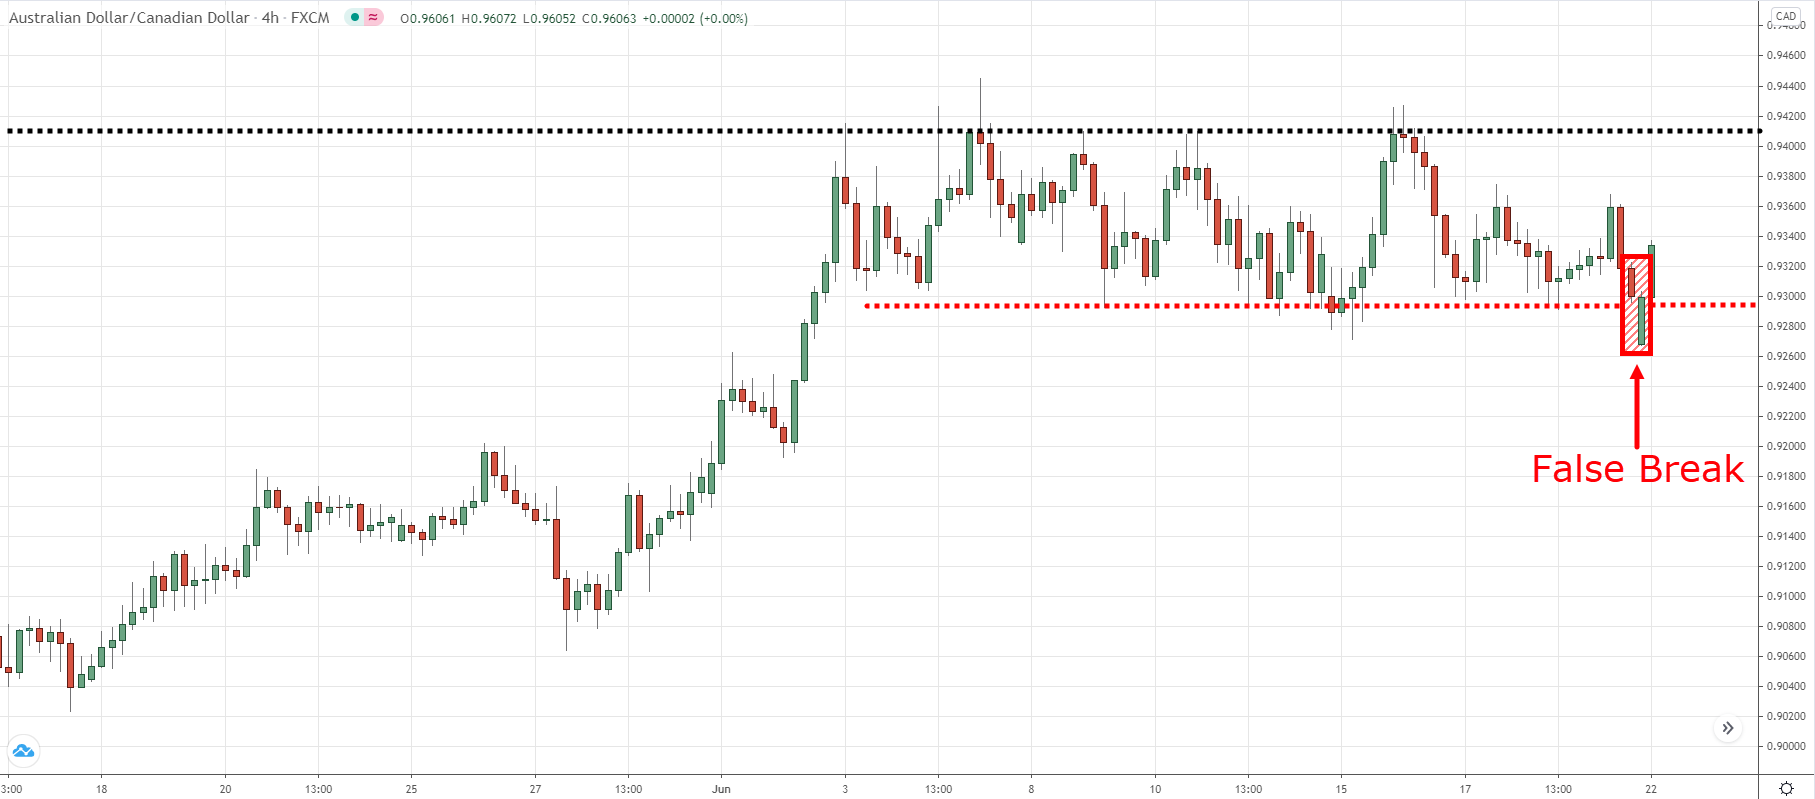
AUD/CAD false break on the 4-hour timeframe:
As you can see…
There’s a false break setup on the 4-hour timeframe, after which, the price moved in your favour.
At this point, you might want to take profits at the nearest swing high as potential selling pressure could be lurking there—which I agree.
Still, looking at the daily timeframe, you’d realize the market has formed a buildup (as volatility has contracted)—which is a sign a big move could occur soon.
So, how do you balance between the two?
For me, I’d like to take 50% of my profits at the nearest swing high. So, if the market does reverse from it, at least I’ve got something in the bank.
Next, I’d hold the remaining of my position and see if the price could break out of the swing high. If it does, I will ride the trend until my trailing stop loss is hit.
Conclusion
So here’s what you’ve learned:
- Market structure tells you what to do—whether to buy, sell, or stay out of the markets
- Area of value helps you determine where to buy or sell (things like support & resistance, moving average, etc.)
- Entry trigger tells you when exactly to buy or sell using a specific price pattern (things like price rejection, candlestick patterns, etc.)
- Your stop loss should be at a level where if reached will invalidate your trading setup (or when your area of value is “destroyed”)
- The higher timeframe trend helps you decide whether to capture a swing or ride a trend. Look to capture a swing if you’re against it, and ride a trend if you’re with it
- If the higher timeframe is in a low volatility environment, then hold a portion of your position as you could catch a big move if volatility expands in your favour
Now here’s what I’d like to know…
What are some of the things you look for as a price action trader?
Leave a comment below and share your thoughts with me.


A very awesome and complete article Rayner, worth reading again!
Awesome to hear that, Jet!
Its not boring at all.. u sure and it’s worth reading it again..
Very good concert, what will it take me to get the Price Action Trading Secret Book?
Hey Ekong,
Simply follow the link.
https://priceactiontradingsecrets.com/
thank you very much
These messages is very educative and I have learned a lot from it
Glad to hear that, Sakaria!
You are my GURU…You are my MENTOR….I am always learning great things from u…..You are the best…..
Thank you, Rajesh!
Your write up is always an eye opener. Thank you for your effort and God bless us
Thank you, Bolaji!
very informative. You are the real deal forex trader my friend. You are unique. You don’t sell useless courses. Thanks, You are my No.1 mentor.
Thank you, Samuel!
I just started watching videos about trading and price action for options trading. that you for sharing your insights. Tochukwu and Teo
Excellent
Hi Rayner,
You are my MENTOR…Thank you for always sharing valuable contents…I tried many times to order “Price Action Trading secrets” book from India but every time payment failed. Could you please available it on amazon/in so people from India can buy it easily…my email id: atul.apc@gmail.com
Thank you, Atul!
The books are only available through TradingwithRayner website.
Cheers
Ur information is really a spark in dark pathway of my trading
Excellent article. Very educative and informative guide.
Thank you, Shyam!
Oh god it it was super grt ..love from india …I understood every thng so easily …
Awesome, Naveen!
Thanks to the one I never see but learned a lot from you,you’re my mentor and teacher at the same time
Glad to hear that. Sadik!
Great trading lesson learned.
Thanks a lot.
You are welcome, Abdul!
First I’d look for the market structure that gives me a direction to go about then Identify my aov, let the price come to me. A valid entry trigger.
Rayner I have a question, how do I tell when a trend is about to end and not get caught off
Hey Victory,
Check out this post.
https://youtu.be/R01q–5M4SA
Cheers.
Thanks for the good work
You are welcome. Asifat!
Somehow this makes things so clear…now to test it out….(the good bit)
Glad to hear that, Murray!
Your blog is awesome:) You simplify complicated stuff and teaching style is supreb
We’re glad to help, Kruthika!
We also have trading courses that you may access for free. You can check this out:
https://www.tradingwithrayner.com/academy/
Cheers!
Very useful and valuable..
Glad you find our materials useful, Jay!
Highly informative article Mr Rayner. Great job ! Thanks.
No worries, Manisha!
Great trading lesson!! Thanks Rayner.
You are most welcome, Mahbub!
Since i started following your pages,my trading has improved so much your teaching makes things simple and easy to understand please keep on keeping on,Mr Rayner you are the best.
That is good to hear, Muponda!
We are glad to know your trading has improved so much! Keep on learning.
Cheers!
thank you so much for the article
No worries, Thirupathi Salveru!
Great
Thanks, Abednego!
You are a God sent man. You dish out the stuff that will help traders unlike others who will hide theirs for monetary reasons. Thank you very much. You will be remembered for life.
Thank you for your kind words, Isaac!
We wish you the best!
Cheers!
Thank you
You’re welcome, Joyce!
Nice one Boss
Thanks, Solomon!
Cheers!
Thanks a lot Rayner your explanation is direct and straight to the point
You are most welcome, Mothibi!
Excellent explanation sir, thank you detailed explanation about price action. Please refer some books
Here’s the best trading books of all time:
https://www.tradingwithrayner.com/best-trading-books-of-all-time/
A good lesson to trade with confidence. Thank you Rayner.
Yes, Habib!
You are most welcome!
Very useful, helpful comprehensive article. Thank you Reyner for sharing it with us.
Anytime, Shiromala!
I trade gold, so what I do look for is wait for a pull back to my area of value, resistance, support then a candle still pattern before entry
Thank you for sharing, Favour!
I think you have exploited all of them.
Thank you
You are most welcome, Tindyebwa!
Does this strategy work for crypto trading?
Thank you Rayner Teo!
Yes, you can try it on Crypto, too!
Cheers!