I want to introduce you to a formula called the M.A.E.E formula.
Let’s get started and unpack the MAEE trading formula.
M – Market structure
Let’s start with the first part of MAEE trading formula.
Generally, when you trade the markets, it can be broken down into three main categories:
- Uptrend
- Downtrend
- Range
Once you’ve identified the market structure, it doesn’t mean you buy immediately.
Let’s say the market is in an uptrend at this point, do you want to buy at this point? Not quite.
You don’t want to buy just because the market is in an uptrend.
You don’t want to sell over here just because the market is in a downtrend.
Why is that?
Because you want to look for an area of value.
A – Area of value
You want to be trading from an area of value. An area of value can be in the form of a moving average or trendline.
Let’s talk about an uptrend.
Support and resistance
A few possible areas of value could be this one over here where the price retests previous resistance now turned support. That’s one possibility of an area of value.
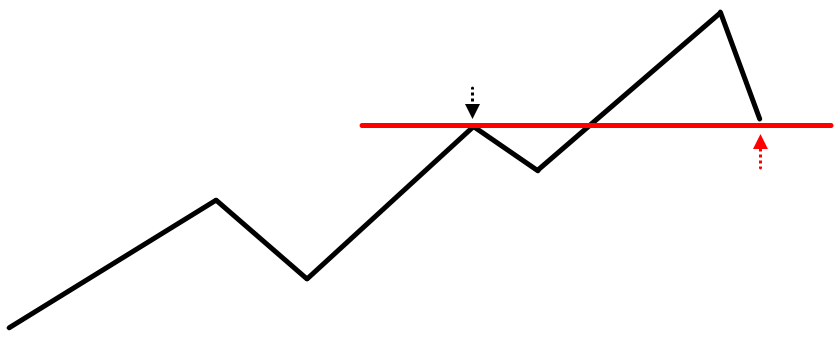
Alternatively, the price can also retest previous swing lows or previous support:

The uptrend market does a slight consolidation and retest this previous area of support, this is another area of value.
An example on GBP/JPY to find an area of value (MAEE trading formula):
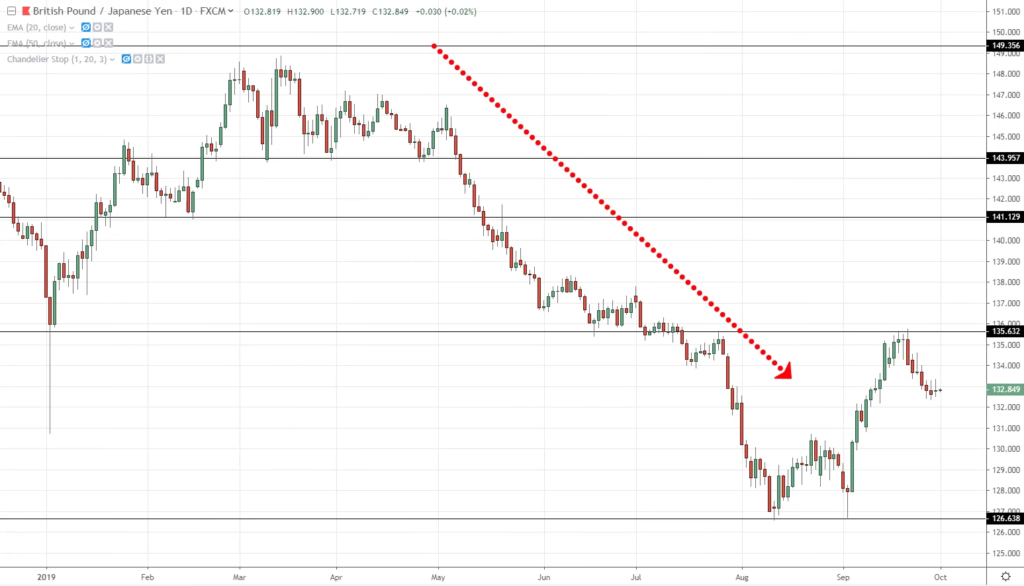
The market is in a downtrend, where is an area of value such as support and resistance?
It’s over here:
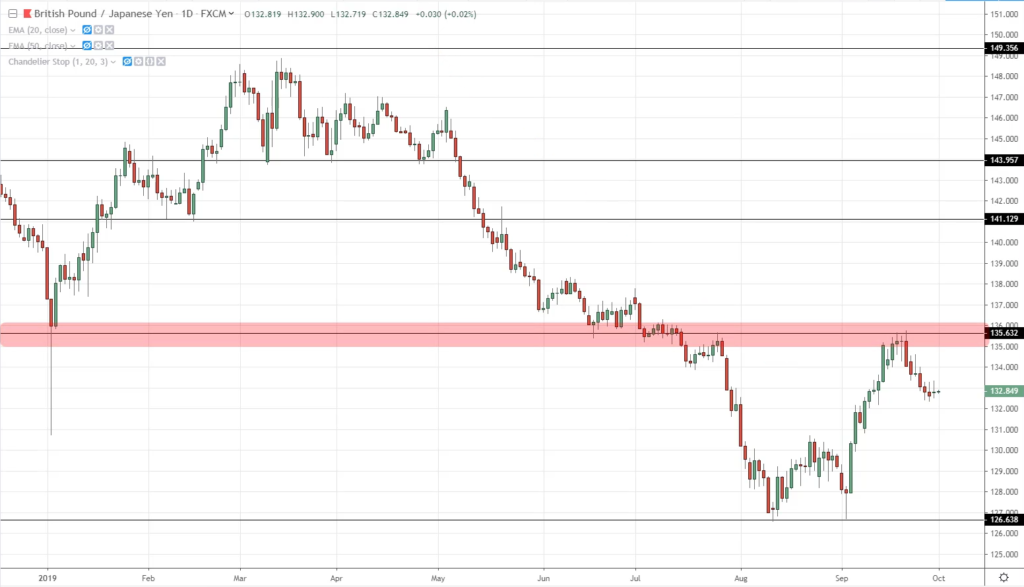
Previous support becomes resistance.
Remember that it’s an area of value. It’s not a line of value. So you’re dealing with an area on your chart.
There are numerous ways to define your area of value and I want you to be aware of it.
Now you have got your market structure and an area of value.
Moving average
An area of value can also be in the form of a moving average or a trendline.
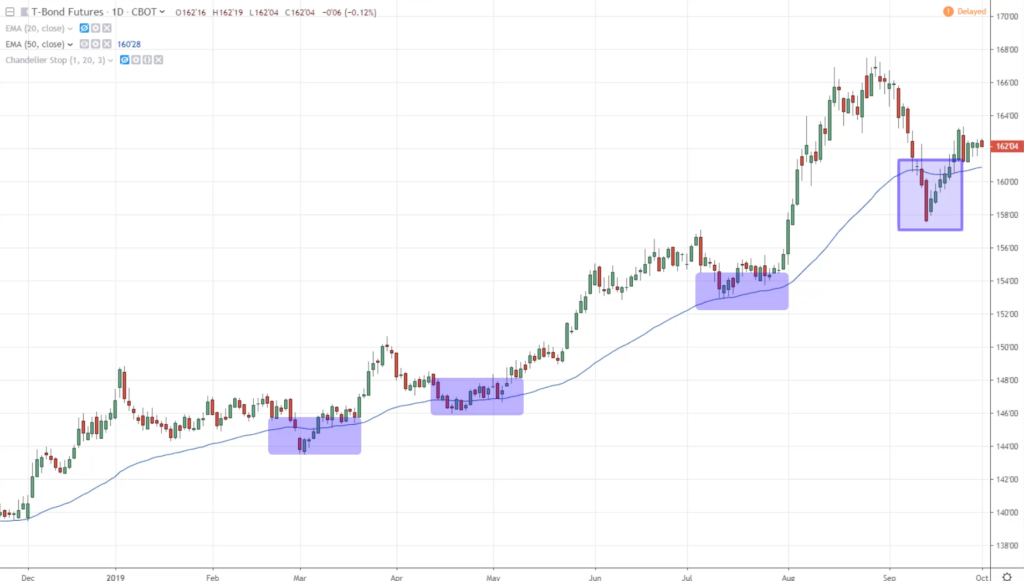
An example on T-Bond to find an area of value (MAEE trading formula):
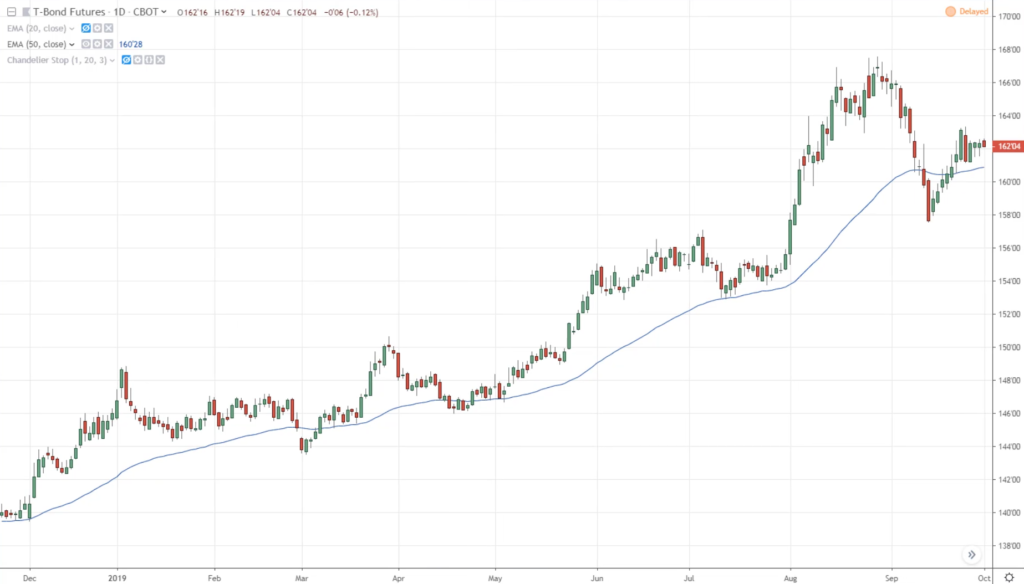
The market is in an uptrend and if you pull out the 50-period moving average, you’ll notice that the price tends to respect the moving average.
In a healthy trend, the price tends to respect the 50-period moving average.
This is where we move onto the entry trigger.
E – Entry trigger
When you trade candlestick patterns, you don’t want to just dive into candlestick patterns like the hammer, etc.
You want to look at the context of the market before you look at the candlestick patterns as an entry trigger. And this is where candlestick patterns shine because they are useful to act as an entry trigger.
An entry trigger is simply a signal to get you into a trade.
A couple of other things you want to pay attention to are:
- Bullish patterns: Hammer and bullish engulfing pattern
- Bearish pattern: Shooting star and bearish engulfing pattern
These are the patterns that you saw earlier when I talked about “Mistakes that traders make”.
Bullish patterns
Hammer

For a hammer, the price opens at this level. Then the sellers came into control and push the price down lower to these lows.
Finally, the buyers come in to push the market back up higher towards the highs and finally, the price closed near the highs of the period. This is how you get the hammer.
The story of a bullish hammer in essence is:
Sellers came in and took control, but suddenly the buyers came in and pushed the price up higher and smashed the sellers to one corner.
Bullish engulfing

It’s a similar story. You can see that on the first candle, the price open at the top and then closes near the lows of the period.
The second candle opened near the lows where the sellers tried to push the price down near these lows, but that’s as far as they could go before the buyers pushed the price up, closing near the highs.
The bullish engulfing pattern tells you that the buyers are temporarily in control.
Bearish pattern

Bearish patterns are just the opposite.
This simply tells you that the sellers are in control and what you’re seeing is price rejection of higher prices on your chart.
These are useful entry triggers to enter a trade.
E – Exits
There are many ways you can go about setting your stop losses and profit levels.
Exit when you’re wrong (stop loss)
This is basically where you set your stop loss.
I’ll share with you an approach that has worked well for me which you can verify for yourself.
When you set your stop loss, you want to set your stop loss away from the area of value. You don’t put it in an area of value. It defeats the purpose.
What is the need of trading from an area of value if your stop loss is at an area of value?
For example:

Let’s say a market is in a range. It comes down near these lows, and breaks out higher, closing above support.
When you set your stop loss, where do you set it?

You don’t want to set your stop loss at an area of value. Why?
Because we are trading from an area of value, and this is where potential buying pressure could come in and push the price up higher.
If you put your sell stop order there, you could get caught out of the trade because it is an area where potential buying pressure could come in. It’s an area on your chart and you want to give the trade room to breathe so you don’t get stopped out too early.
My approach is, I set my stop loss away from the area of value.

I use the Average True Range indicator to set my stop loss 1 ATR below the lows, a distance away from the area of value. This is how I set my stop loss.
Exit when you’re right (take profit)
There are many ways you can do this depending on your trading goals, whether you want to capture a swing or ride a trend.
Let’s focus on swing trading. Let’s say you just want to capture one swing in the market before the opposing pressure comes in.
For example:

The market is in a range and you bought near the lows over here:

Ask yourself, if you’re buying near support, where would selling pressure come in?
Chances are, selling pressure is going to come in somewhere near this area of resistance.

When you take profit, you just want to exit just before these highs and capture this portion of the move, just this one swing.

If the market swings up higher, you’ll exit the trade by capturing this one swing over here.
This is where you exit your trade just before opposing pressure comes in.
An example on GBP/USD to apply the MAEE trading formula:
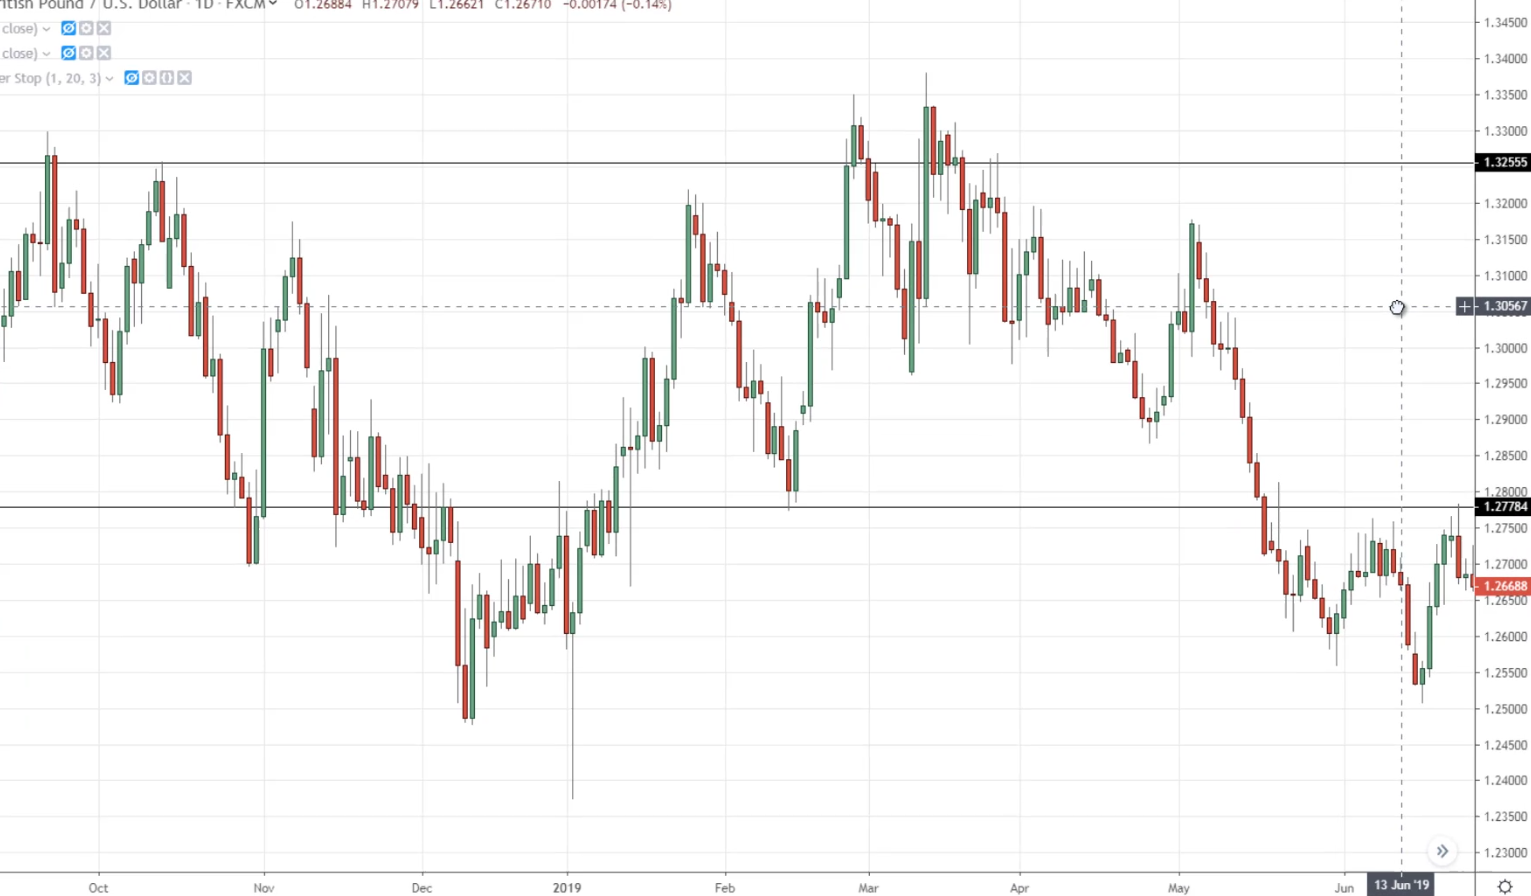
These are trades that I made and are cherry-picked to explain these examples. Take note that there will be winners and there will be losers. Trading is not a 100% thing.
M for Market structure
Firstly, what’s the trend?
The trend is down:
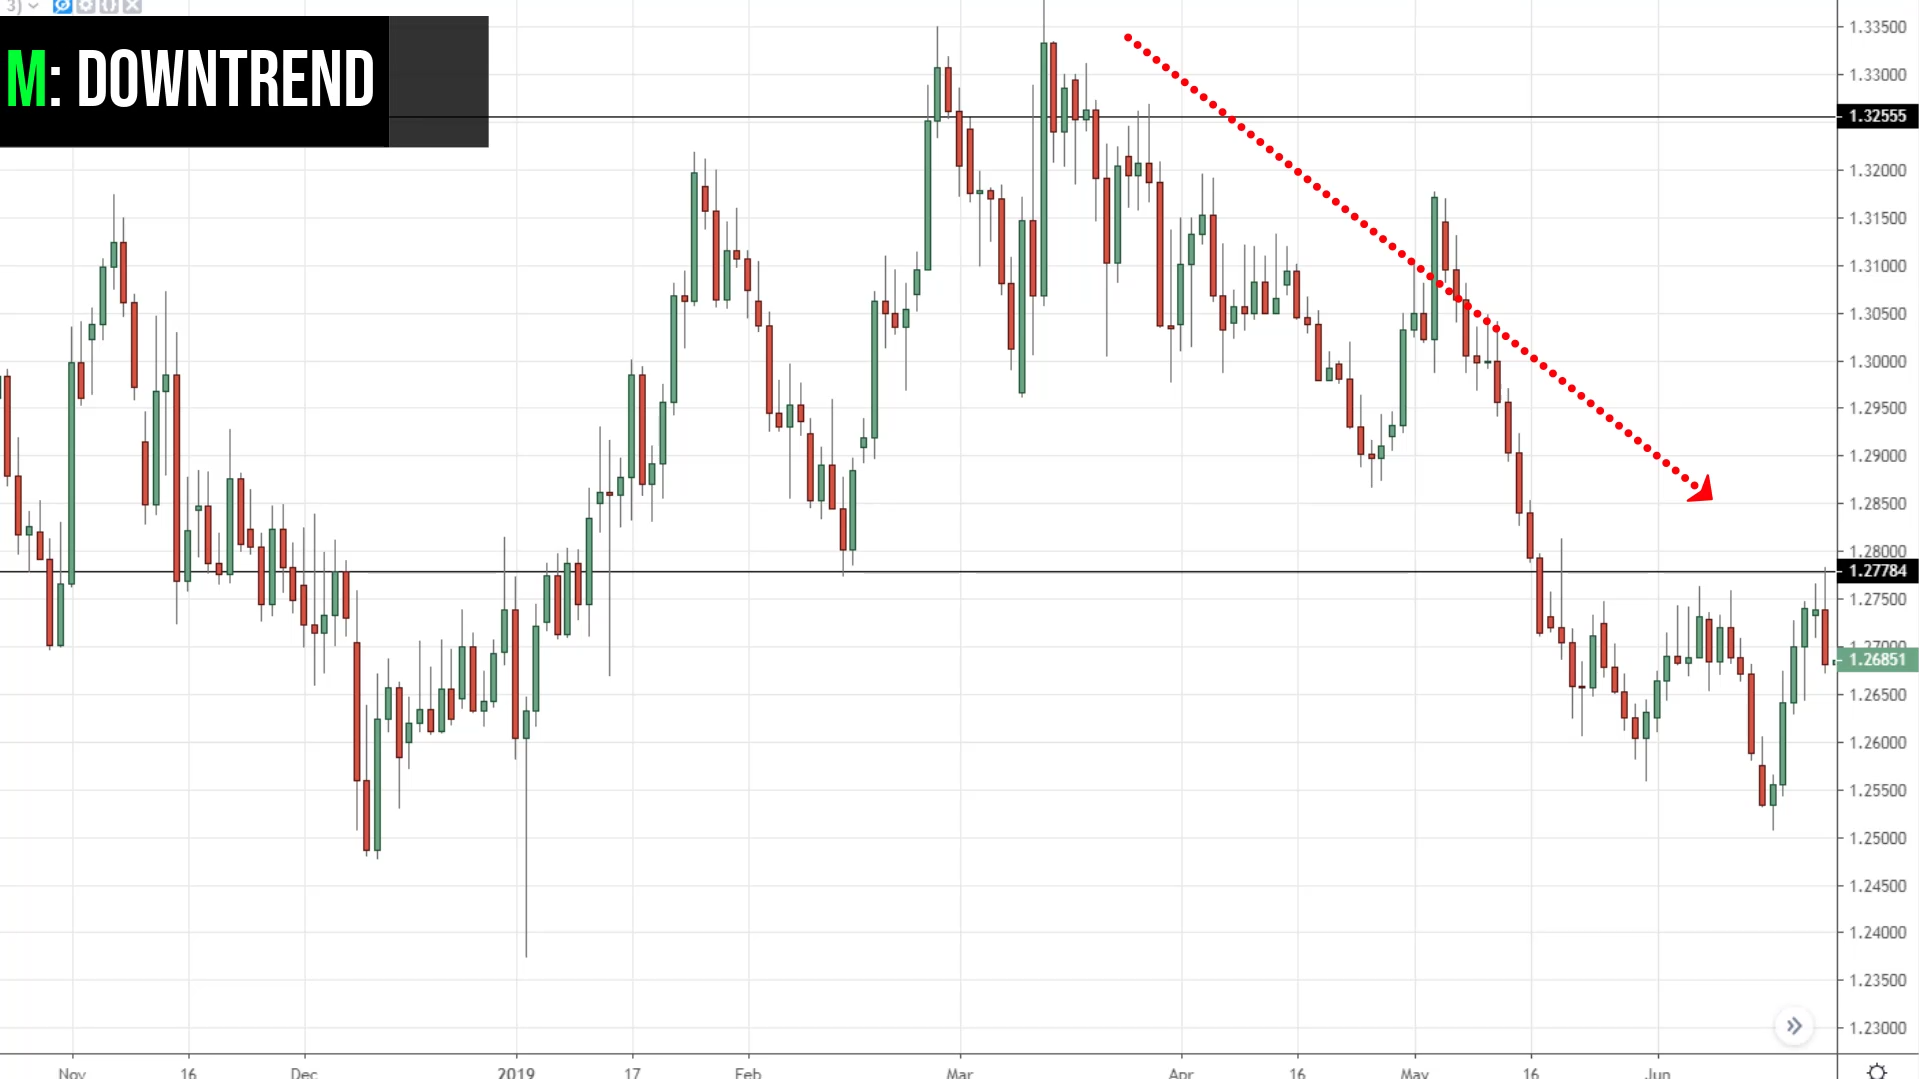
That’s the first thing, M, which stands for market structure is in a downtrend.
A for Area of value
Secondly, the area of value.
Where is the area of value?
This area of resistance is an area of value.
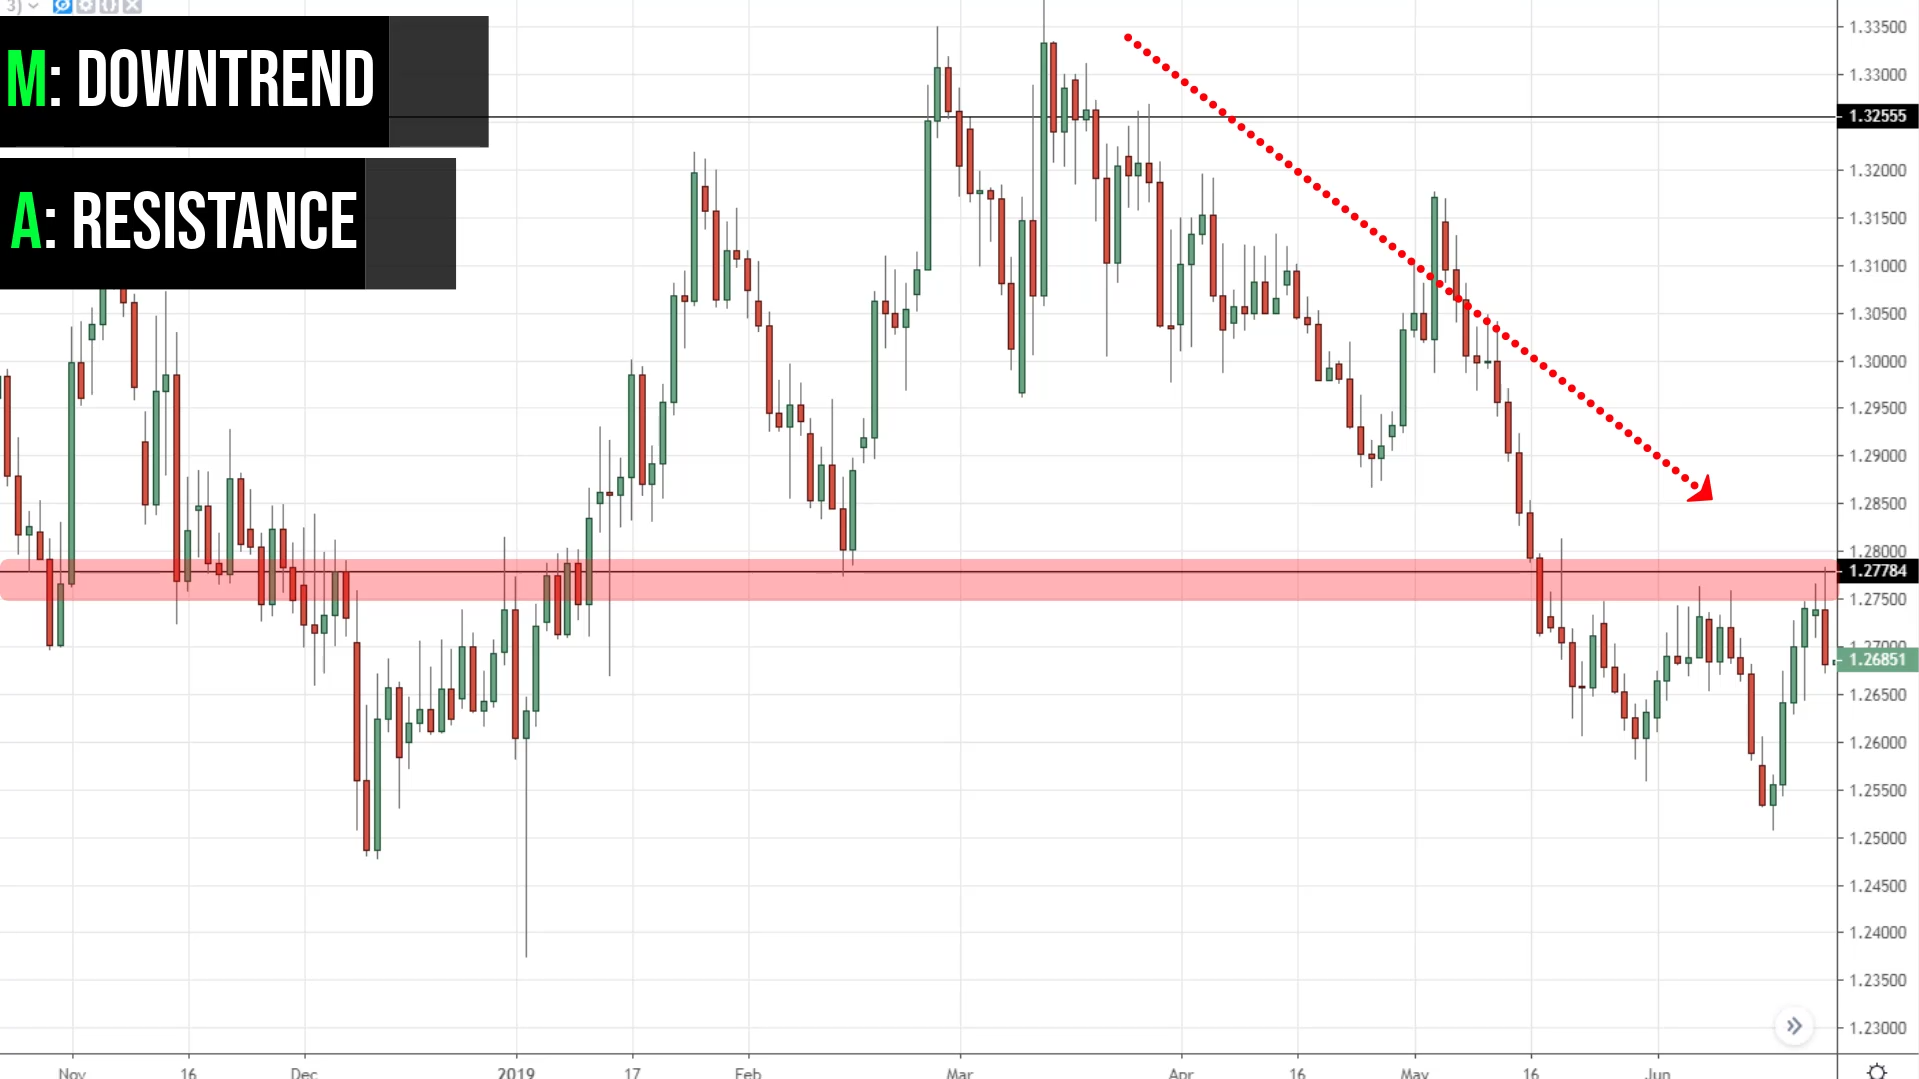
Let’s call our area of value, A. So A is resistance here.
E for Entry trigger
Is there an entry trigger?
From what I’m seeing over here, this looks like a bearish engulfing pattern telling me that the sellers are temporarily in control.
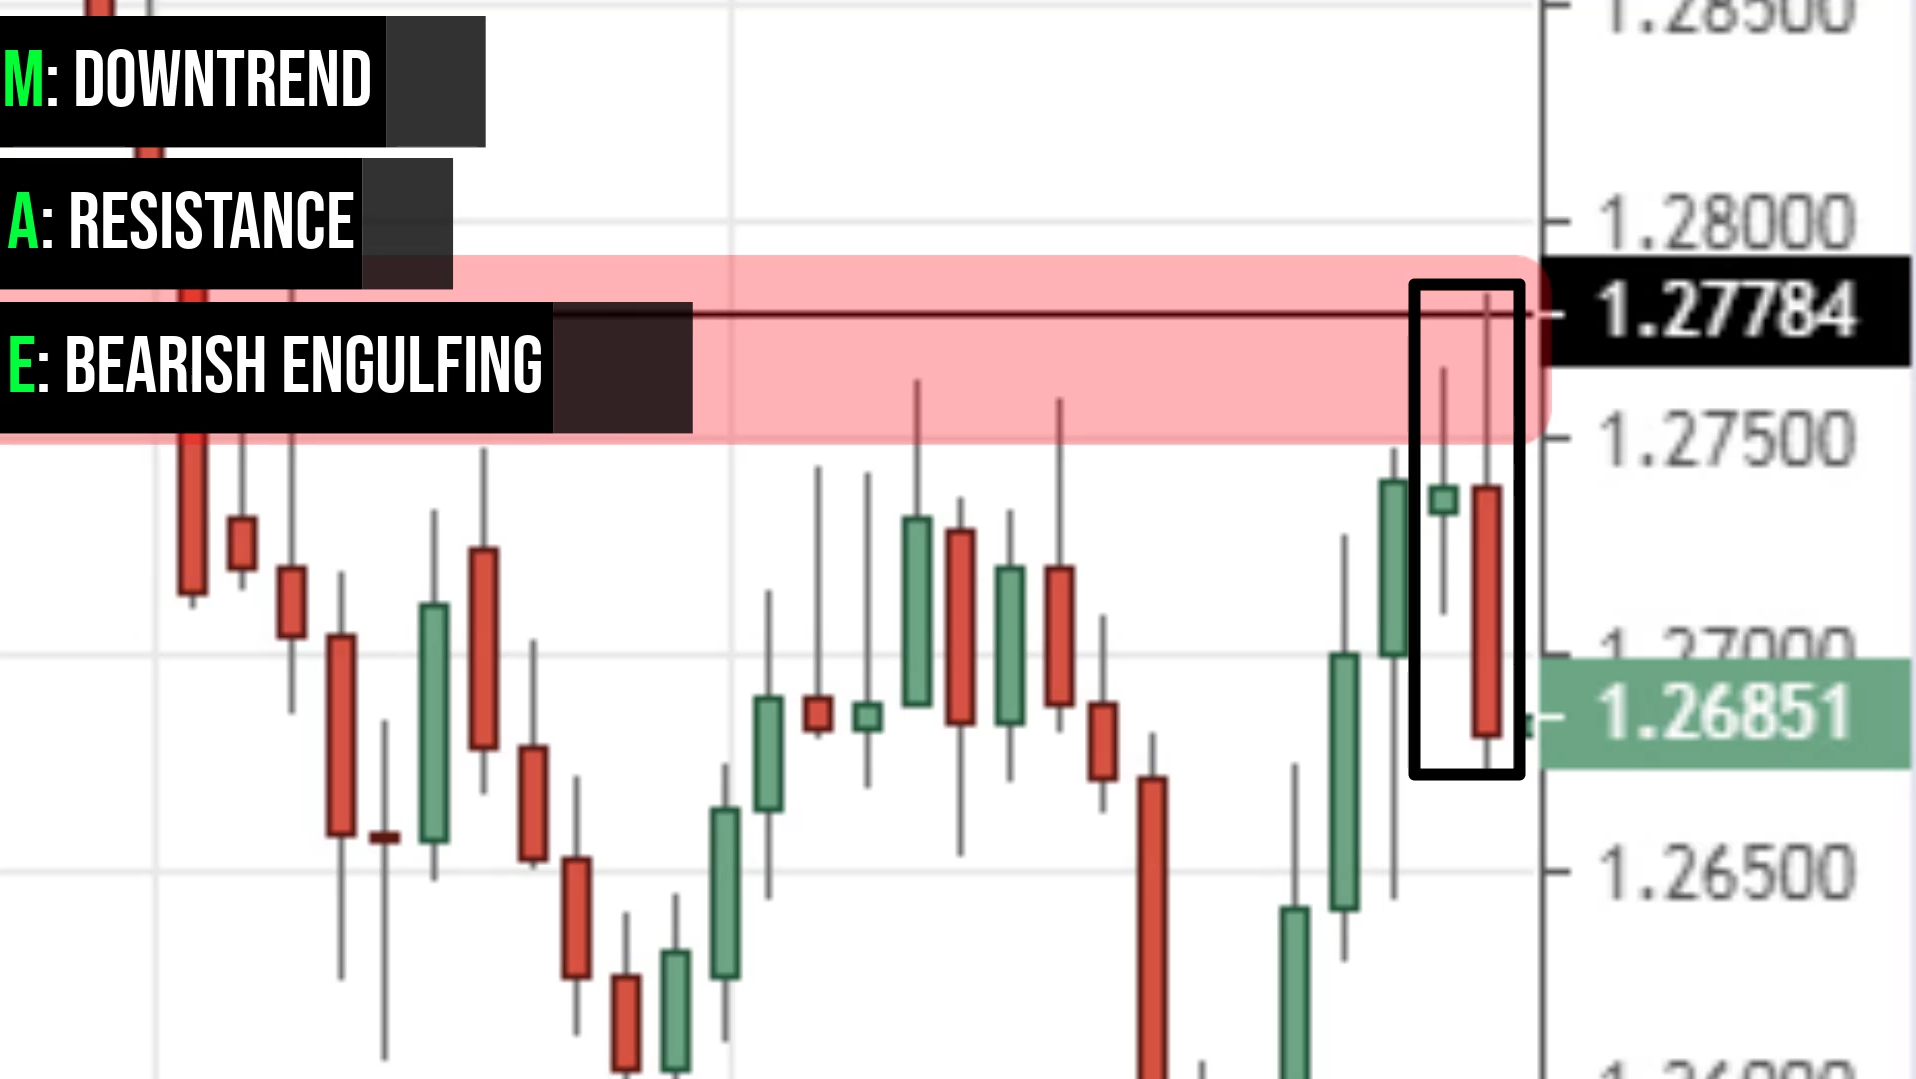
Yes, we have an entry trigger. Let’s call it E, which is bearish engulfing pattern here.
E for Exits
What about your exits?
Remember, I don’t like to set my stop loss just above the highs, because the price could just rally up higher and then collapse down lower.
If I just set it just above the highs, I would get stopped out. So I’ll just pull out the ATR indicator. I usually have a 20-period ATR.
From the chart, the ATR is about 80 pips.
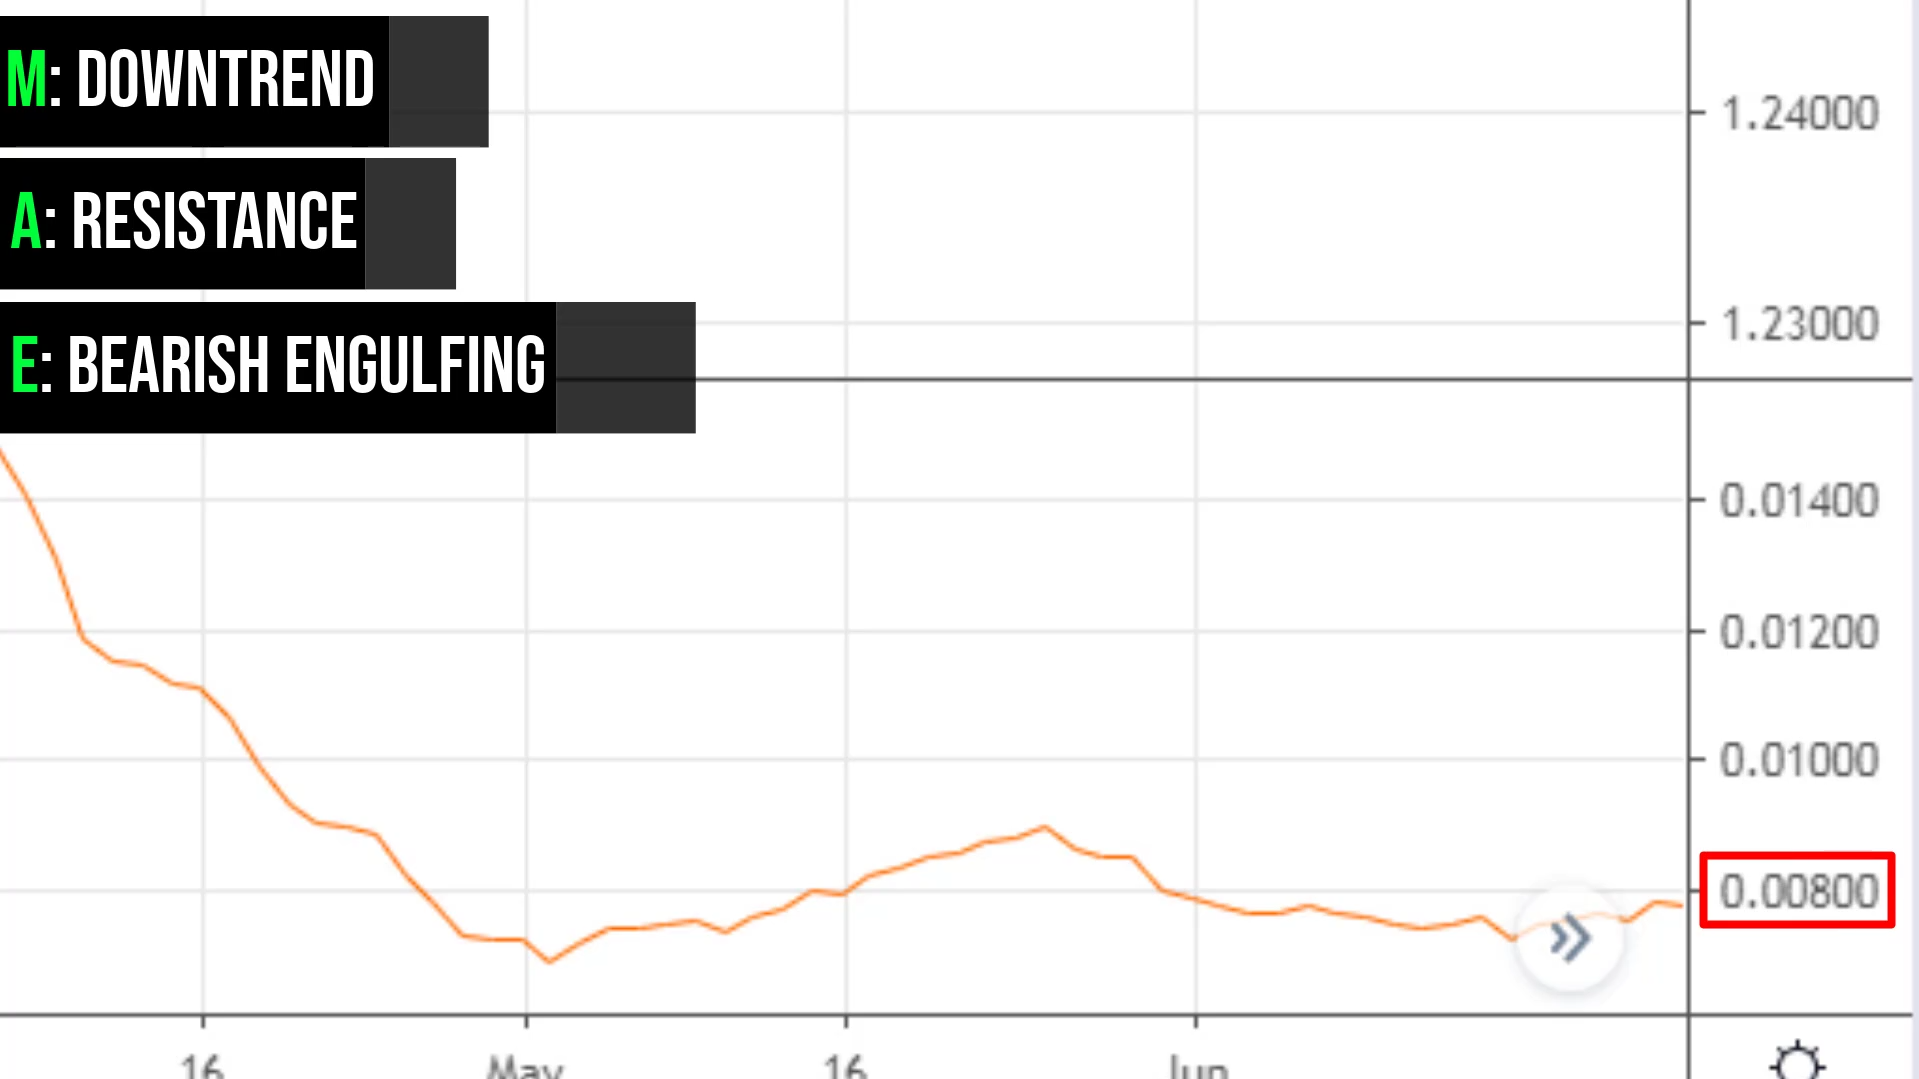
This tells you that historically, GBP/USD on the daily timeframe, over the last 20 days has moved an average of 80 pips.
What I’ll do is find the highs.
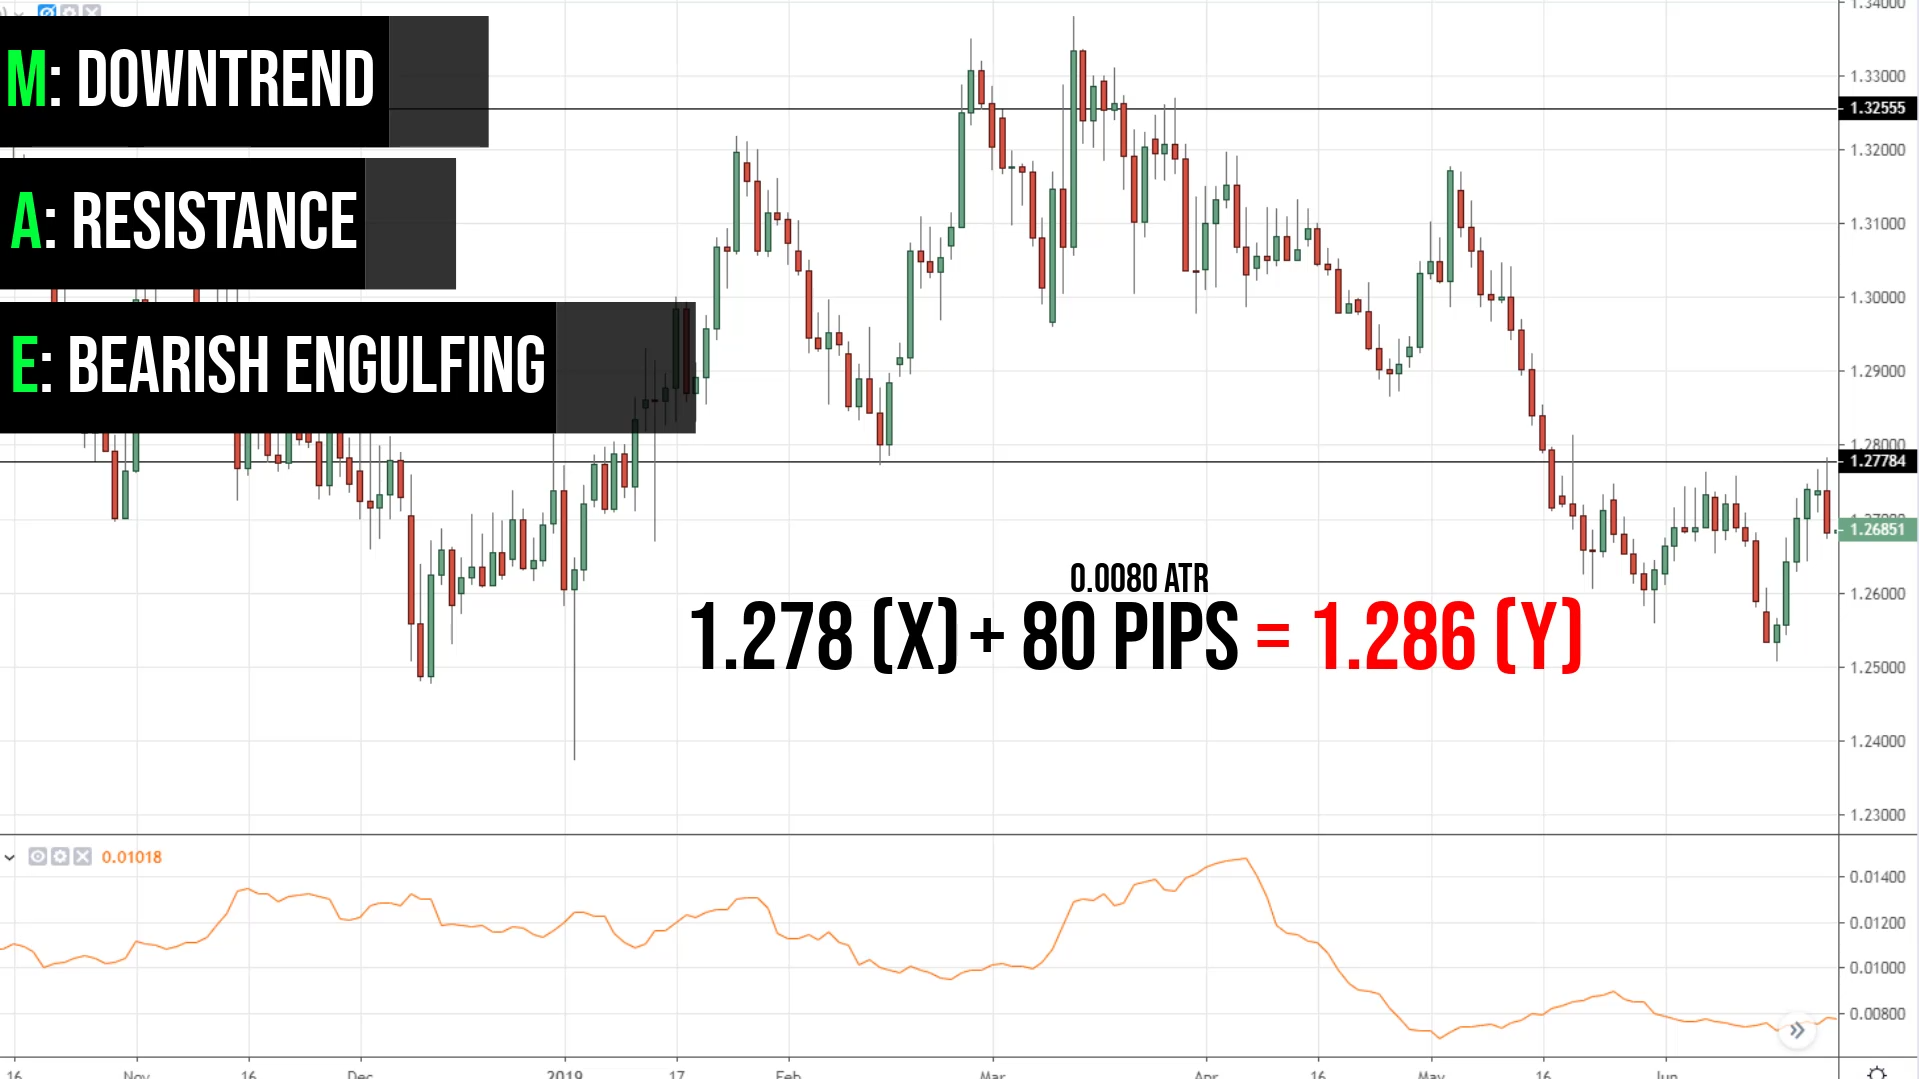
Let’s say the highs has a value X. Then I’ll add 80 pips to get Y. So my stop loss would be somewhere here at Y.
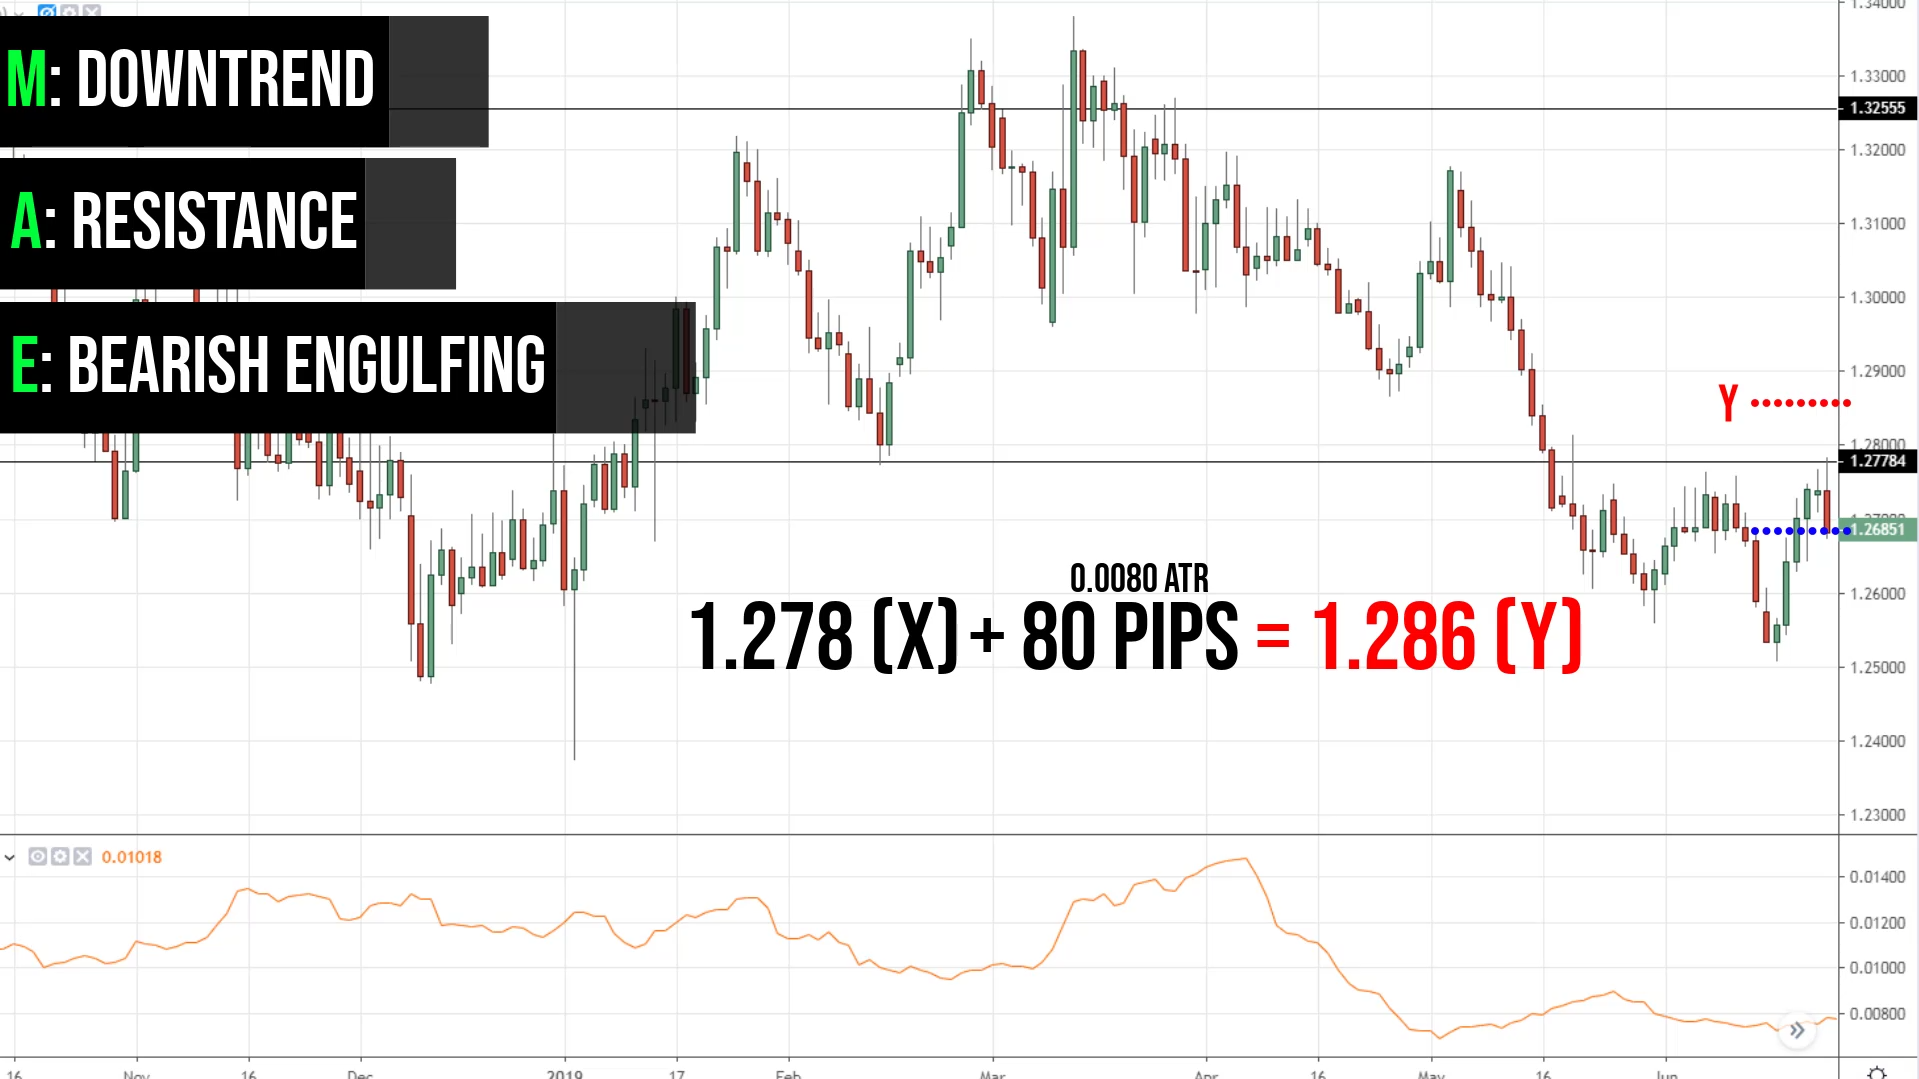
That is where I set my stop loss.
Where do I exit the trade?
If you recall, I mentioned that when it comes to exiting your winning trades, you want to exit before the opposing pressure comes in.
Where would opposing pressure come in?
I will say this swing low is a level that you want to be aware of where you know potential buying pressure could come in.
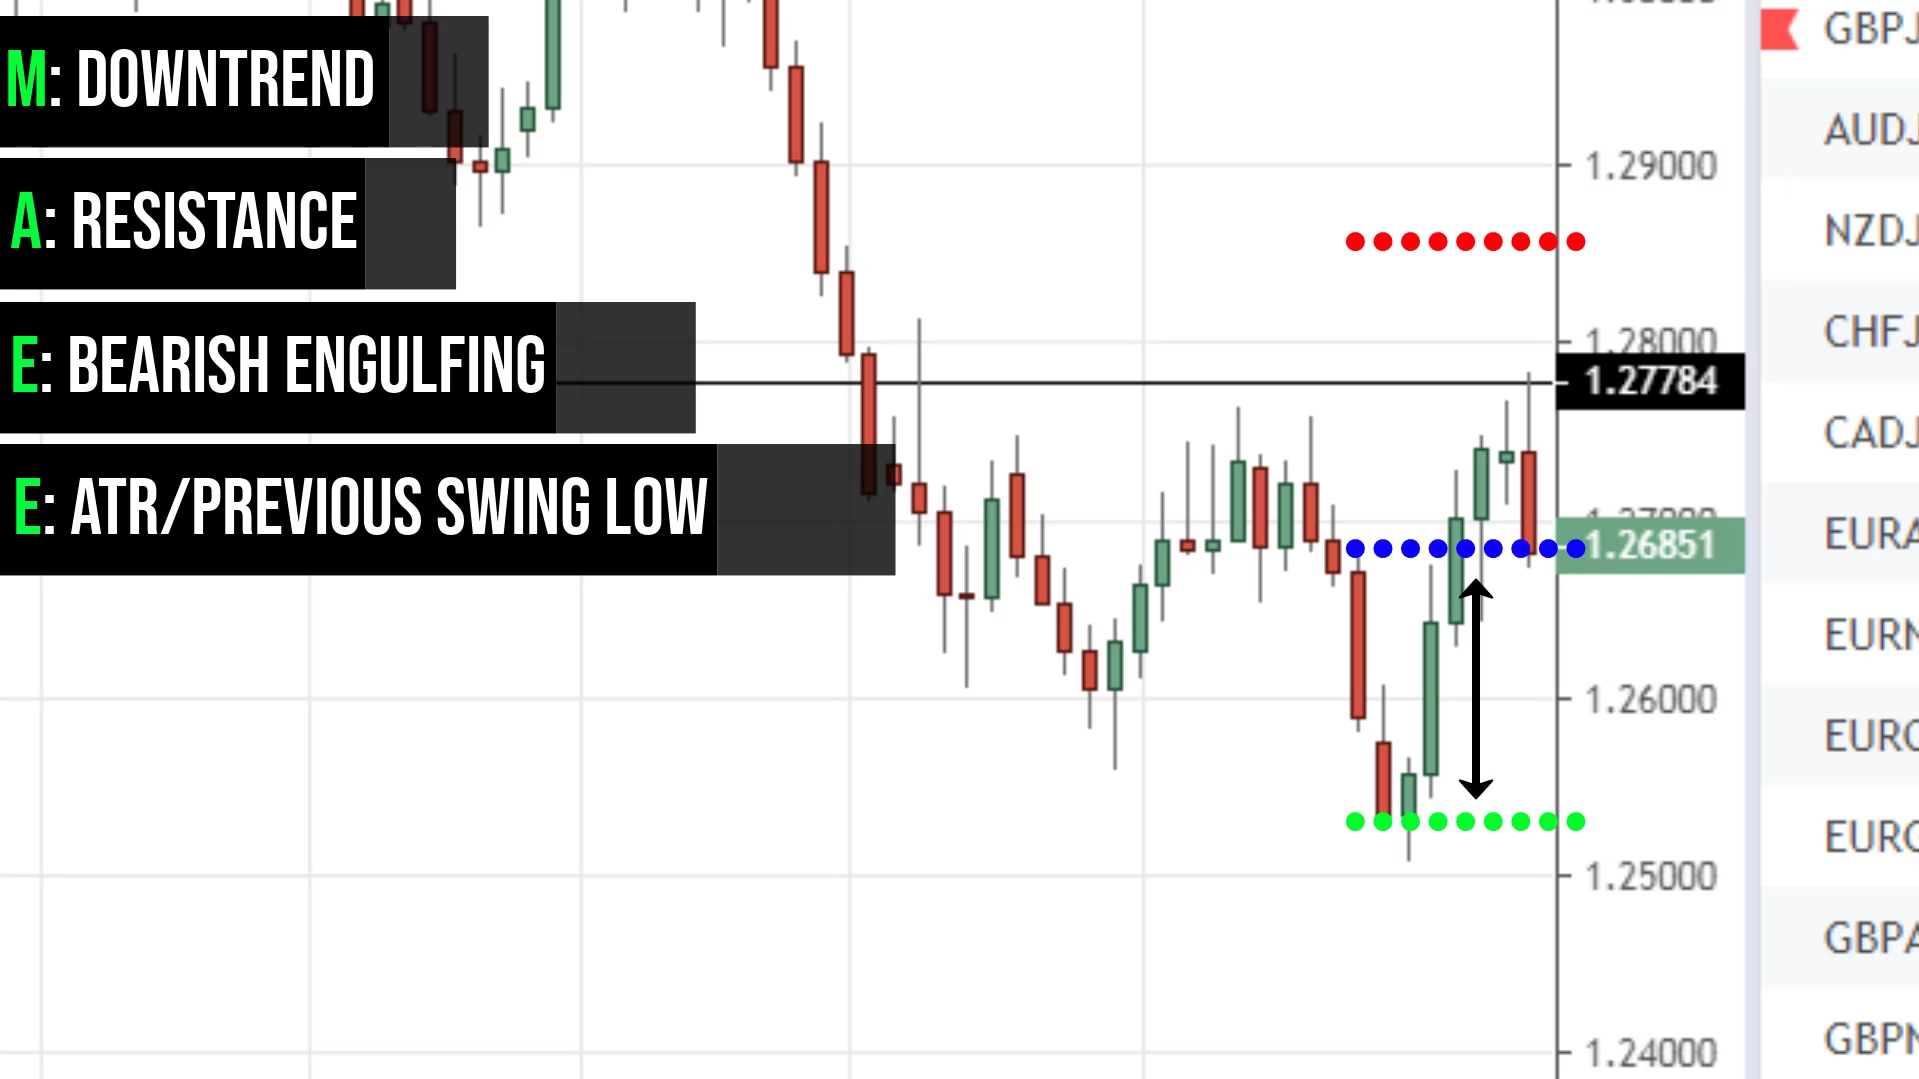
You want to be looking at this level to take your profit.
There you have it, a full example of how to use the MAEE trading formula.
Never trust anything, always verify everything. That’s the way to succeed in this business.
Because if you don’t to verify and validate a trading concept or strategy, then when the drawdown comes, you won’t have the conviction to continue trading it.
My secret sauces
1. Power move into an area of value
Whenever you trade this type of reversal, it is in essence trading price rejection at an area of value.
You want to have a power move into a level. Price comes with a strong momentum into a level with large body candles. Then you look to buy in this area of value.

What you don’t want is to see the market come down into a level, in a very choppy stair-stepping manner.
Let me just illustrate this to you.
If you’re trying to buy and you see the market comes down in this manner, lower highs and lower lows.

This is the type of price action that I don’t want to trade. Why is that?
If you recall our exits, we exit before opposing pressure comes in. If you buy in this area of value, where will opposing pressure come in?

There’s a lot of places where opposing pressure comes in.
You can see that there’s a lot of areas or levels on the chart where opposing pressure could come in and reduces your profit potential.
This is why I don’t like to trade when the market comes into an area of value in a very choppy stair-stepping manner. I don’t want to trade those reversals.
I want to look for a strong power move. In case you do not know what’s a strong power move, get this right:
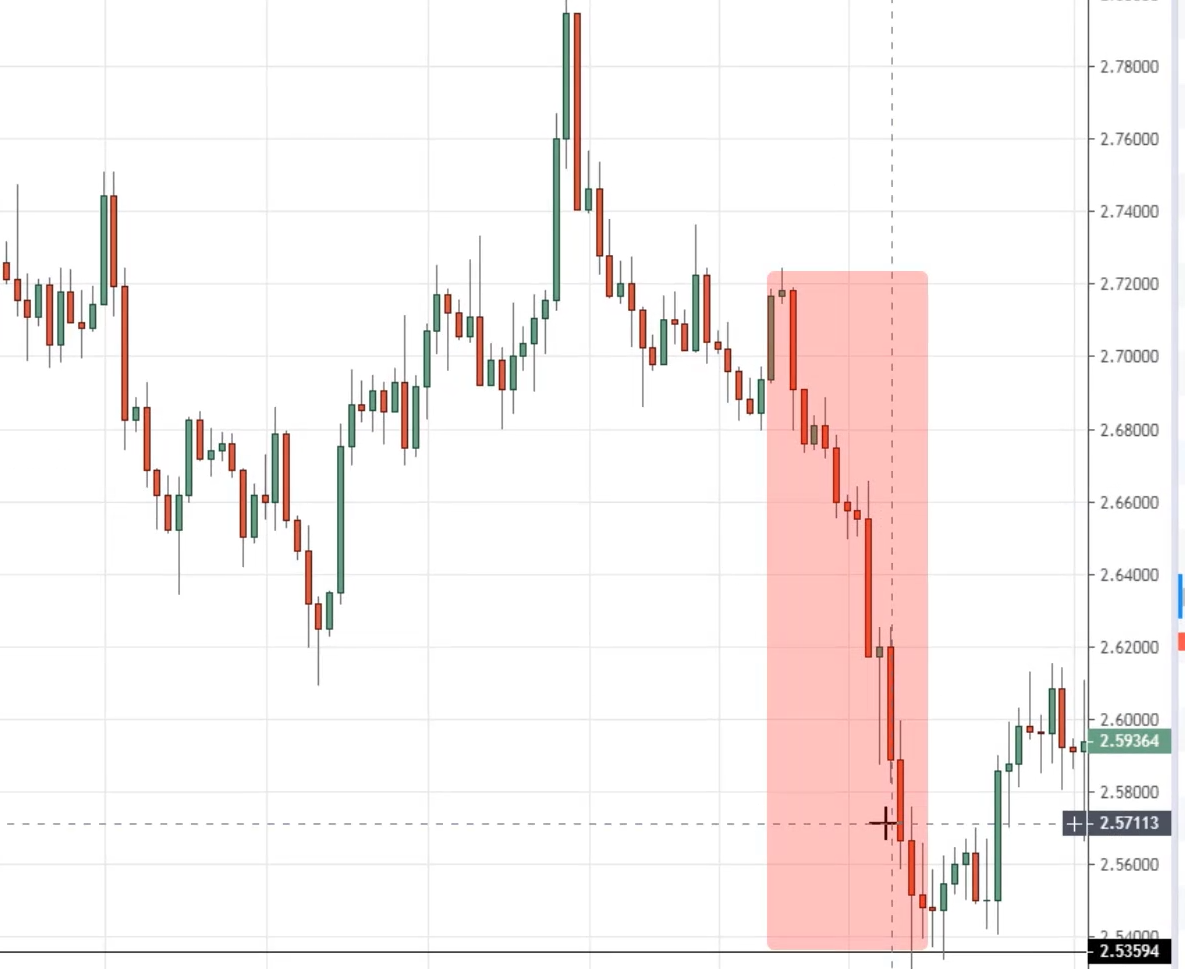
The candles are just one-colour candles and the range of the candles is large. That’s what I mean by a strong power move.
2. False breakout followed by strong price rejection
The price breaks out of a key market structure and then gets rejected strongly.
For example:

The price breaks out of resistance and it gets rejected strongly then closed back within the range.
I’ll like to see a false breakout because when price breaks out of resistance, above this high. Momentum traders will look to buy the breakout.
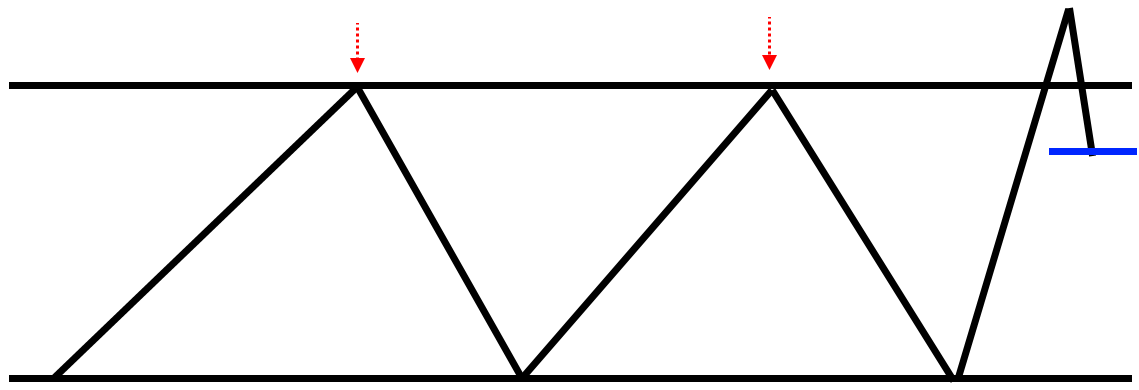
But when the price makes a sudden 180-degree reversal, this group of momentum traders, they are now trapped because they bought a breakout in the market.
Why? It’s because they bought a breakout after the price has made a power move.
That’s why I like to see a false breakout followed by strong price rejection.
3. Use a limit order
Sometimes when the price rejection is too strong, you might miss the move altogether. As a result, it’s too late to be entering the trade because the risk to reward will be bad.
What you can do is use a limit order to see if you can get filled at a better price.
Here’s what I mean by using the limit order technique.
An example from WTIOIL on the daily timeframe:
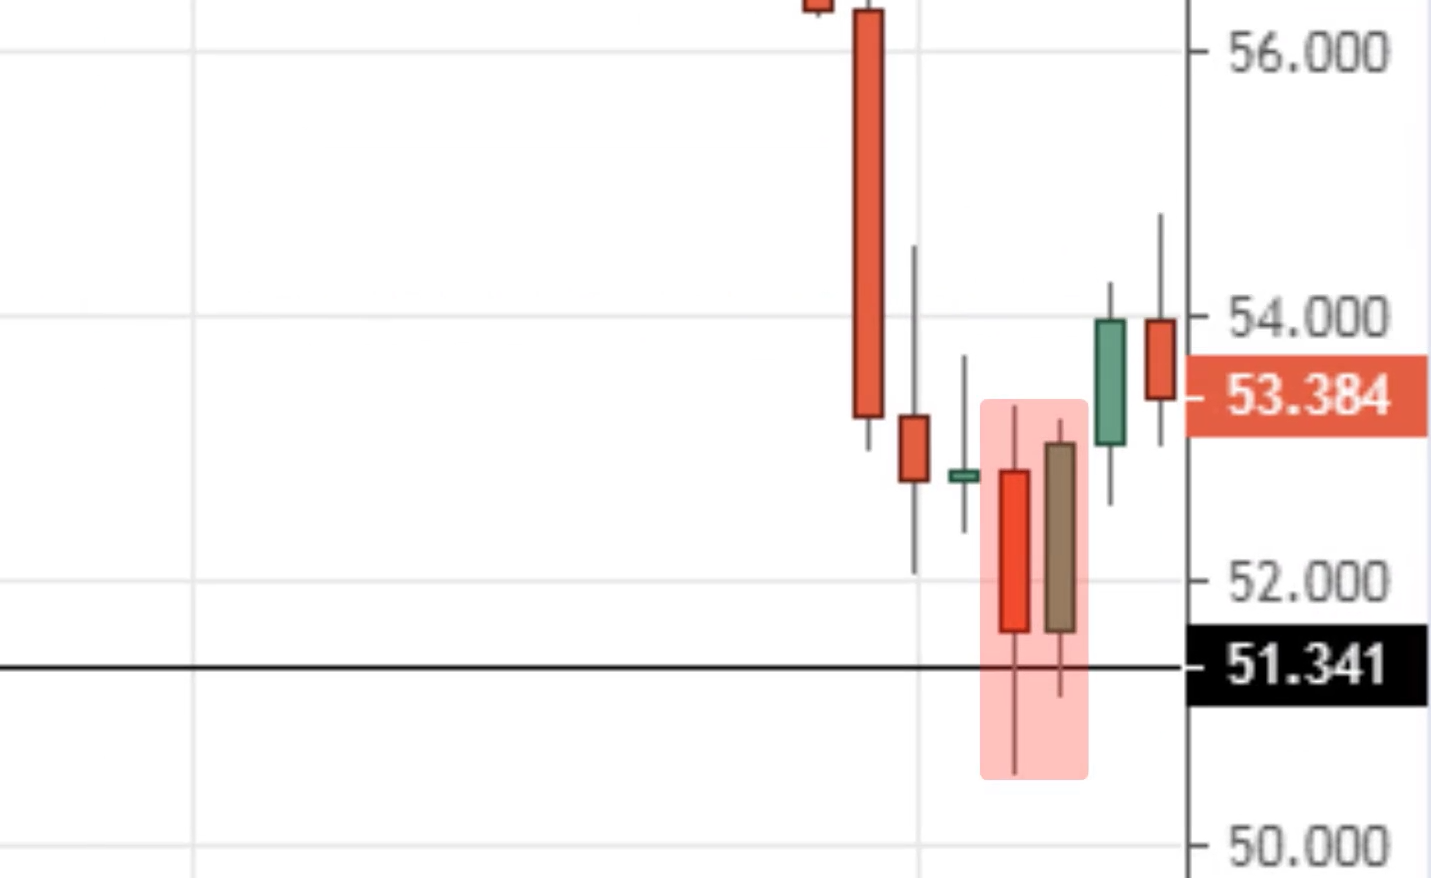
There is a price rejection at support and the market has rallied near the highs over here.
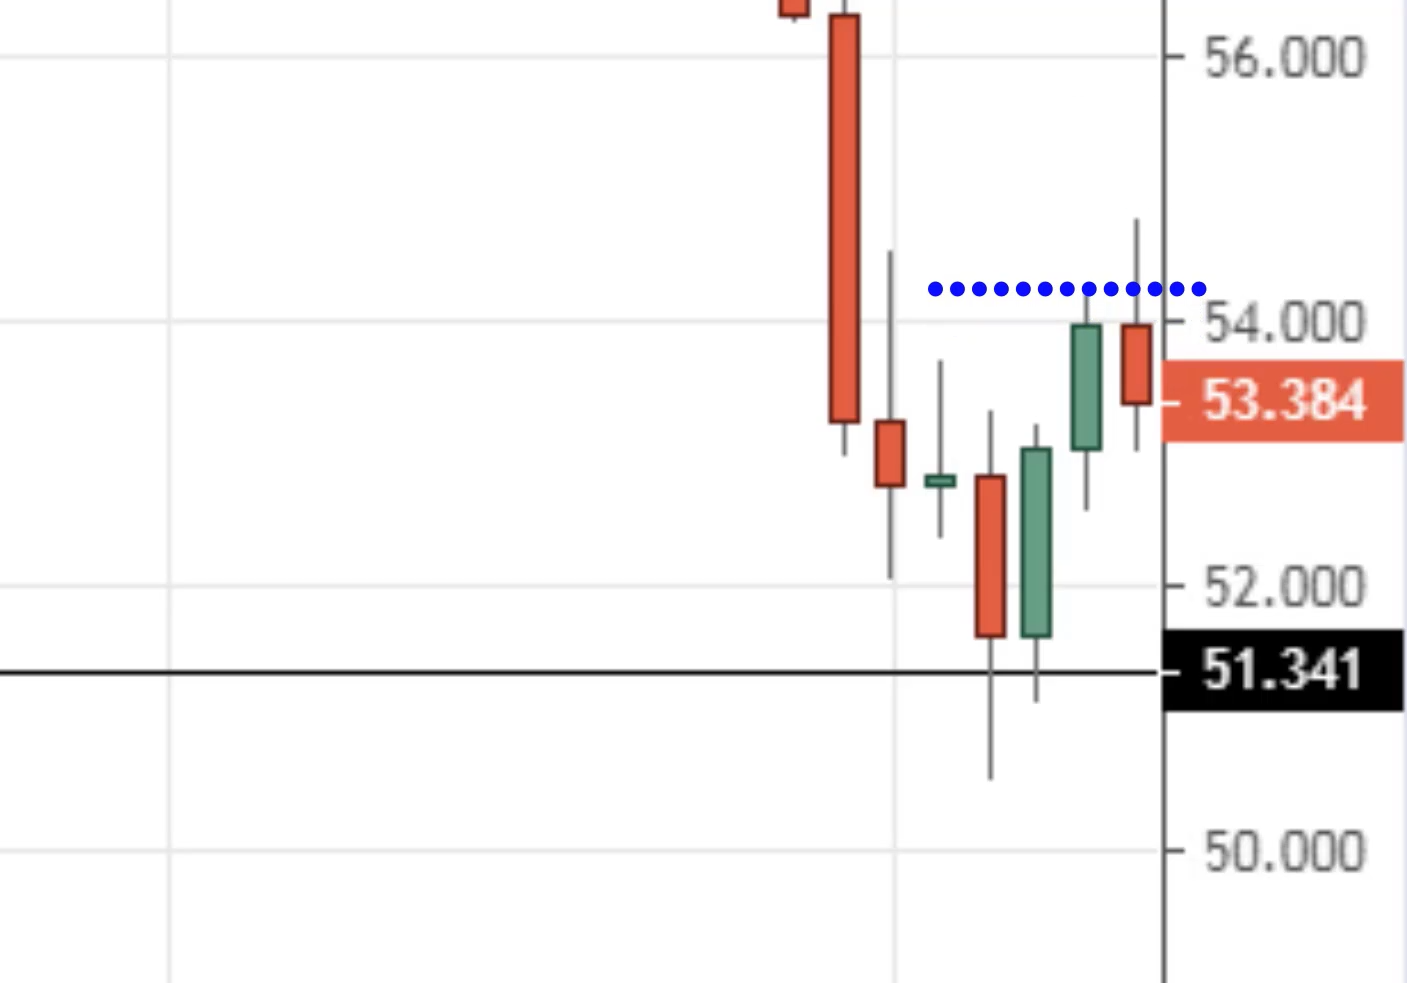
If you were to buy, you will be buying near the highs. Let’s say your stop-loss is 1 ATR below this low.
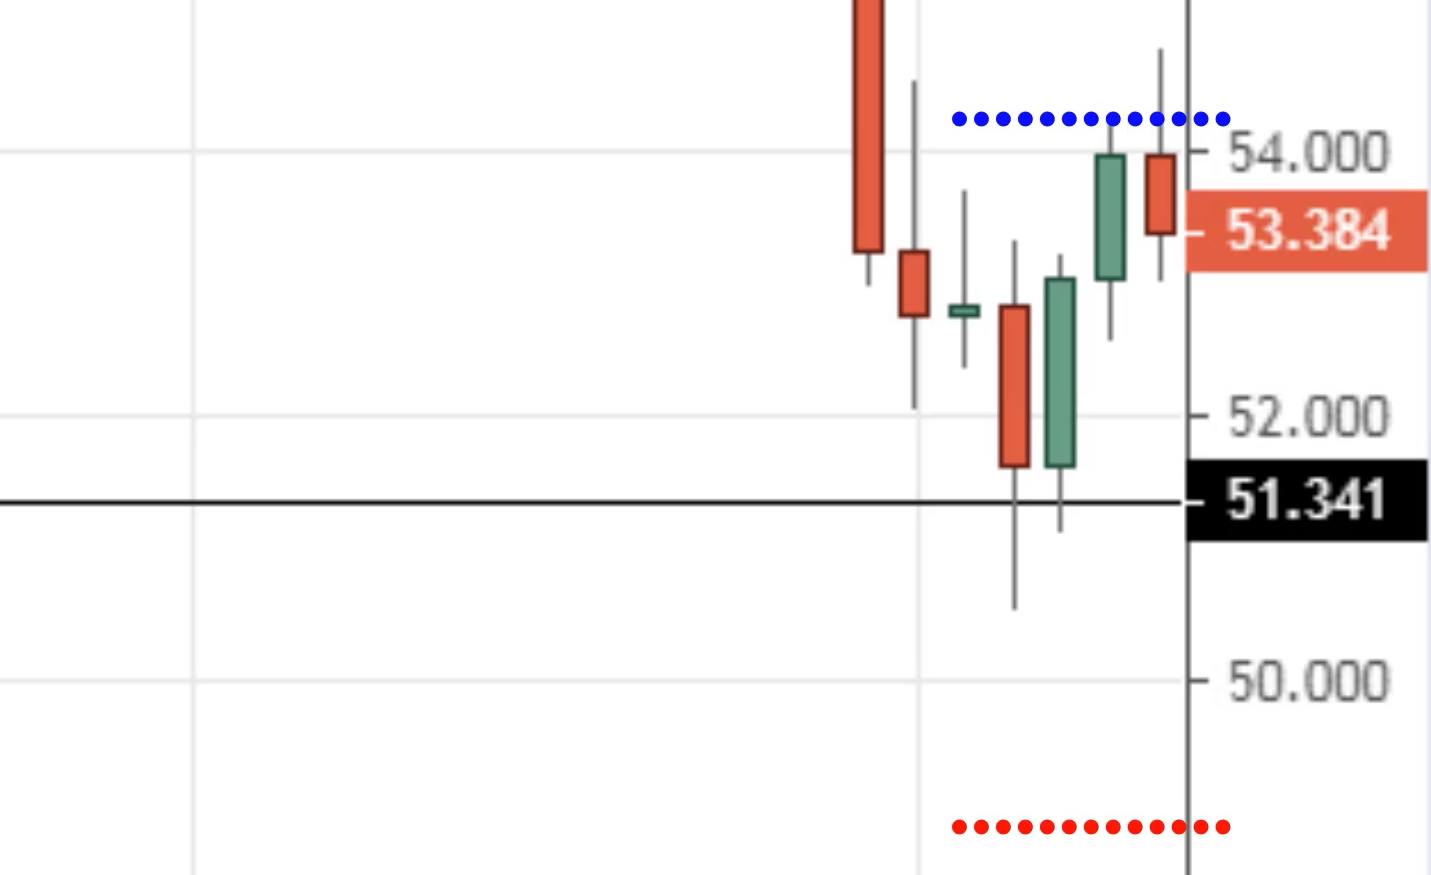
You can see that your stop loss is pretty far and It’s only going to be a short while before you encounter a selling pressure at this level.
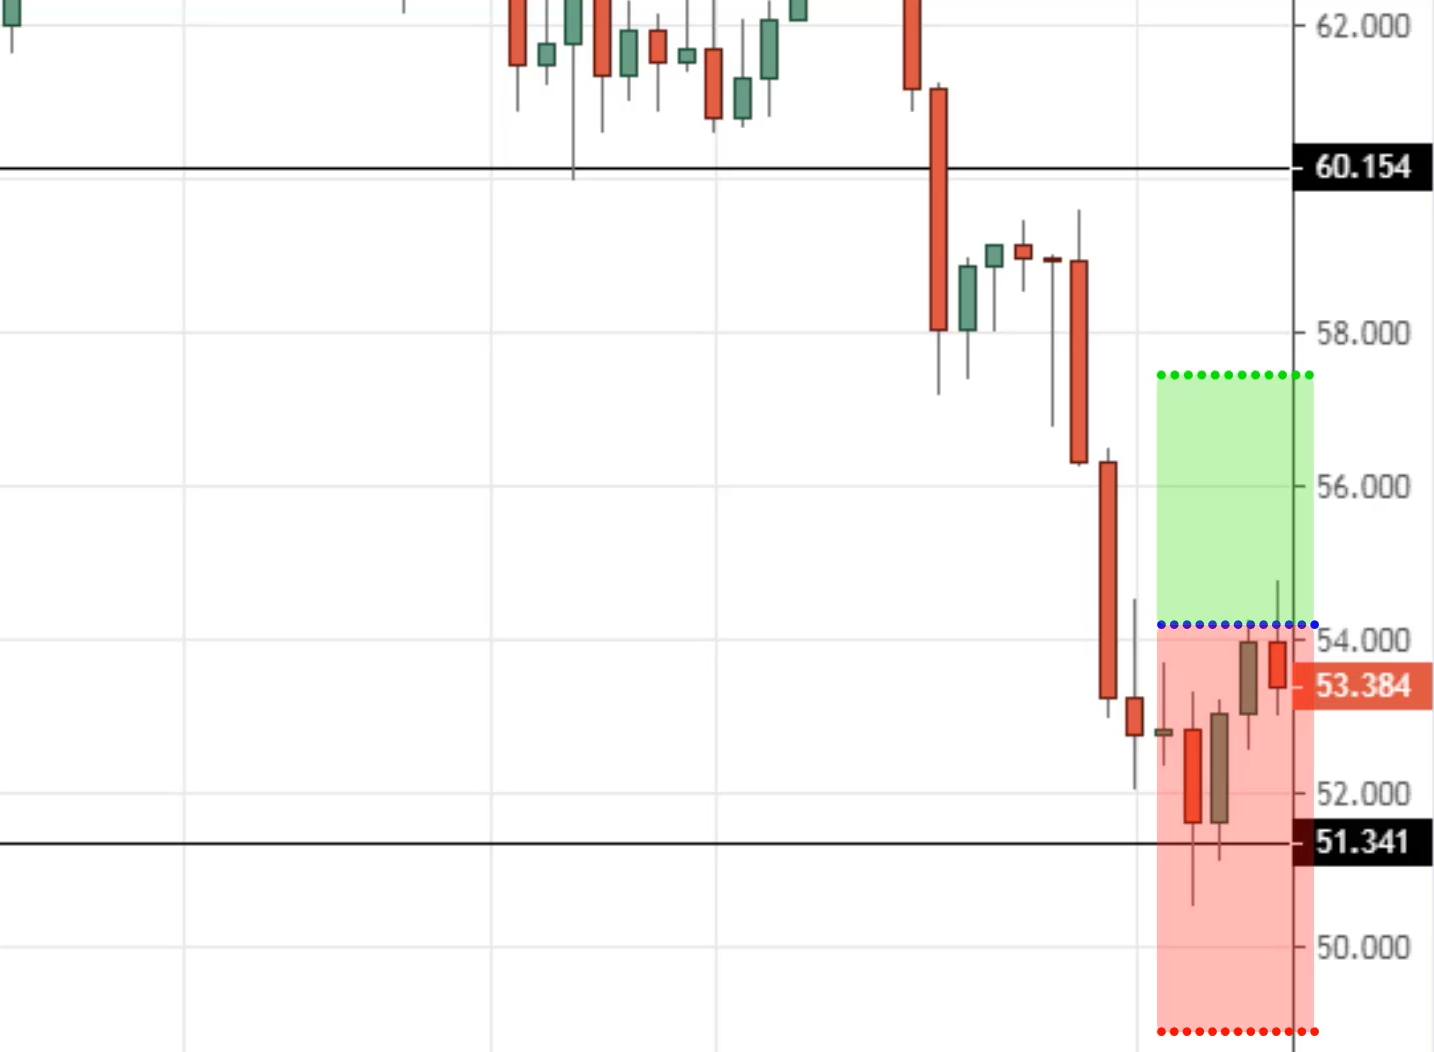
What can you do?
One technique is to use a limit order to see if you can get filled at a better price, and thereby improving your risk-reward on the trade.
Instead of you buying at this high:
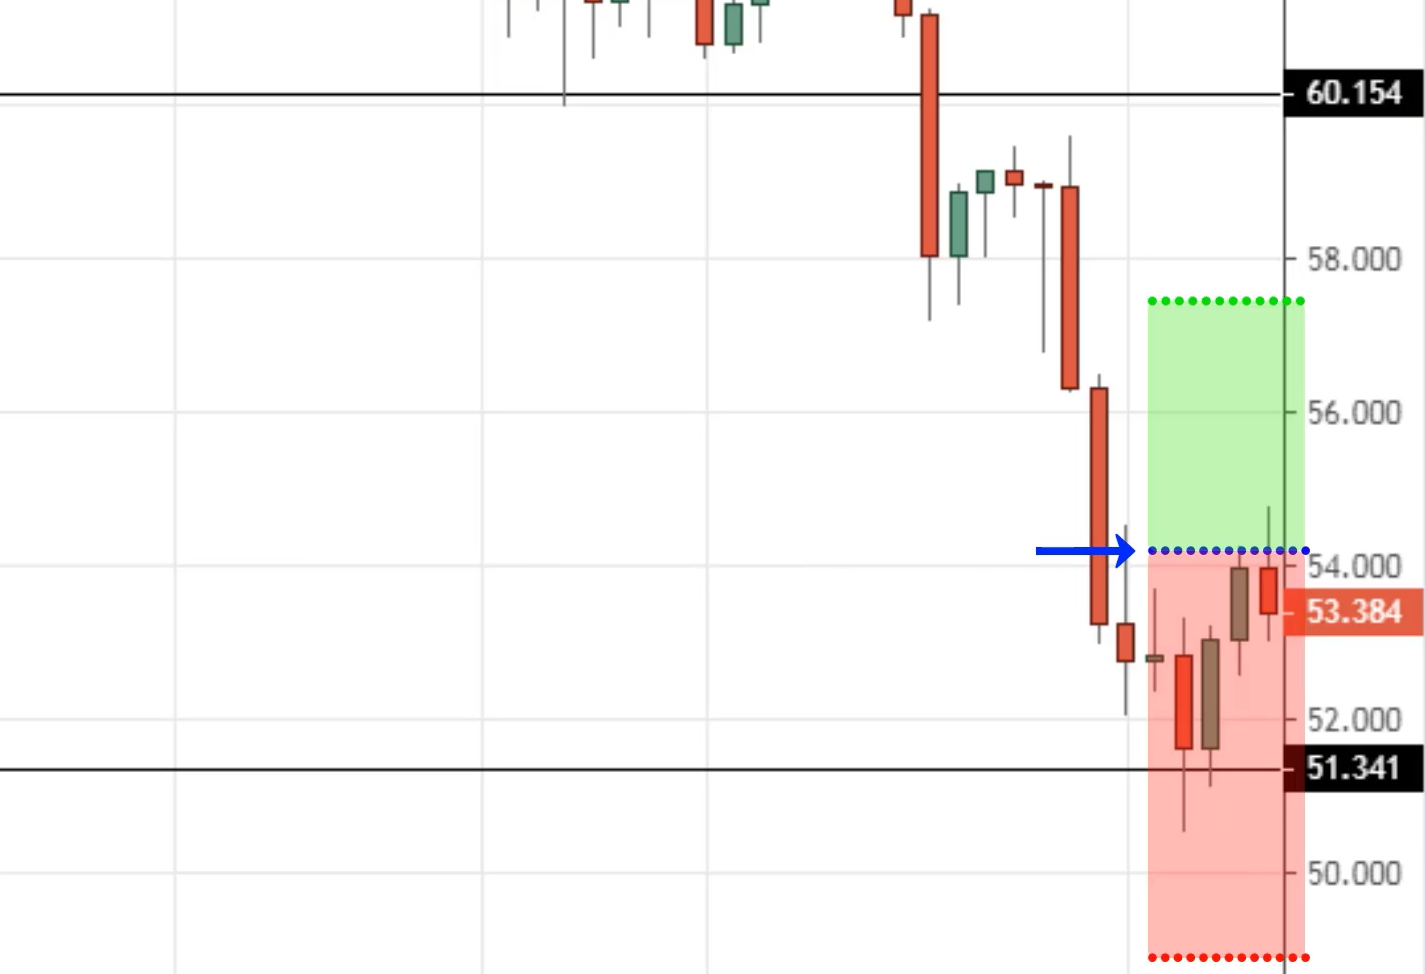
You tell yourself, “I’m just going to place a buy limit order, and see if I can get filled at a better price. If I get filled, I know my risk to reward on the trade would be improved.”
In this case, you can set your limit order just below the candles over here:
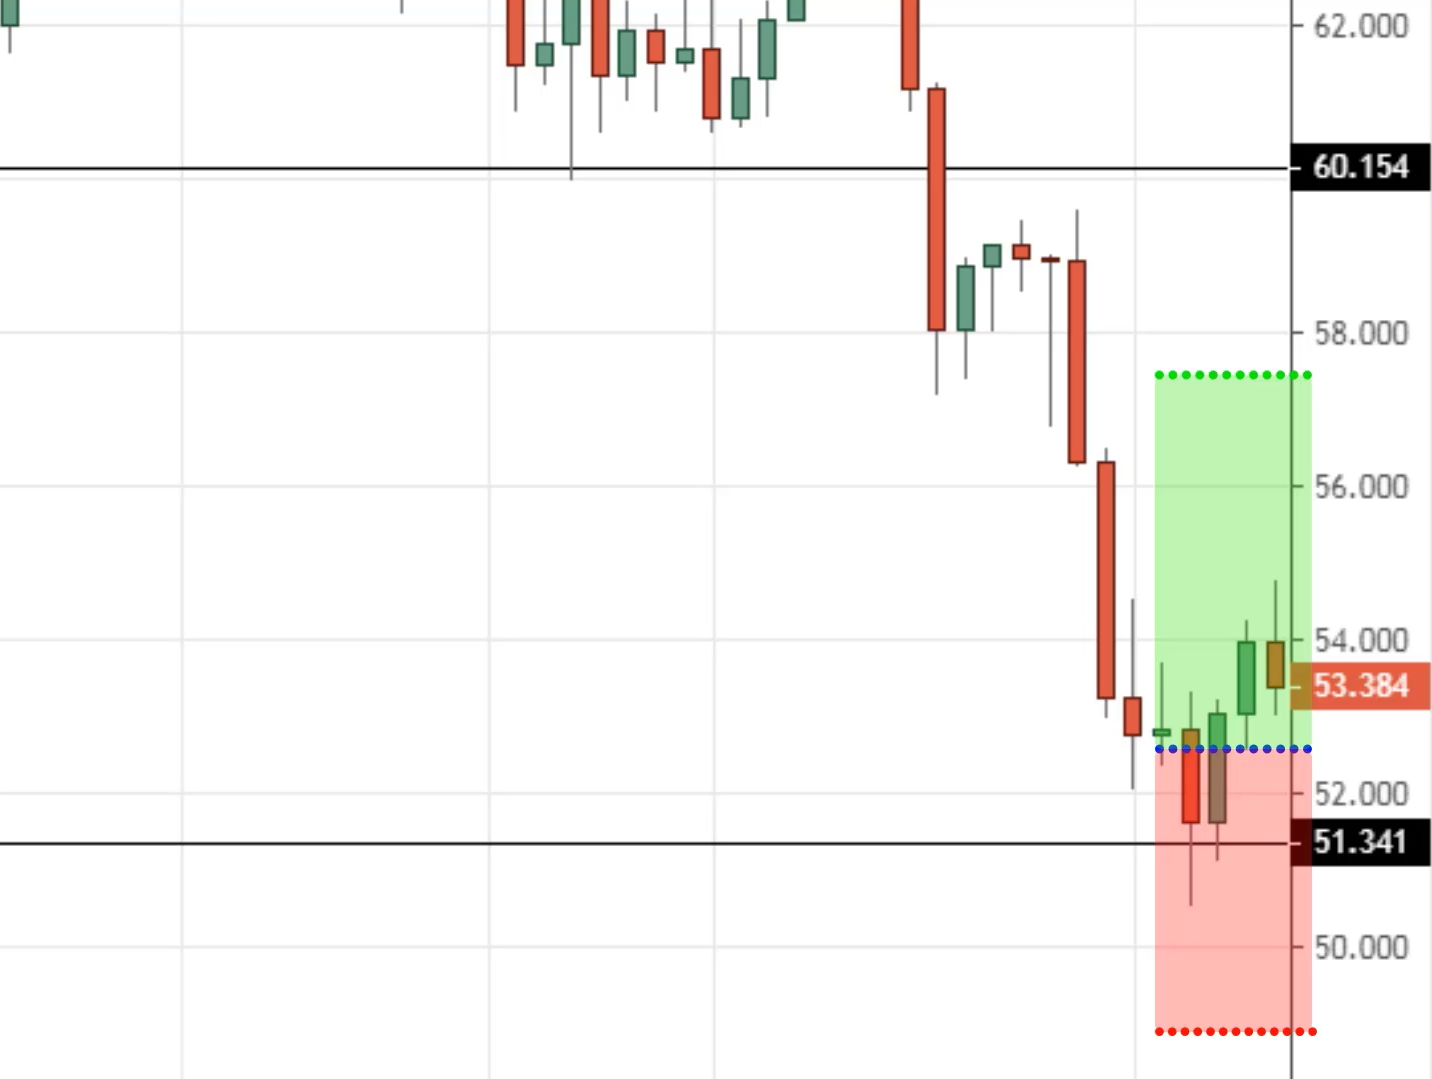
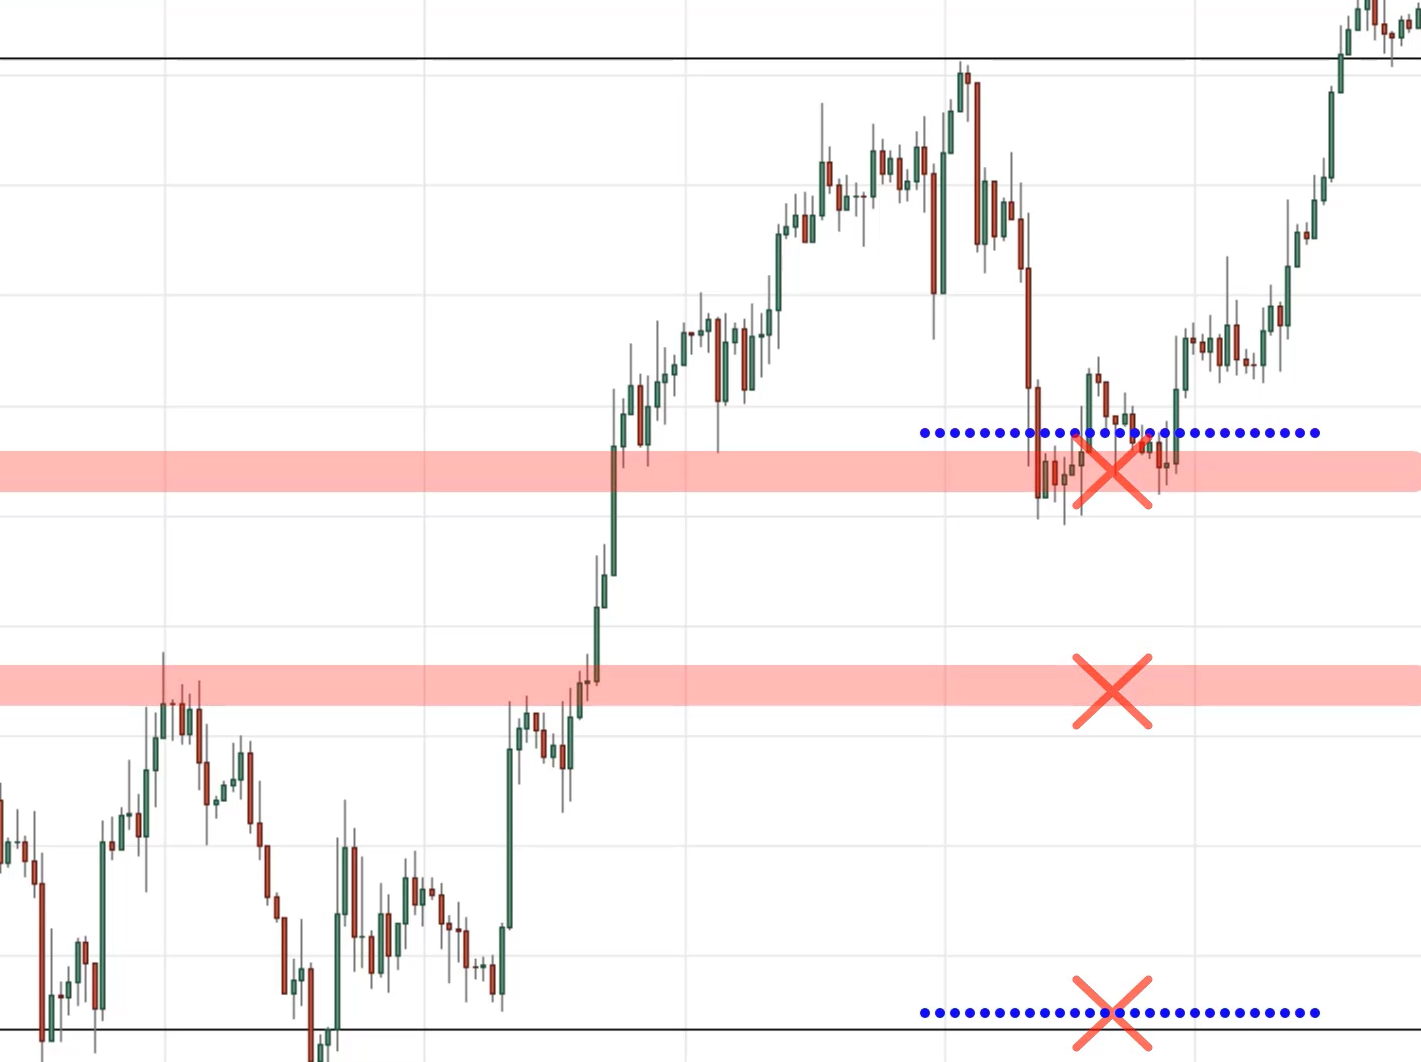
One thing to share with you is that whenever you set your limit order, you want to place it at a market structure where the price would have difficulty going through.
This is where you can use multiple timeframes to assist you.
Let’s look at WTIOIL on the 4-hour timeframe.
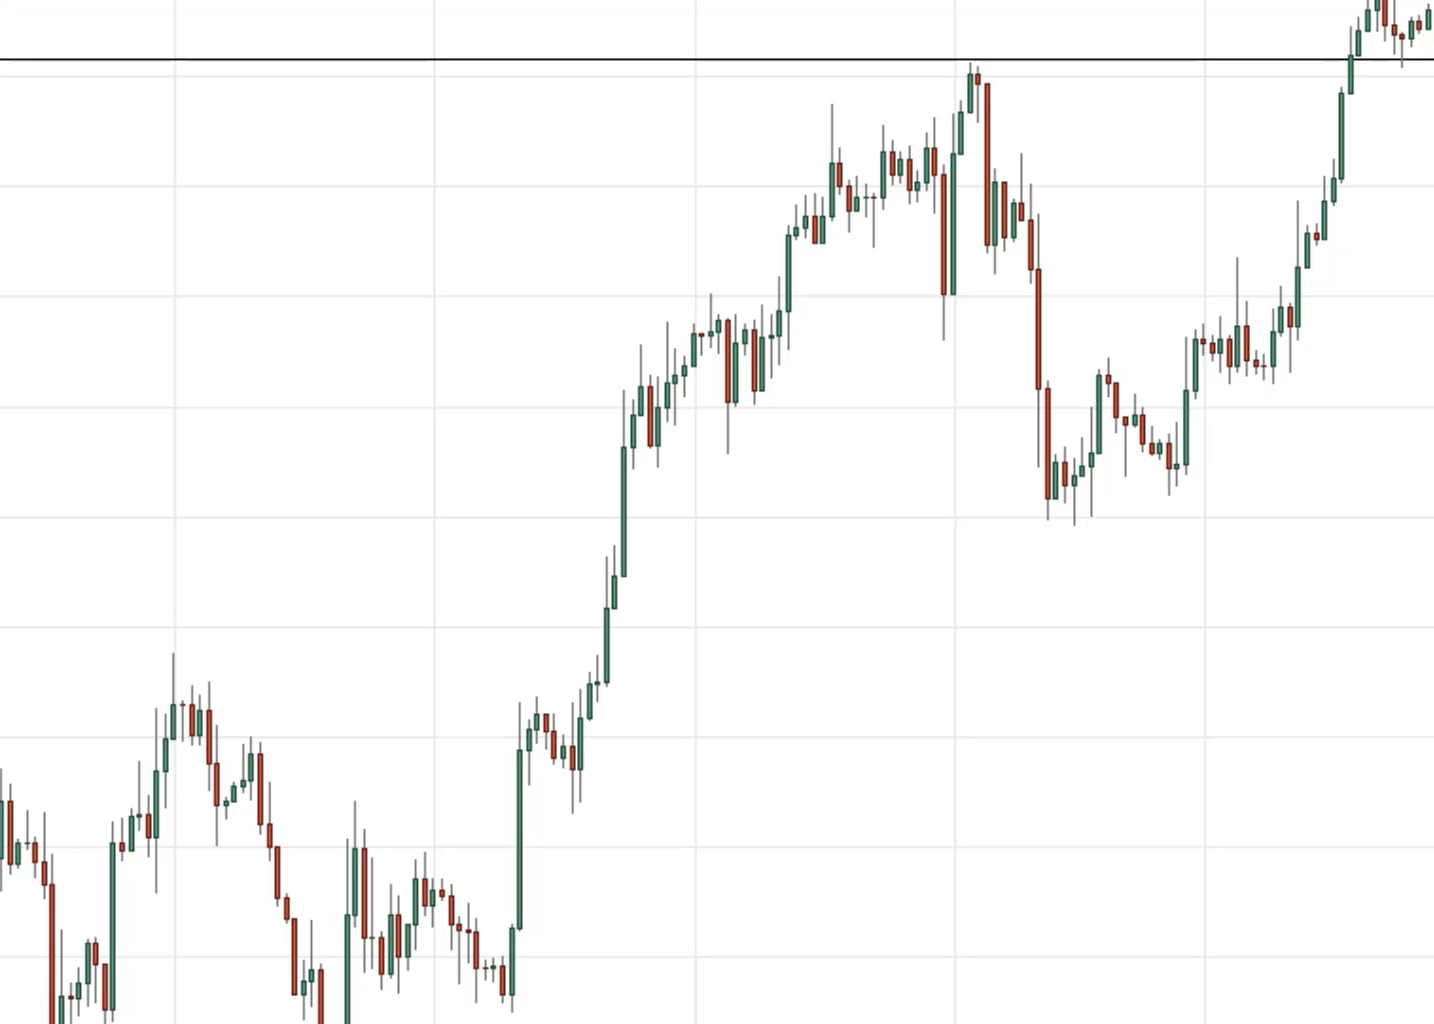
This was the portion where we saw earlier on the higher timeframe to buy near the high.
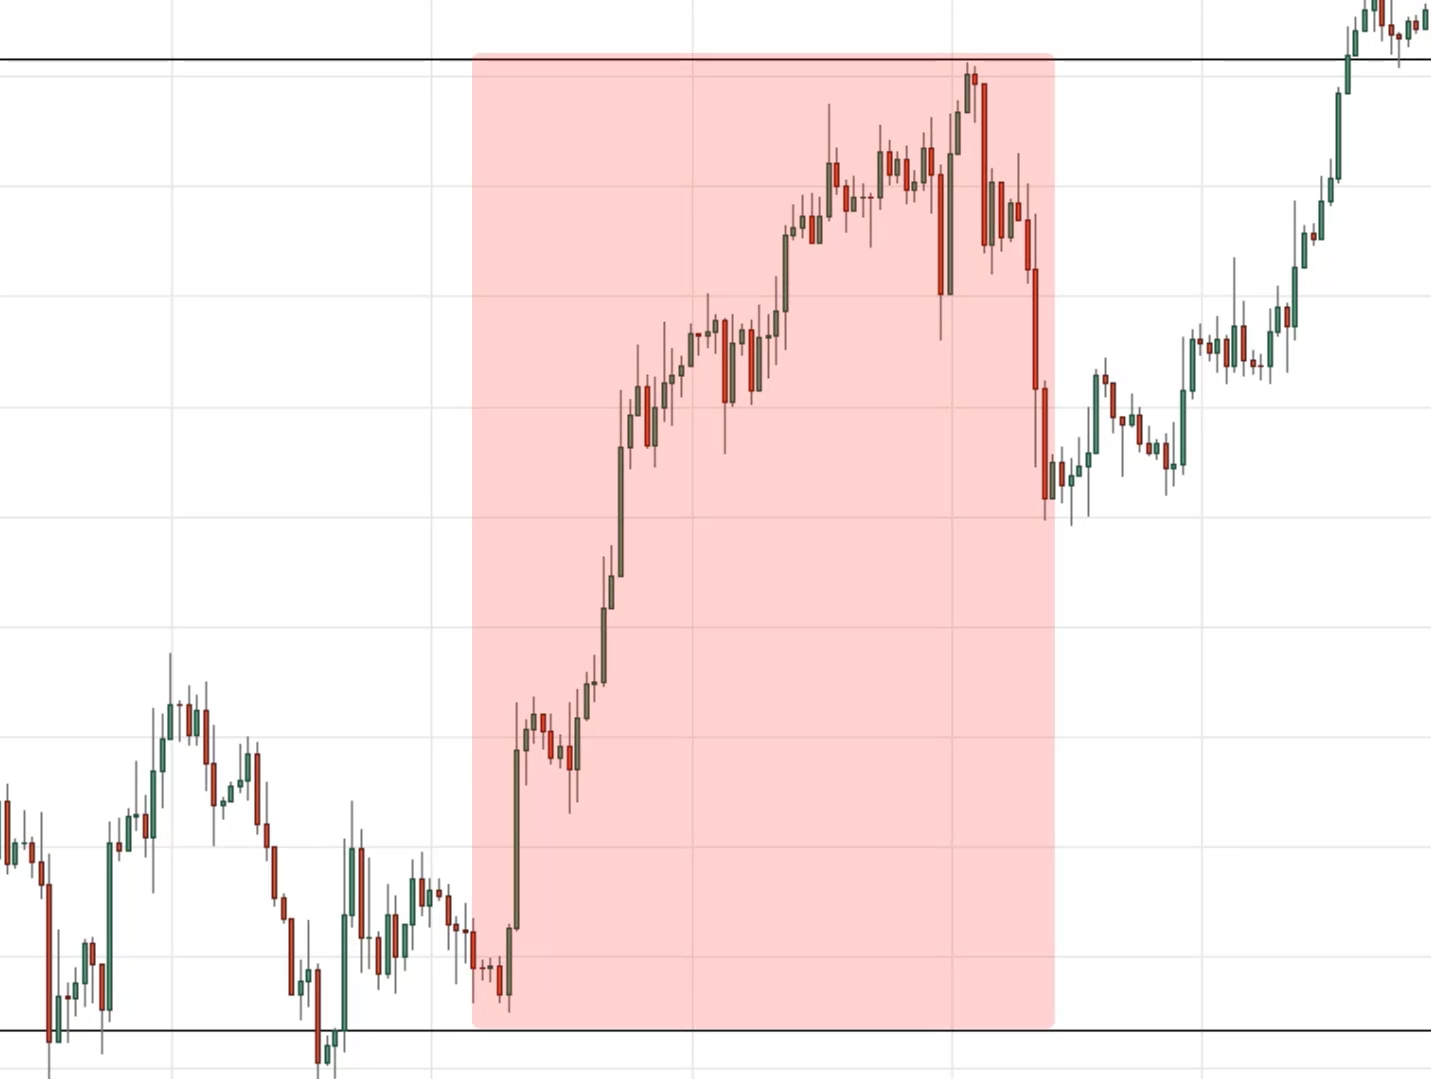
When you want to use a limit order to get it at a better price, let’s say there is this previous market structure over here, which is a previous resistance.
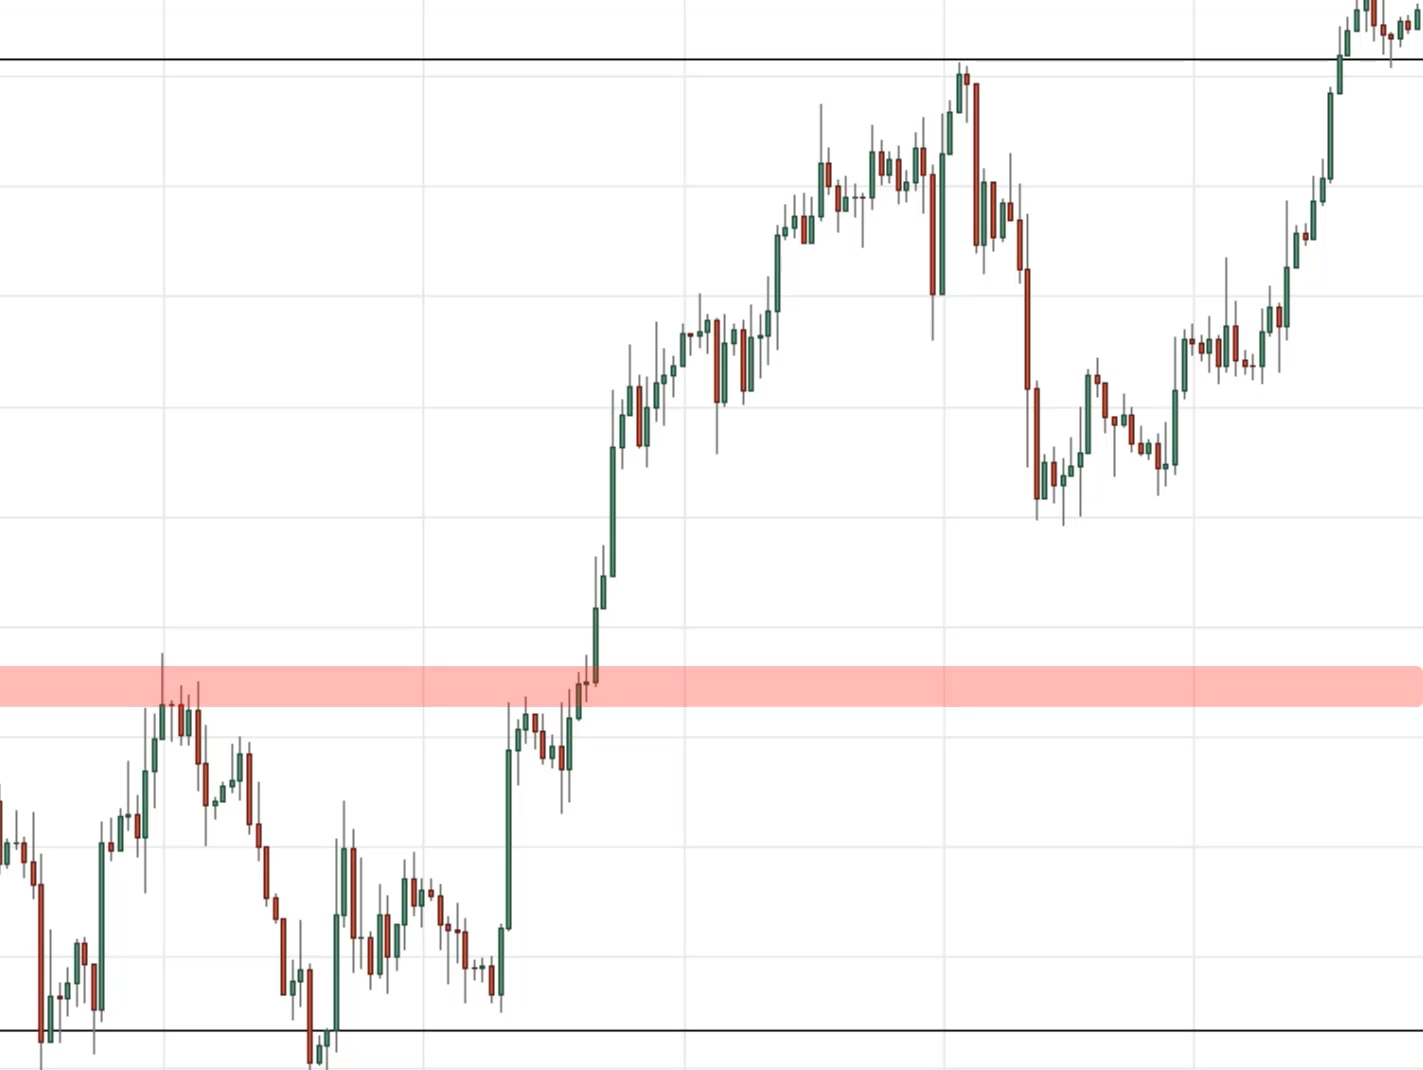
When you look at the chart there’s another market structure here over here.
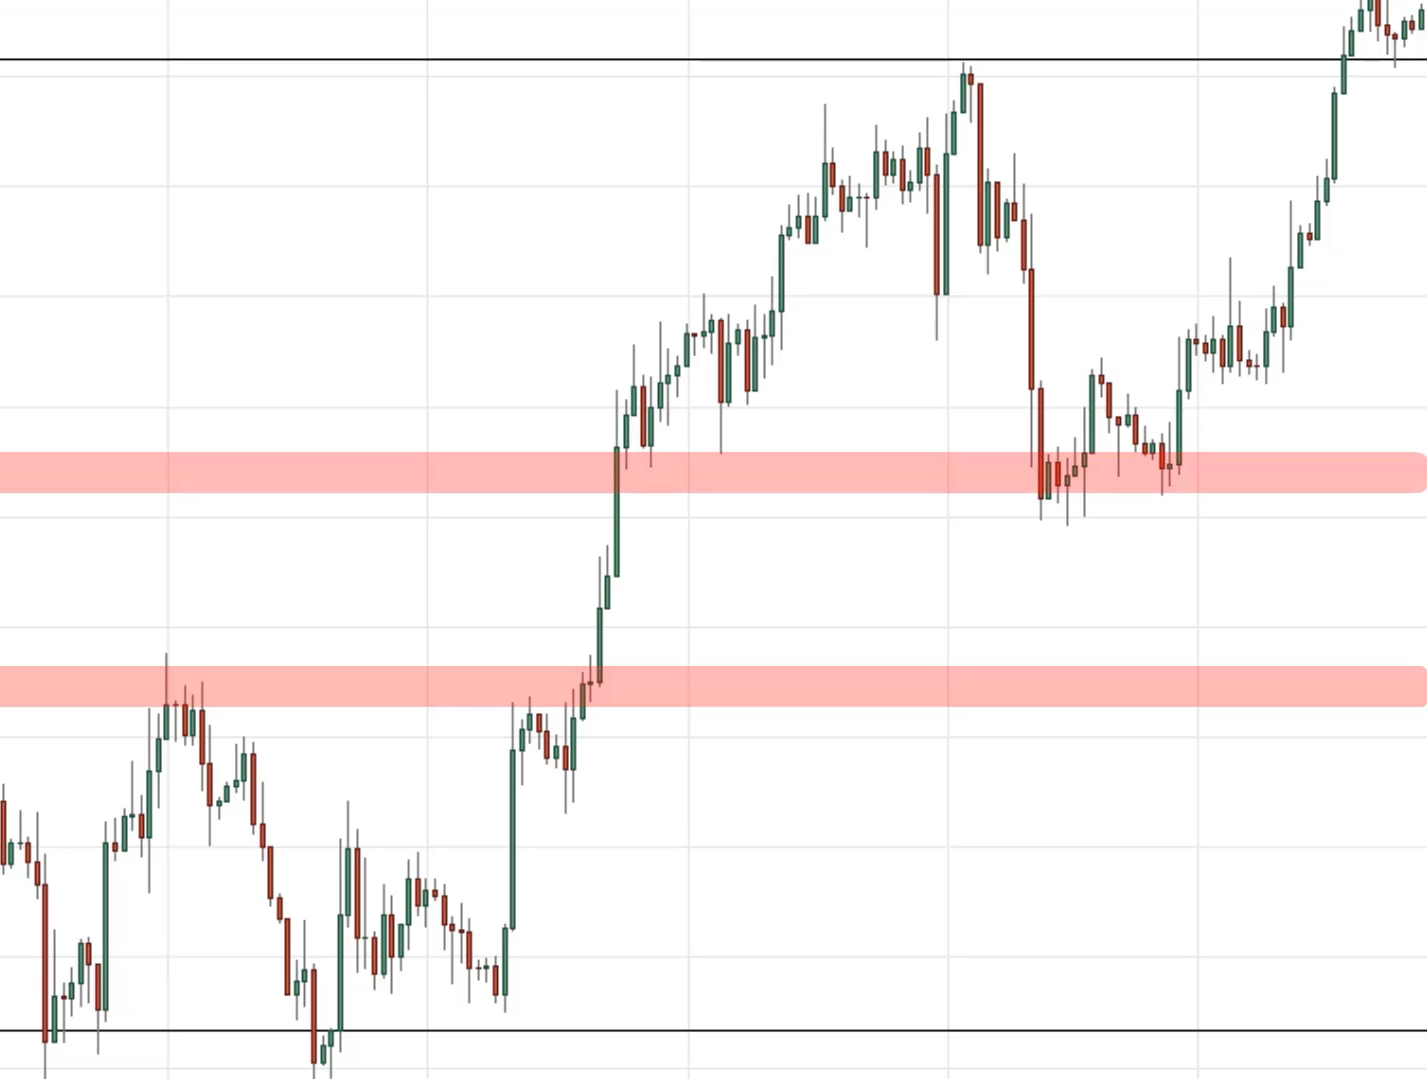
What you want to do is to place a buy limit order at this market structure.
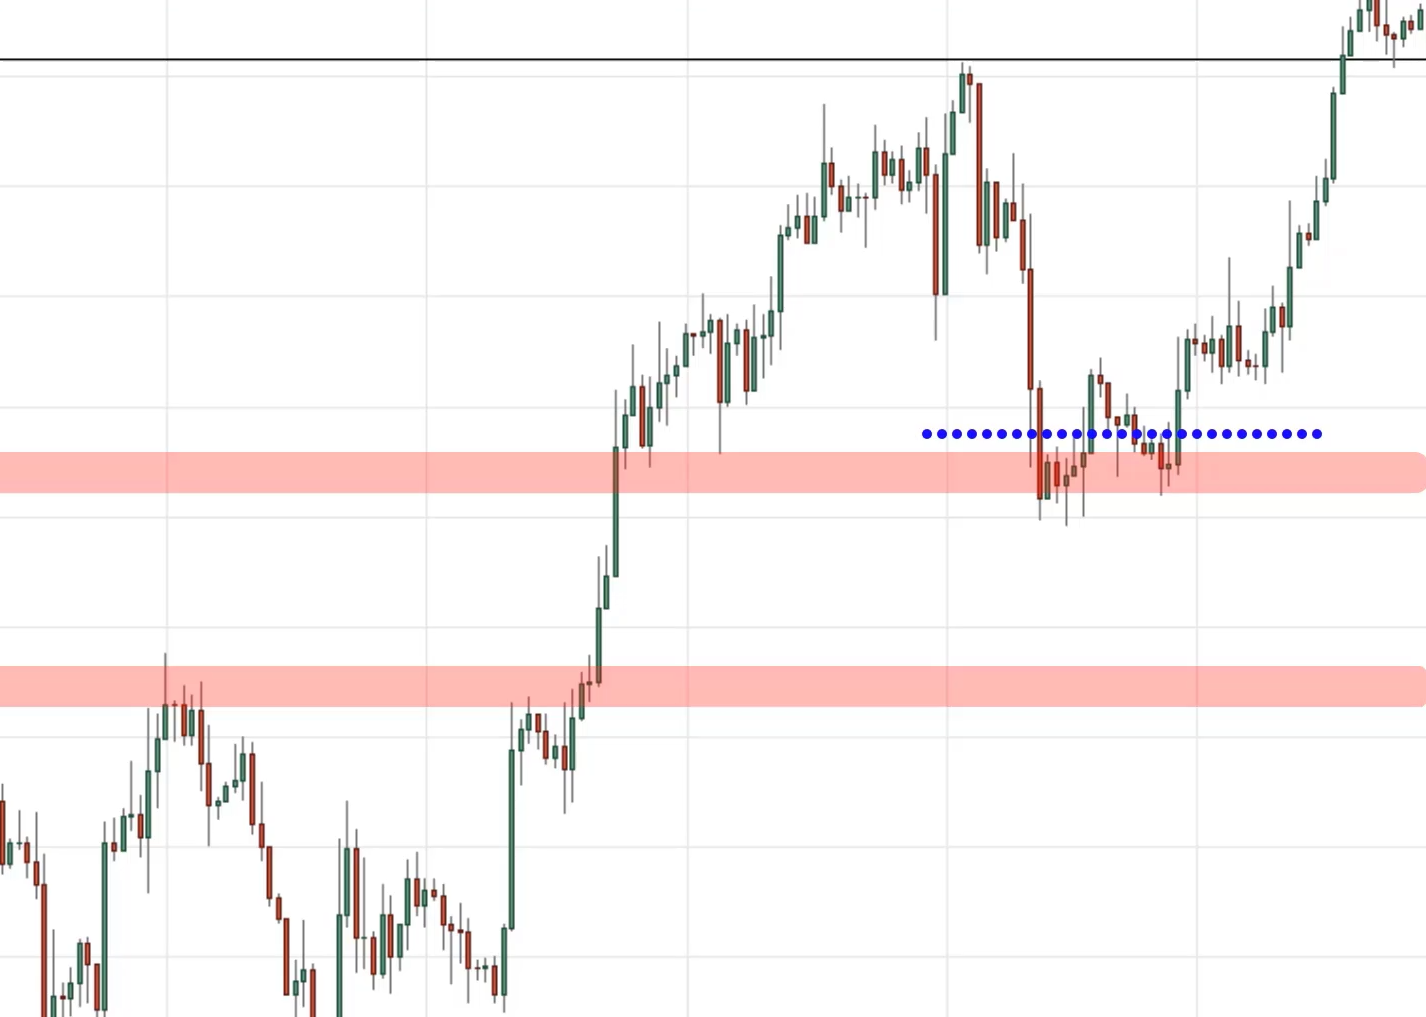
Don’t try to place a buy limit order over here because the price has to break down the market structures before it gets filled.
Here’s a quick recap of what you’ve learned.
Recap
- The M.A.E.E Formula – What, where, when
- Secret Sauces: Power move into market structure, false breakout followed by strong price rejection, using limit orders

Thanks for sharing
Hey Adam,
You are most welcome!
It gets better with every mail, thanks so much rayner
Hey Caleb
I’m glad to hear that!
Thanks Rayner, it makes me have more insight of the market every day by day.
Hey Matthew,
You are most welcome!
Thanks sir, as a beginner in Forex am now having a clearer picture of what the market says.
Hey Adegoke,
I’m glad to hear from you!
Great video, thank you Rayner. It’s very liberating looking at a down trend market and seeing value! Keep up the good work.
Hey Martin,
You are most welcome!
Thanks, I need more, God bless you.
Hey Ojogbane,
You are most welcome!
please make blog based on this topic i’m from india.. and stock market trader i lover every blog you post… i’m waiting another good content
Hey lohith,
Thank you!
Buy limit order is a little confusing at the end. I’m not seeing the area where the buy limit must be place as the area where you are saying it must not be place looks like the same area you are saying it must be placed….may using different indicators could help
Hey Vwegba,
Check out this post…
https://www.tradingwithrayner.com/course/what-is-a-buy-limit-order/
Pls am clear about the calculation of ATR can you throw more light on that
Sorry I mean not clear about atr calculation
Thanks Very much, as a beginner in market , it is helping me learn a lot
Hi Shiva,
You are welcome!
Thx,,, You are a great man….
Way of the Samurai (Bushido)
Hi Parbinder,
Thank you!
Cheers…
Thanks for sharing the strategy, its very powerful. I really appreciate.
Hi Moeketsi,
You are most welcome!
Great video, thank you Rayner. It’s very helpful! Keep up the good work.
Hi Mahendra,
It’s my pleasure!
informative
Hi Oliver,
Thank you!
Thanks for sharing
Hi Ehis,
You are most welcome!
buy limit order is confusing
Hi Hissham,
Check out this post…
https://www.tradingwithrayner.com/course/what-is-a-buy-limit-order/
Yhea its confusing me too
Well Done Rayner, That was More Insight Regarding stop Loss, Thank you I’ve learnt More
Hi Empire,
It’s my pleasure!
good staff
Hi Wilson,
Thank you!
Priceaction trading is a very interesting topic and you are very good at explaining this. Thanks for sharing amigo and stay awesome…
Hi Stephen,
It’s my pleasure…
Cheers.
a little difficult to grasp the explanation of limit order using 4H TF. unable to clearly understand how is the mechanisnm in executing it. hope can get a clearer picture of your technique.
Hi Peter,
Check out this post to know about the orders better…
https://www.tradingwithrayner.com/academy/trading-terminology/
in case of intraday trade, what is right time frame we should use to implement this methodology for trading?
Hi Birendra,
Having knowledge of multiple timeframe analysis would help you go a long way.
Check out this post…
https://www.tradingwithrayner.com/trading-multiple-timeframes/
A Very useful formula for beginners. Thank you, Rayner.
Hi CR,
You are most welcome!
I love the tutorials
Hi Obi,
Thank you!
Cheers…
So far the price action trading is helpimg me a lot, but i still need to learn more
Thanks Rayner you are the best.
Hi Ogu,
You are most welcome!
Rayner, You are the real superman. Love the way you explain…
Hi Varun,
It’s my pleasure!
SAME HERE .. A BIT CONFUSING IN THE END.. SO WHERE TO PLACE THE LIMIT ORDER
Hi Rayner.
Thanks for this class. I will apply those rules and see how I go.
Hi Marcio,
You are most welcome!
Make sure you backtest…
As a newcomer for the forex trading i learnt lot of things. thank you very much. i wish your future endure.
Hi Manjula,
Thank you!
Cheers…
This is really nice, I loved and enjoyed every bit of it.
But Rayner I’m still a newbie in forex trading and I’ve been trying all I can to learn it but rather ive just been loosing the little money I have to trade on real account, it’s just depressing. Thinking of quoting but maybe would try going through this technique of your and just try them out on a demo account. I really need someone that would mentor me Rayner, I wish you could be my mentor, would really appreciate every bit of it.
Please mentor me Rayner..
Thanks for sharing this very urself information.
Hi Leonard,
If you are new to trading then I highly suggest going through Rayner’s trading academy here…
https://www.tradingwithrayner.com/academy/
too good sir.
Hi Mrutyunjaya,
You are most welcome!
Great knowledge.Thank You.
Hi Parasbhai,
You are most welcome!
Nice pesentation !
Hi Peri,
It’s my pleasure!
Hi. i understand what you are saying, but when i try to to do it myself i do not see the support or resistant lines. Is it possible to get help in that. thanks
Hi Kobie,
Check these posts out…
https://www.tradingwithrayner.com/support-and-resistance-trading-strategy/
https://www.tradingwithrayner.com/draw-support-and-resistance/
You have been a ton of help Rayner. I like that you don’t brag about how much you can make daily, or use click-bait, and that you are an honest person who truly wants to share their knowledge. Hard to come by in this world.
You introducing price action trading to me has helped me realize, as you have also said, that the market is literally showing you what it is doing and what it could do next. The movement of the price is showing how the total mindset of all the traders in that specific market is reacting to the price, which is cool to understand.
Can’t wait to see more!
It is almost like the chart is showing the collective thought process of all of the traders combined, at each price at each time. This gives us support and resistance lines. They must be formed by collective thought; traders agreeing that a price is too low or too high. So, price action trading is like analyzing buyer’s and seller’s thought processes in away?
You opened my mind to look at the market in a more abstract way and I am very thankful.
Hi Vince,
I’m glad to hear and happy to see you at the top!
Cheers…
Hi Vince,
Thank you so much!
I like your explanation however Its a new concept so I need to practice using it./ Glad to find the information however.
Hi Mark,
I’m happy you want to practice it!
Hi Rayner I just wanted to inform you that my trading has changed since I started going through your videos and receiving your emails and I’m glad because I’m still a beginner not more than 3 months, I’m practicing on my demo account. About the MAEE formula I think it’s gonna add more to what I’ve gained, I just watched it now then I’m gonna apply it on my trading
Hi Rayner, I’m Meshack Mosipi from South Africa,I have been going through your videos since April this year, I’m killing the market with your price action strategy even the ebook you sent. It’s really helpful. Thanks for changing my life. May God Almighty give you more knowledge so that u can be able to assist us.
Hi Meshack,
I’m so glad to hear that!
Thought i could never understand anything with trading,thank you i can now see the light at the end of the tunnel.
Hi Jacob,
I’m so glad to hear that!
You have done so well sir. My trading skills has been tremendously improved by your price action trading. Thank you.
Hi Ayoola,
Thank you very much!
Kudos! I’m a novice trader and watching your videos helped me a lot. Your videos are very educational and easy to understand. I learned strategies that help me profit. Thank you for sharing your knowledge with us for free. More power to you! God bless you and your family.
Hi Wil,
You are most welcome!
Excellent, many thanks, invaluable, tips, master class
Hi Bastian,
Thank you!
Thanks.
Hi Eze,
You are welcome!
Please help me am a young trader striving in a financial markets
Hi Kalu,
Check out the trading academy, it’s FREE!
https://www.tradingwithrayner.com/academy/
Hi Reo. I really appreciate your time and effort in putting the newbies through on difficulties encounter during trading. You have imparted positively in me, I now see candle stick pattern as an individual giving me signals and directing me on what to do. Hence not forcing the market to do what I want.
Thanks for changing my perception of Fx trading.
Hi Caleb,
I’m so very glad to hear that from you.
Keep flying.
Cheers…
very useful and informative video, Thank you so much.
Hi Surya,
You are most welcome!
Thank you rayner
Hi Russell,
You are welcome!
I cannot express how this makes me feel, but you are doing a great job. I cant wait for your next email as it is always exciting because you just tell us what we need to hear. Thank you
HI Lwando,
You are most welcome!
Love you sir , your blogs inspiring me, i have lost big money i stopped all types of trading because I have no money, I am preparing myself with helps of you once again love you sir,
Hi Manish,
You are most welcome!
I have learned something i did not know before. Thank you Mr Rayner Teo. Really Appreciated.
I need to observe and study your secret of MAEE
Hi Ching,
I’m glad to hear that!
Cheers…
Coming across your videos have changed my entire portfolio. I now trade more professionally thanks to you! Keep up the great work!
Hi Ebony,
I’m so glad to hear that from you!
Cheers…
Very interesting training video sir
Hi Anish,
Thank you!
Price action trading very is powerful. You have been informative and have structured my trading career. All that is left is to polish up on what I have learnt from you and put it into practice. Grateful
HI Phinda,
I’m so glad to hear that from you.
Cheers…
thanks Rayner
great stuff,,,,,
Hi Parviz,
Thank you!
Limit order confused me at the end, couldn’t see where to place it
Hi Sasha,
Check out this post from the academy for limit orders…
https://www.tradingwithrayner.com/academy/trading-terminology/
Cheers.
Thanks Rayner. This is so fundamental and solid. Really appreciate the content and the elegance of how you’ve laid out the information.
Hi Peter,
You are most welcome!
Rayner, great video. Thanks
Hi Ganesh,
Thank you!
love the price action method it’s simple looking forward on your next shared video
Hi Fadzil,
You are most welcome!
This is very expository in improving my trading strategies
Hi Ade,
I’m glad to hear that!
Cheers…
You are a great analyst and mentor sir! Easy to understand write up. Thanks for a job well done!
Hi Ameh,
You are most welcome!
Thank you…
Amazing sir
Hi Shaktisinh,
Thank you!
Thank you sir to sharing this blog
Hi Sonu,
You are most welcome!
Really enjoying you sharing your thoughts Rayner. The MAEE system makes a lot of sense and I think I will be implementing aspects of this into my trading plan.
Hi Steve,
It’s my pleasure!
MAEE is an easy to understand strategy for price action trading. My take away from this training session is, remove all the bias since what matters is Price, Price & Price. I think mastering the Entry & Exit will need time & experience. Rayner, thank you for guiding the novice traders like me. Will look forward to your next email.
Hi Santosh,
You are most welcome!
Great advice and perfect time (for me) to watch this video. Already helps me understand where I made mistakes and how I can trade smarter. Thank you.
Hi Jb,
I’m glad to hear from you!
Now my “whys” have been answered, powerful stuff. More of this, Thanks for the great job.
Hi Ricardo,
I’m so glad to hear that!
tenkyu
Rayner thank you so much for such information. Am still trying to learn more about the market and blowing account since I can’t afford any course but at least i afford data to capture such information thank you.
Hi Phumezo,
I’m glad you are building your skills.
Cheers.
Learning great things everyday from your mail. Regards
I’m a beginner and learning a hell of a lot from your post on you tube and training manuals well done I Hope to be as good as you someday I didn’t quite understand you’re limit stop at end but I’ll get it thanks
Hi Herman,
I’m glad to hear that!
Very informative.I was always battling to place stop loss now I got it from you.The sky is the limit.
Hi Anthony,
I’m so glad to hear that!
Thank you for your information, it’s always great teachings.
Jody
Hi Jody,
Thank you.
Cheers!
Thanks for the love broo
Hi Mundhir,
You are most welcome!
Cheers.
Thank you Rayner once again for the great content
Hi Mrcrookshank,
You are welcome!
Hi, Rayner
I am watching your videos and these are very useful. I was not aware about the way you have explained to see the market. Now I can see the trend in different time frame. By using this I can decide the time period of investment. I can easily find the current trend. Where to buy or Sell. What should be the exit and all. It is helping us to take the trade.
Thanks for your videos.
Hi Ashok
I’m glad to hear that!
Cheers.
Thx
Rayner !
Hi Atul,
You are welcome!
Great. Thanks Ray. I need more info and understanding of XAU. Thanks
great video
thanks for sharing
Hey Sunil,
You are most welcome!
Cheers.
You are my hero
Hi Aamy,
Thank you!
Thanks for sharing
Hi Natasukma,
You are welcome!
Thanks very much Rayner…how dk K access this
HI Selio,
You are welcome!
Hi Rayner,
I absolutely enjoy and learn form you. In-depth, logical, humorous! Q1) A strong rejection: traversing the entire range in roughly 3, max 4 candles (I know there is no rule)? Q2) To trade D1 timeframe: longer time of Wkly to establish mkt structure, H4 to find entry-is that a good estimate? Thankyou
Thank you. You are really a smart trader. I would like to learn from you.
Hi Malika,
You are most welcome!
Cheers.
Thanks very much for the tips, thou I’m very cleat about the entry point for the limit oder.
Hi Kidot,
You are welcome!
Thanks, Rayner for sharing great insights, it helps us view the market differently. GOD BLESS YOUR BIG HEART.
I appreciate your kindness sir,im now getting a clearer vision on the market
Hey Derrol,
You are welcome!
Cheers.
Very informative and direct to the point…that’s the best strategy…
Hi Dinesh,
Thank you!
how many duration do we need to learn to become perfect bro
Hi Dawa,
The learning curve is different for everyone.
We learn every day.
Helped me very much in my learning
Thank you, Sandeep!
Sincere grateful for this insight in the market. Thanks boss
Hi Emmanuel,
You are welcome!
From day one…….which wasn’t too long ago……..I have leaned towards price action trading. These videos have given me a better understanding of this field and the confidence to continue along this path.
Thank You!
Hi Khem,
You are welcome!
SUPERB
Hi SGS,
You are welcome!
Life changing lessons……. thank you sooooo much…. god bless you
Hi Chirom,
You are welcome!
Cheers.
“Repeatedly Grateful” for your shared knowledge!!
Thank you, Dev.