Before we start on how to set proper stop loss or how to set a trailing stop loss order, let me ask you:
Do you get stopped out of your trades only to watch the markets reverse back in your direction?
Or perhaps you try to ride a trend only to get stopped out on the retracement.
And you’re feeling…
“Argh, the market is rigged!”
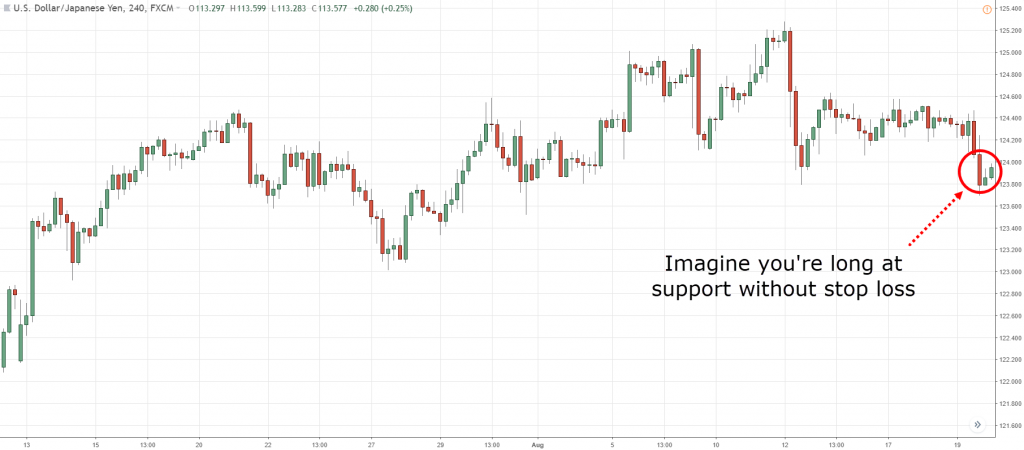
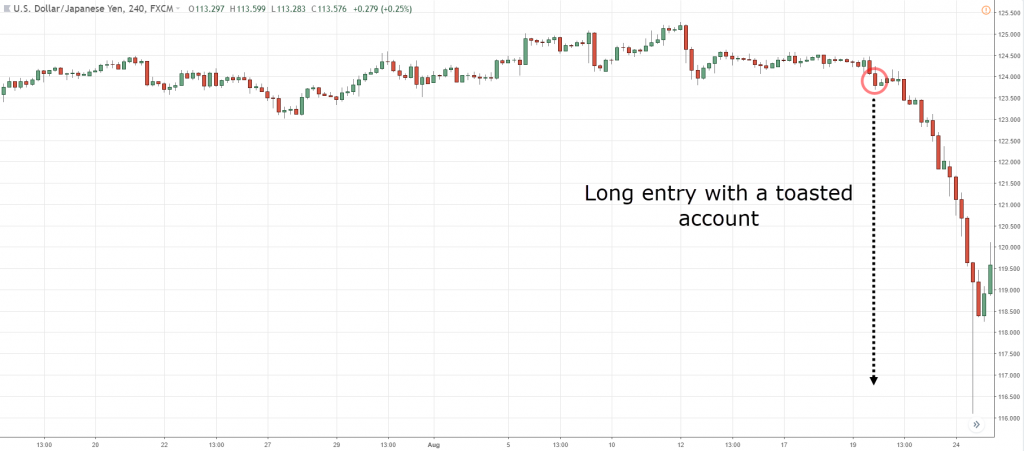
Well, that’s because you put your stop loss at the same level as everyone else — and it makes you an easy target for a stop hunt.
But don’t worry, all this will change.
Because in this post, you’ll learn you’ll learn how to set a proper stop loss so you can reduce risk, maximize profits, and avoid stop hunting.
Sound good?
Then continue reading…
Why using a stop loss order is your greatest trading tool (you must know how to set proper stop loss)
A stoploss order gets your out of a trade when it goes against you.
An example:
You long Apple shares at $100 and place a stoploss at $90. This means that if Apple trade to a low of $90, you will exit your trade immediately, restricting your loss to $10 (assuming no slippage).
And not only that…
The benefits of having a stop loss include:
- Preventing you from blowing up your trading account
- Limiting your losses
- Living to “fight” another day
You can treat stoploss like insurance. You dislike paying the small premiums, but you’re glad you have it when sh*t hits the fence.
This is what I mean:
If you can’t take a small loss, sooner or later you will take the mother of all losses. – Ed Seykota
Now…
You know the importance of having a stoploss. Let’s learn how you can set a proper stop loss.
How to Set a Stop Loss order?
I’m going to share with you 3 ways on how to set stop loss:
- Volatility stop
- Time stop
- Structure stop
Volatility stop
A volatility stop takes into account the volatility of the market.
An indicator that measure volatility is the Average True Range (ATR), which can help set your stop loss.
How to set stop loss using volatility stop:
You need to identify the current ATR value and multiply it by a factor of your choice. 2ATR, 3ATR, 4ATR etc.
In the example above, the ATR is 71 pips.
So if you were to place a stoploss of 2ATR, take 2*71 = 142 pips
Your stop loss is 142 pips from your entry.
Pros:
- Your stop loss is based on the volatility of the market
- An objective way to define how much “buffer” you need from your entry
Cons:
- It is a lagging indicator because it is based on past prices
Time stop
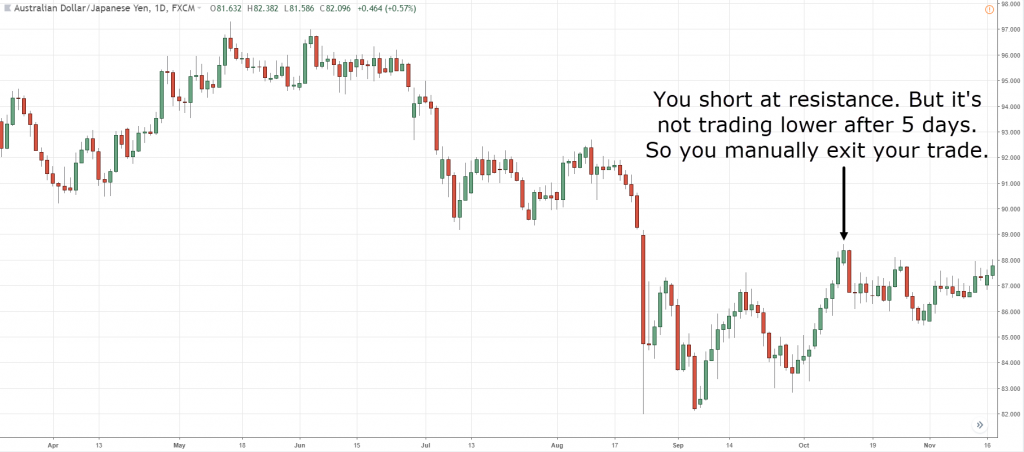
A time stop determines when you exit your trades based on time.
Instead of exiting your trades based on price, you exit your trades after X amount of time has passed.
How to set stop loss using time stop?
You need to define how much time you will allow before exiting it.
An example:
You took a short trade at resistance area. But after 5 days it’s not going anywhere, so you exit your trade.
- You reduce losses
- If you have trading records, you can identify the optimal amount of time to give your trades
Cons:
- You may exit prematurely only to see the price move in your favor
Structure stop
A structure stop takes into account the structure of the market and set your stop loss accordingly.
How to set stop loss using structure stop?
An example…
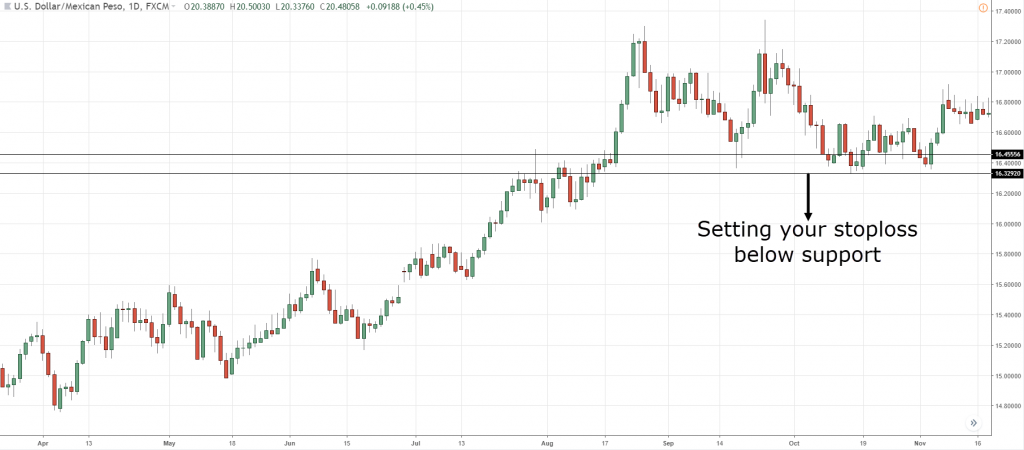
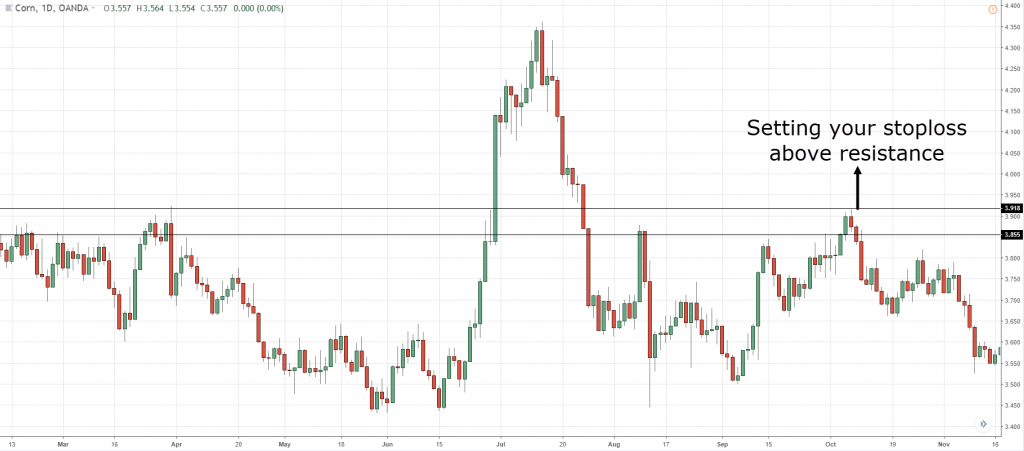
Support is an area where price may potentially trade higher from. In other words, it’s a “barrier” that prevents further price decline.
Thus, it makes sense to have your stoploss below Support. Vice versa for Resistance.
Here’s what I mean:
You want to place your stop loss where there is a structure in the market that can act as a “barrier” for you.
Below is a training video that explains this concept in more detail…
Pros:
- You know exactly when you’re wrong because the market structure has broken
- You’re using “barriers” in the market to prevent price from hitting your stops
Cons:
- You need wider stop loss if the structure of the market is large (this results in small position size to keep your risk constant)
Now…
You’ve just learned 3 new ways on how to set stop loss.
You’re wondering:
How do I trail my profits as price goes in my favor?
Read on…
How to set trailing stoploss order to maximize your profits
Understand this.
A trailing stop loss will maximize your profits and let you ride massive trends. But at the expense of a lower winning rate.
If this is something for you, here’s 6 ways to do it:
- Structure break
- Moving average close
- Moving average crossover
- X period high/lows
- Average true range from peak to trough
- Trendline
Structure
You know an uptrend consists of higher highs and lows.
You can use it to trail your stop loss below the previous swing low, until it gets broken.
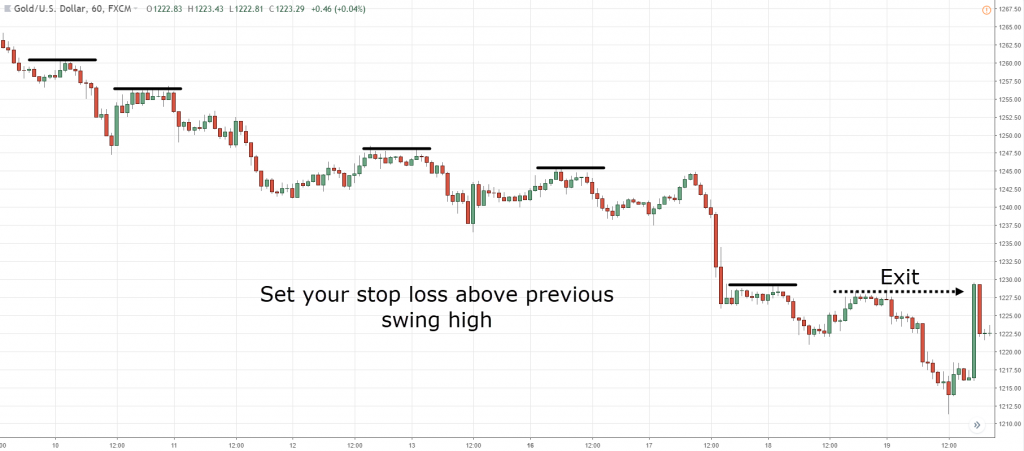
In a downtrend, you can use it to trail your stop loss above the previous swing high, until it gets broken.
Something like this…
This works best when price action is clean, with obvious swing highs and lows.
If price action isn’t too clean, this is when moving averages could help…
Moving average
I get a lot of questions by traders asking me, Rayner, which is the best moving average?
The truth is, there is no best-moving average.
You need to understand they’re simply tools to help with your trading.
So which moving average do I use?
You can consider using:
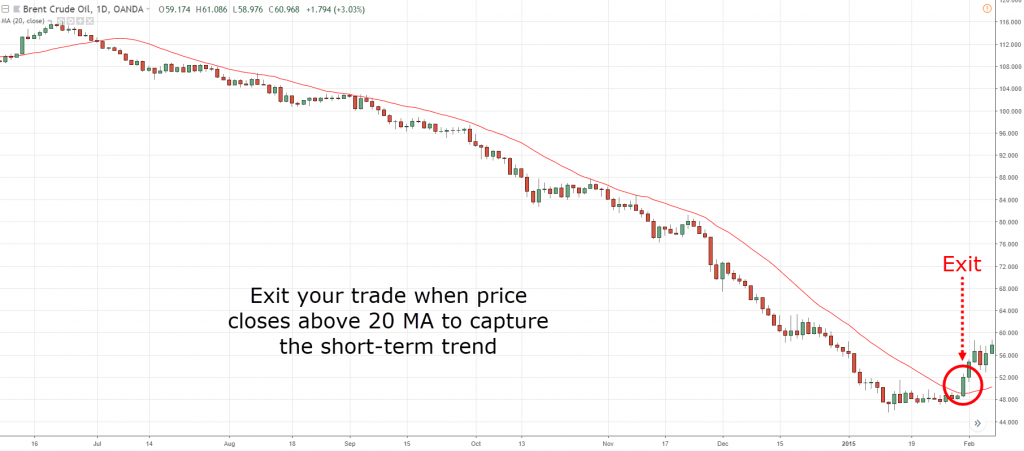
- 20ma if you want to ride the short-term trend
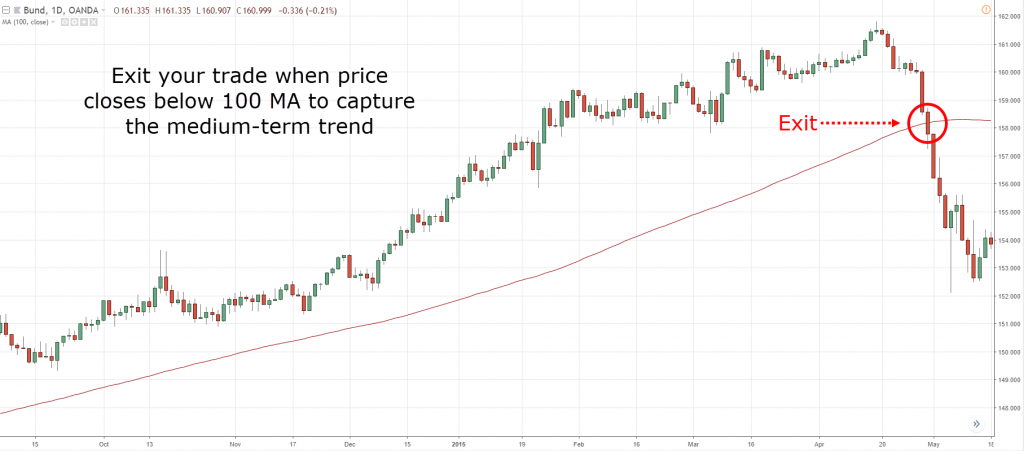
- 100ma if you want to ride the medium-term trend
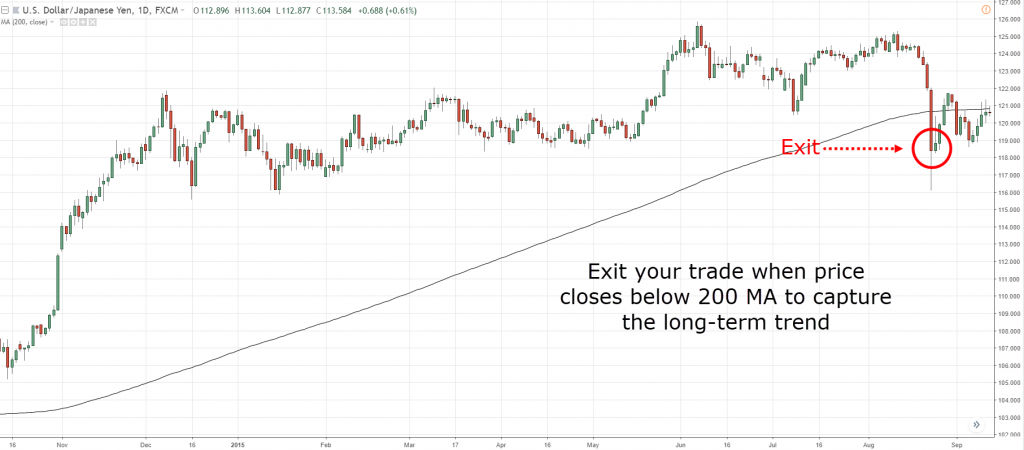
- 200ma if you want to ride the long-term trend
Here’re a few examples…
A short-term trend at (BCO/USD):
A medium-term trend at (DE10YEUR):
A long-term trend at (USD/JPY):
Or, you can use a moving average crossover to exit your trades.
Moving average crossover
You would use a faster-moving average against a slower moving average.
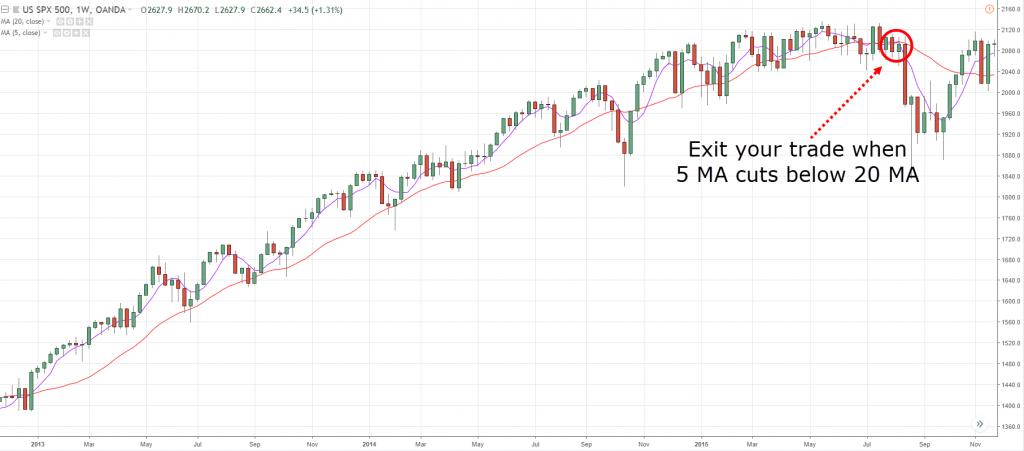
If a faster moving average cuts below the slower moving average, you exit your long position.
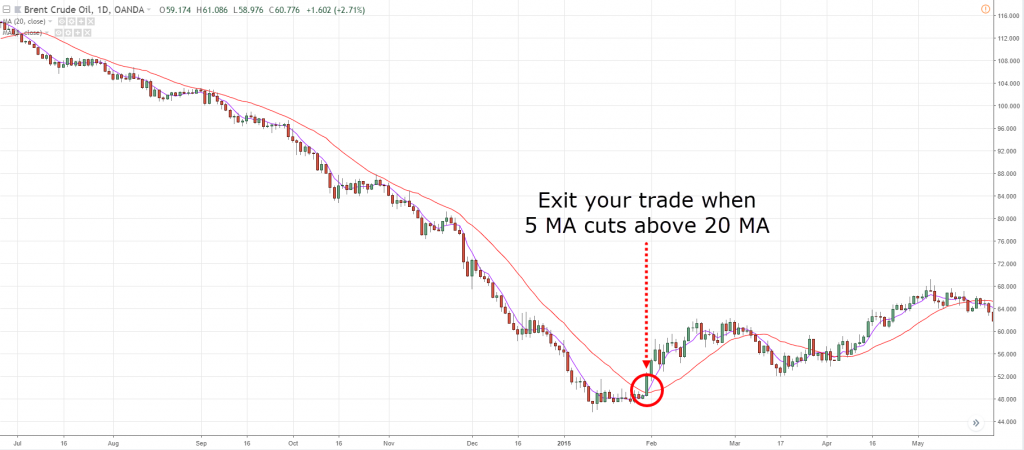
If a faster moving average cuts above the slower moving average, you exit your short position.
There’re endless permutations here, but for illustration purposes, I’m using 5ma & 20ma.
As shown below:
Moving average crossover is useful when the price has an ebb and flow to it.
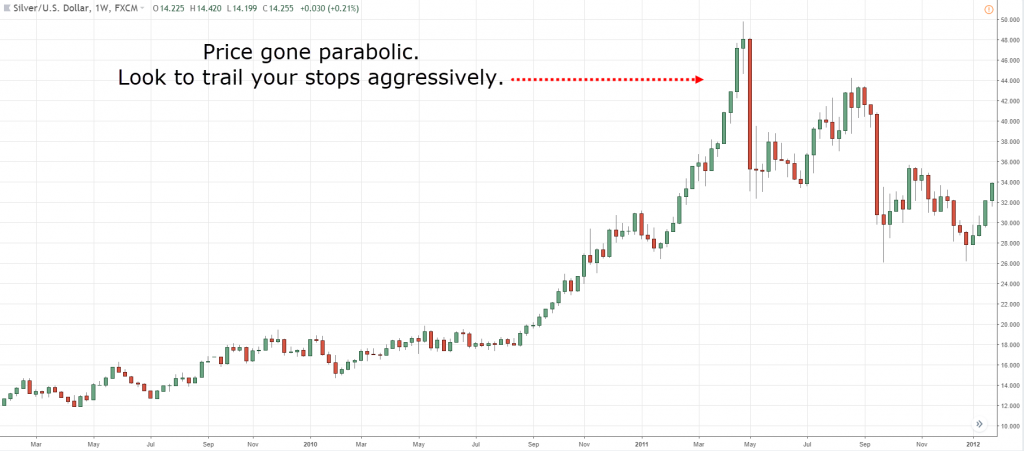
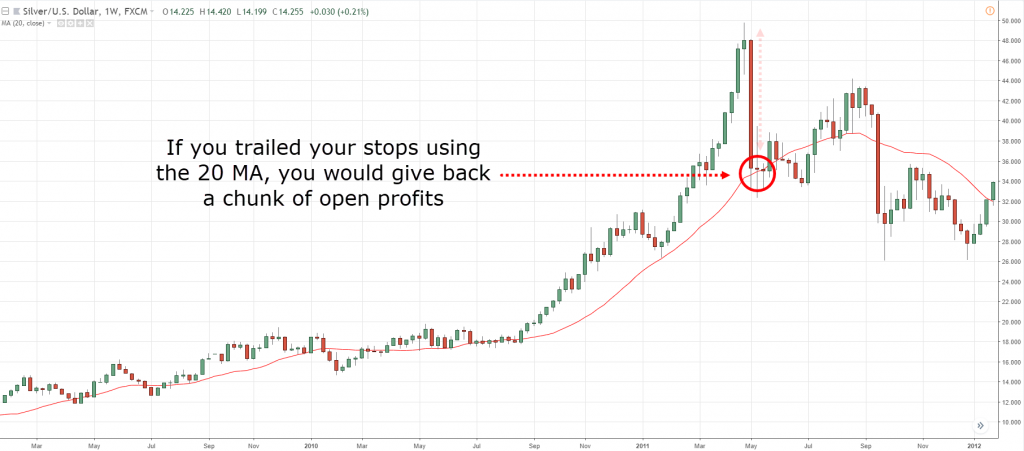
However, if the price goes parabolic, the moving averages will lag the market, and risk giving back a chunk of profits.
This is when you should consider trailing with…
X periods high/lows
X here is defined by you. You can use 1,2,3 etc.
If X is 1, you will trail below the previous day low.
If X is 2, you will trail below the previous 2 day low.
You get the idea.
So…
When the price goes parabolic, this is when trailing your stop loss with X periods high/lows can be useful.
Price is parabolic when you notice the range of the bars getting larger in the direction of the trend, and the angle is getting steeper.
This is what I mean:
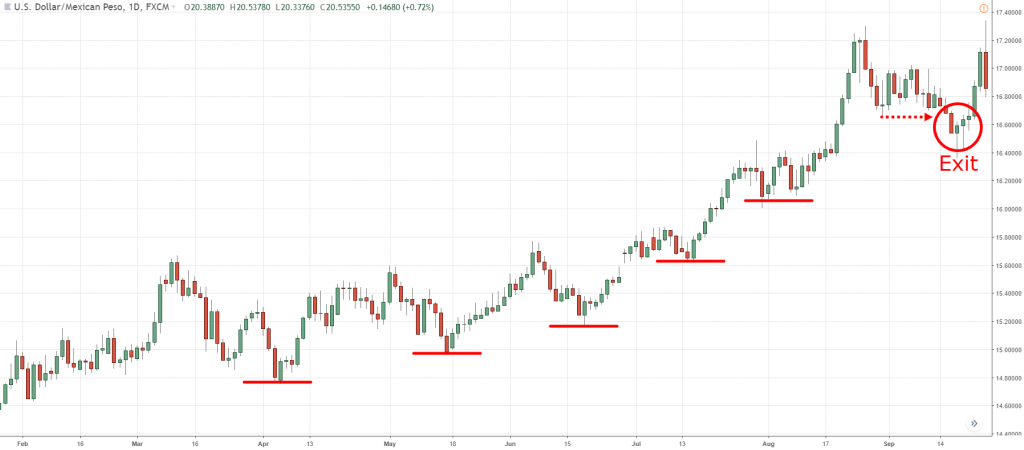
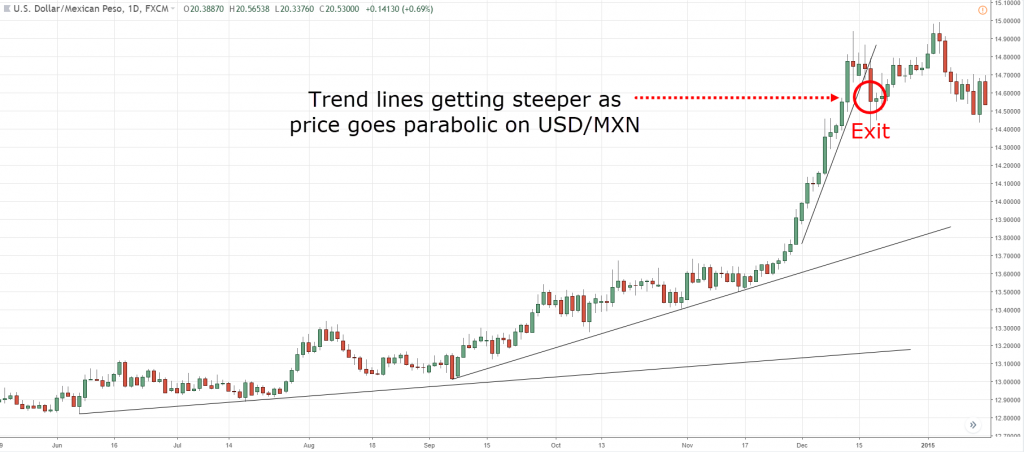
Parabolic moves can be subjective. One way you can determine is to use trend line, here’s how…
Trendline
A trend line helps identify the trend in the market by connecting the highs/lows.
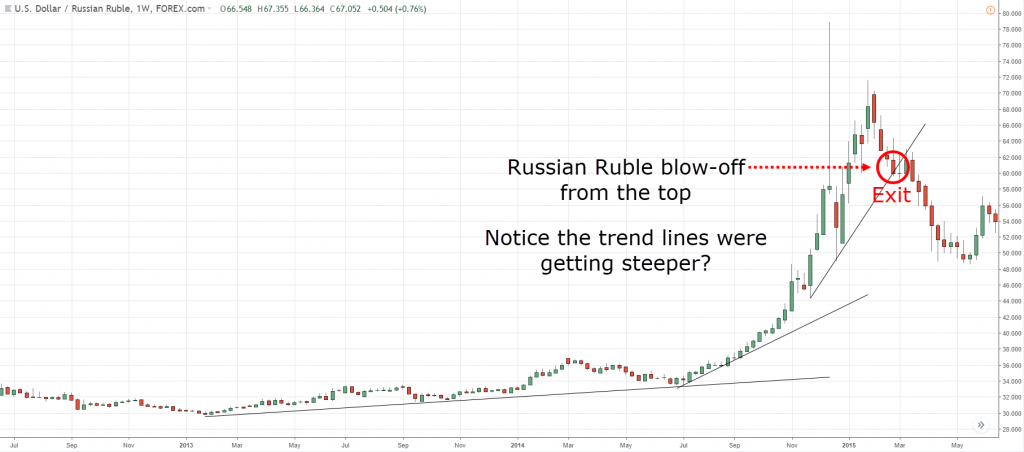
But when you start to re-draw your trend line because the trend is getting steeper, chances are, you’re in a parabolic move.
And when price breaks the recent trend line, you can look to exit your trade.
This is what I mean…
A parabolic trend on (USD/MXN):
A parabolic trend on (USD/RUB):
Here is a trade taken by Dan Zanger, that explains further:
Now…
The techniques taught earlier requires an element of discretion.
If you’re someone who prefers to exit their trades systematically, then the next technique may interest you.
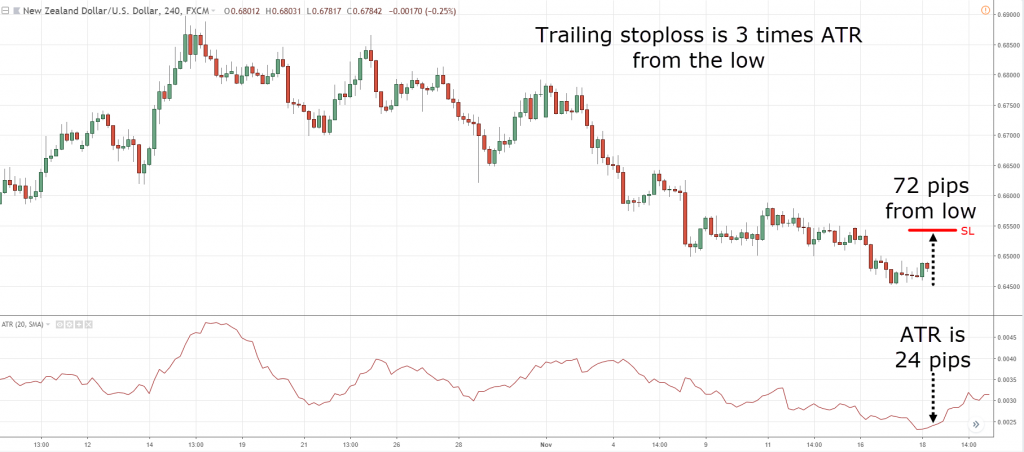
Average true range (ATR) from peak to trough
This approach is used by systematic Trend Followers who exit their trades based on price moving X ATR away from their peak/trough.
X can be multiple of 1,2,3 etc.
If X is 1, then your stoploss is 1 ATR away from the peak.
If X is 2, then your stoploss is 2 ATR away from the peak.
You get the point.
In his book, Following the Trend, Andreas Clenow uses 3 ATR away from the peak to trail his stop loss.
Here’s an example:
This approach would suit you if you’re trading systematically.
Now:
You’ve learned 6 ways to trail your stoploss for maximum profits.
You’re probably wondering…
What if I don’t want to trail my stoploss, can I have a fixed target profit instead?
Yes, you can.
And this is what you’ll learn next…
How to set a profit target to improve your trading consistency
By having a profit target, you will increase your winning rate, but at the expense of lower profitability.
If this is something for you, here’s 3 ways you can do it:
- Support & Resistance
- RSI indicator
- Fibonacci extension
Support & Resistance
Imagine:
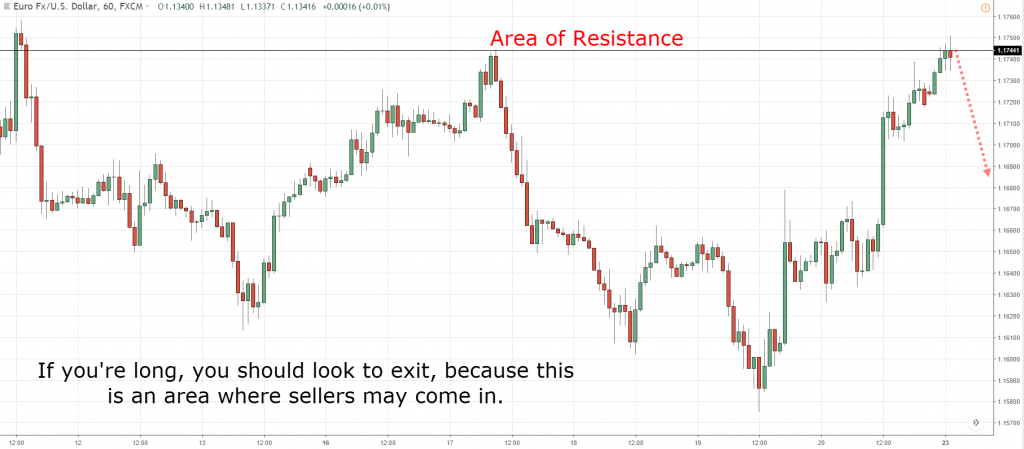
You’re long, where would seller come in?
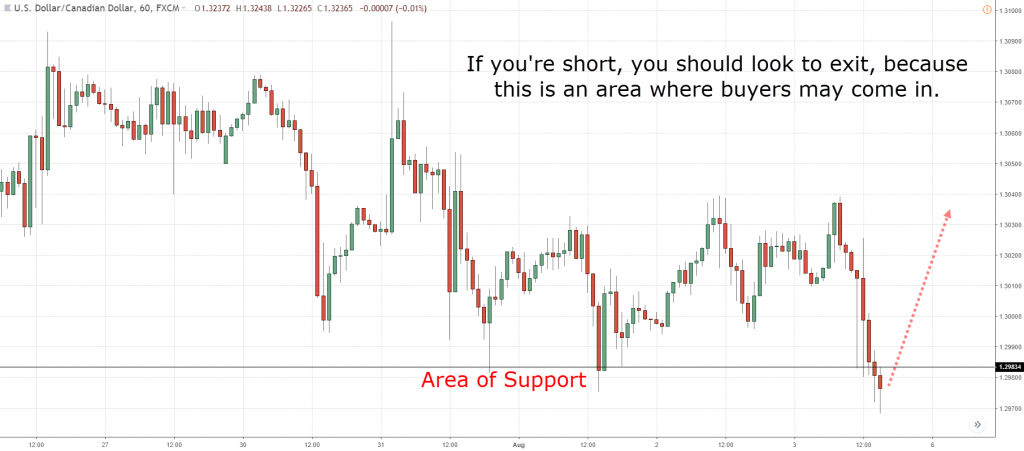
You’re short, where would buyers come in?
Here’s a clue…
Support is an area where there is potential buying pressure to push the price higher.
Resistance is an area where there is potential selling pressure to push price lower.
This means if you’re long, it would be prudent to take profits at the nearest resistance.
And if you’re short, it would be prudent to take profits at the nearest support.
An example:

RSI indicator
Or…
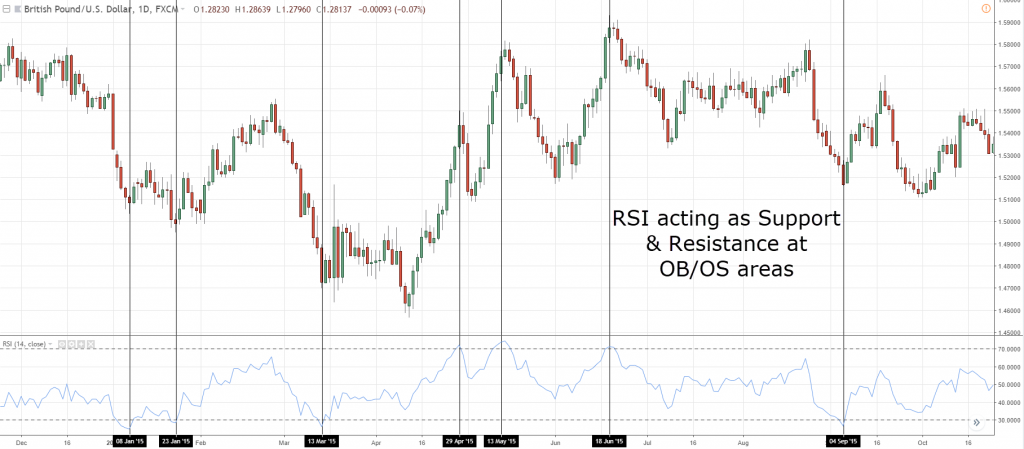
You can use RSI indicator to identify overbought and oversold areas (above 70 for overbought, below 30 for oversold). This can also act as Support & Resistance in the markets.
I’ve learned this technique from Steve Burns, in his book, Moving Average 101.
Here’s an example:
This approach works well when the market is in a range, or the trend is weak.
But what about trending markets?
This is when Fibonacci extension can be useful…
Fibonacci extension
The more popular extension levels are the 127, 162 and 200.
Watch the video below to learn how to use Fibonacci extension to set your profit target.
You’re probably wondering:
Rayner, can I take half my position at a fixed target and let the remaining ride the trend?
Of course, and this is how you do it…
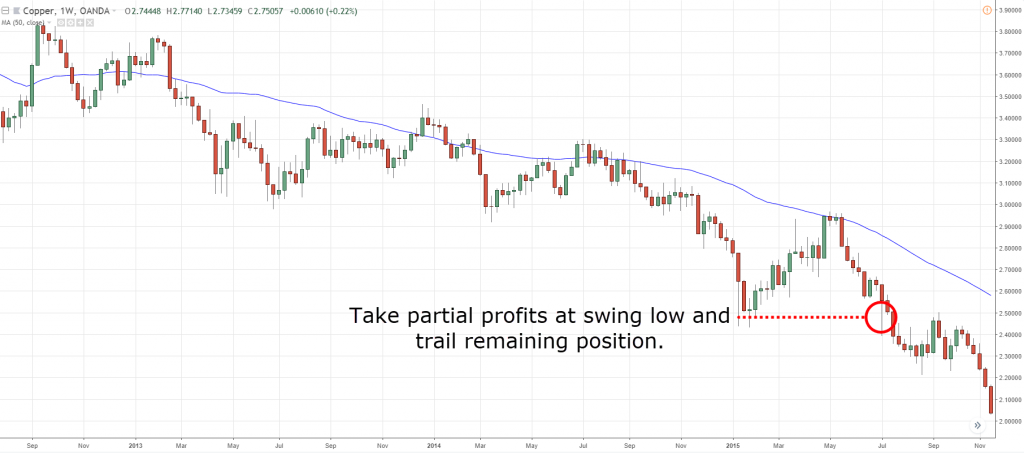
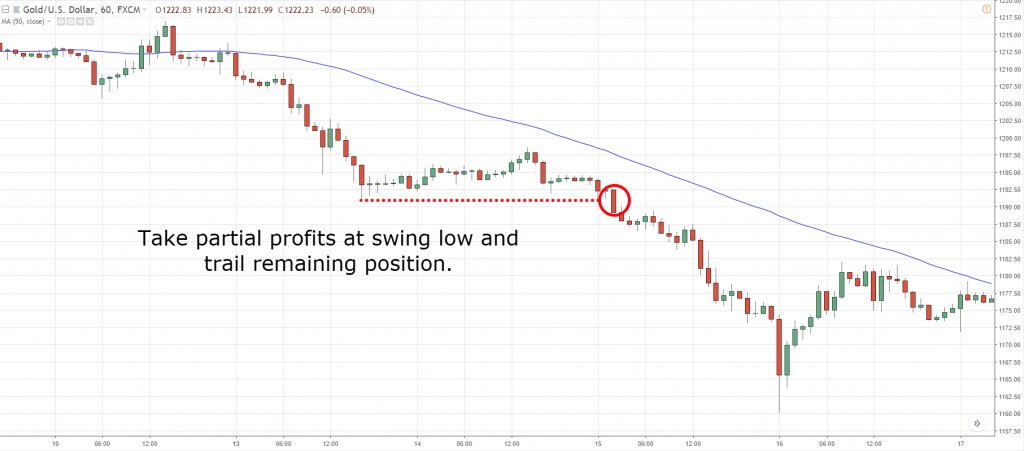
How to take partial profits and ride the trend?
In the book, The Art and Science of Technical Analysis, Adam Grimes explains how he exits part off his position at 1:1 risk reward, and let the remaining position ride.
This helps improve his trading consistency and gives him a smoother equity curve.
Here’s how you can do it:
- Take profit at the nearest Support & resistance
- Trail the remaining position using a trailing stop loss (like moving average)
It looks something like this…
- Improves your trading consistency
- Opportunity to ride a trend
- Easier on psychology as you’ve banked some profits
Cons:
- Lower profitability as you exit partial position
Frequently asked questions
#1: How can I trail my stoploss using moving average or its crossover?
You’ll exit the trade once the price closes beyond the moving average or when the moving average crossover forms against the direction of your trade.
#2: Do I need an EA (Expert Advisor) to trail my stop loss using moving average or its crossover?
Nope, you don’t need to use any EA to trail your stop loss. The moment the moving average crossover forms, you can manually exit your trade.
#3: Is there a best way on how to set stop loss or to exit a trade?
There’s actually no single best approach. You’ll have to figure out which approach suits you depending on your goals. For example, if you want to ride a trend, you can use a moving average. If you want to capture a swing, then you’ll use swing highs/lows as possible targets
Conclusion
You’ve learned a couple of ways on how to set proper stop loss—there are many ways you can exit your trades and there’s no right or wrong.
If you’re a trader who’s looking for trading consistency, then taking partial profits would suit you.
If you’re a trader who’s looking to increase his net profitability, then riding the trend with full position size would make sense.
If you want to discover high probability trading strategies, then check out High Probability Trading Strategy — A Complete Guide.
Blindly following another trader’s strategy isn’t going to work in the long run. Ultimately, you need to find an approach that suits your personality, beliefs about the market, and trading goals.
Now, here’s what I like to know…
How do you set your stoploss in trading?
Leave a comment below and let me know your thoughts…


RSI should only be used in regards to oversold/bought in a ranging market. In a trending market high/low RSI simply means a momentum move is about to take place and you probably want to ride the trend.
Hi Øyvind,
Thanks for stopping by.
You’re right. RSI works best in a range market, or when the trend is very weak.
In a strong trending market, it can remained OB and OS for long period of time.
Rayner
Hi Rayner,
Thank you very much for this post. It’s very useful. Now I more understand the concept of SL, even just to hear the first end last principle for SL, where and why you place it.
Good work man!! 🙂
Shlomi
Hey Shlomi,
Yes I believe this post is something that will improve your knowledge on using stoploss (I remember you were asking me about it on the breakout post).
Cheers
Rayner
Yes.. I asked you and I very appreciate that you remember it 🙂
You’re welcome bud 🙂
Hi Rayner. Thank you for this post. I learn much from it.
You’re welcome, Raymond.
Rayner
Hi Rayner
Thank you for sharing all of your thoughts are locking in gains Great Reading and learning
Best Wishes
You’re welcome, Rich.
best!
Hi Rayner,
Thanks for sharing this and all your other post. Pick up very good and useful tips on putting that sacred SL to protect our trading capital.
Good to have you sharing your experience in the community.
Thanks n Cheers! Fred
Hello Fred,
Thank you for your feedback. I’m glad to hear its helping you.
Don’t hesitate to let me know if you’ve got any questions, I’ll be glad to help.
Rayner
Dear Rayner,
Thank you so much for sharing as always.
A quick question, when you wrote about trailing stop to a MA, Crossover;
I was wondering do I need an EA to set it up or am I missing something?
Best regards,
Xephry
Hi Xephry,
You don’t need an EA.
The moment the moving average cross, you can manually exit the trade. Hope that helps!
Rayner
Dear Rayner,
Thanks for the prompt reply, I think I got it!
Cheers!
Xephry
You’re welcome, Xephry.
Cheers!
Hi Rayner, appreciate the bite-sized lessons as always. Thank you.
Regarding using these methods on stop losses, is there a particular EA you use regarding moving average and ATR stop losses or is there a way that it can be done automatically through the MT4 program? From my understanding the number of pips is the only setting allowed in MT4 for a trailing stop loss……
Hey Tim
I don’t use any EAs when trailing my stops. But I suppose you can code it if you want to…
Hi Rayner,
I have a question please bear with me for my ignorance, I am still learning the in/outs of trading.
In your post you have shown moving average graph on top of candle chart but on real world they are on 2 different windows can we have a scenario where we can dispaly both on the same window(chart) or I am missing something here?
Best Regards,
Rish
Hey Rish
I’m using MT4 as my charting platform and it works fine. You can try it.
Hi Rayner,
My name is Saurabh. I am a newbie in stock market. There are huge amount of knowledge spread on internet, because of this newbie like me are always searching for starting point . What are your recommendations to a newbie?
Thanks and Regards
Saurabh
Hey Saurabh
This is a good place to start your trading journey
https://www.tradingwithrayner.com/academy/
Hi Rayner,
I have a question about the execution of the Stop Loss using structure of the market.
We set a stop loss below a support ór under resistence but, when we exit? When the price touch the stop loss or when the price bar close under/below the stop loss?
Thanks you.
Both approaches can work.
But for the close approach, you might lose more than your initial risk if the price gaps beyond your stop.
Thanks you Rayner.
Some recommendation between both aproaches?
I am not able to decide wich is the best option because I always worry about being taken out the trade if the price comes back over the MA, Trend line, sopport etc (according to the chosen one in each case).
There’s no best approach.
You can try both and see which suits you better psychologically.
Hi Rayner
Do you still follow this rule of yours? ATR *2?
If yes, how did you come up with the factor of 2?
have you tried using *1 or even *1.5?
just curious why you chose ATR*2
kindly advise, thanks.
Hey Raymond
2 ATR is for riding the short-term trend.
The multiple of your ATR depends on the type of trend you want to ride. Longer term trend = larger ATR multiple.
Hi Rayner
I have found 3*ATR and trendline have worked the best for me in the past.
Thanks for sharing about different SL , the high/low strategy looks interesting.
You’re welcome!
Been 4 years in trading , you came a long at the right time , been profitable so far , thanks to your system ,my friend .
Awesome!
Hi sir, im bit overwhelmed with all those TAs..can you recommend newbie-friendly TA indicators applicable to cryptos.
more power!
Hey Glenn
You can check out the “education” link at the top to get started…
Thanks alot Rayner for your well written article. I am relatively new to Forex..am currently demo trading, however
i understand support and resistance..i have been practicing some indicators like Bollinger band, CCI, RSI, STOCKHASTIC, ADX, Moving Average ,Fibonacci Retracement etc…I am losing trades …what do i do?
This post will help… https://www.tradingwithrayner.com/profitable-trader/
Very helpful, Thank you!
Awesome to hear that!
Fibonaccio ratio is my best strategy I use, for consistency… Good article
Cheers
great learning specially for abiginner
Cheers
It awesome to learn from your materials.
I am hoping to take to take my trade to another level this year of wisdom
You’re welcome, I hope it helps!
Hi Rayner,
I am new to trading. Your posts , YouTube videos are giving great ideas to start trading with proper risk management. Still searching for a Broker …is it possible for you to recommend some?
Previous low or high
Thanks for sharing, Cephas!
I find that the education provided here is ultimate, if you are a beginner, it will help you to build your mindset as that of a professional trader, and if you are a seasoned trader you will realize after reading articles here, that this is really the extract of all your experience.
Thank you, Shailendra.
I appreciate it.
What you are doing for us is just awesome, Rayner! Thank you so much for all the great insights!
Cheers
You’re welcome!
Rayner my brother.
Let me start off by saying thank you a 5.1 trillion times, you are probably doing this just as a hobby but you’ve made so much positive impact to me.
Now, my question is between trailing stop loss & stop loss which do you recommend and why?
It depends on your needs.
A stop loss protects your downside.
A trailing stop loss allows you to ride a trend.
Nothing has amazed me like the cross over , and moving average , trailing stop loss’s
It’s awesome… thank u Rayner for making these clearer, I have discovered was trading in ignorance… thank u again
Cheers
It’s Awesome, Thank you Rayner you have cleared many doubts of price actions, trend and Stop losses.
Glad to hear that, Pooran!
That’s great to hear, Pooran!