I first learned about the Cup and Handle pattern from the book…
How to Make Money in Stocks: A Winning System in Good Times and Bad.
This is a powerful chart pattern that’s used by stock traders to capture explosive breakout moves — where the stock price could increase 1000+% within a few years.
Insane right?
That’s why in this trading strategy guide, I want to dive deep into the Cup and Handle pattern so you, yourself, can find your own “monster” breakout trades.
So here’s what you’ll learn:
- What is the Cup and Handle pattern and how does it work
- Don’t make this common MISTAKE when trading the Cup and Handle pattern…
- How to better time your entries when trading the Cup and Handle pattern
- How to set a protective stop loss so you don’t lose everything on one trade
- Cup and Handle: How to exit your winners and ride massive trends
- Cup and Handle: How to capture a swing for consistent profits
- Advanced trading technique: How to enter the breakout BEFORE the breakout
Are you excited?
Then let’s get started…
What is the Cup and Handle pattern and how does it work?
The Cup and Handle pattern is a bullish reversal chart pattern (it could be after a correction or a long-term downtrend).
There are 2 parts to it:
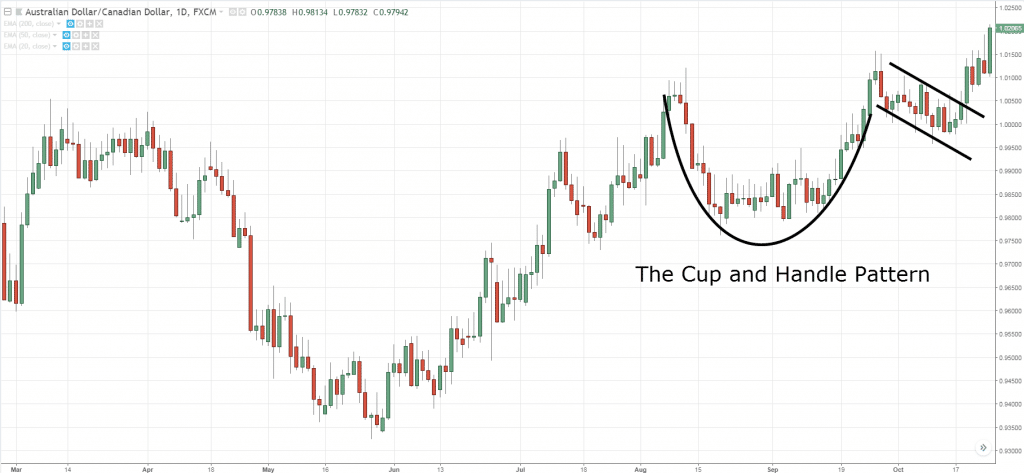
The Cup — the market show signs of bottoming as it has bounced off the lows and is making higher highs towards Resistance
The Handle — a tight consolidation is formed under Resistance
Cup and Handle recognition (an example):
Here’s the idea behind the Cup and Handle pattern.
After the Cup is formed, the market has shown signs of bottoming as it makes higher lows towards Resistance.
Next, how the price reacts at Resistance is important because it tells you whether there is still selling pressure lurking around.
Now, A cup and handle invalidation would be if you see a large sell-off from Resistance, as it tells you the market is not ready to head higher.
But, if you noticed that the price is holding up nicely at Resistance, then it’s a sign of strength as it tells you buyers are willing to buy at these higher prices.
Finally, when the price breaks out of Resistance, the cup and handle pattern is “confirmed”, and the market could move higher.
Pro Tip:
The best cup and handle patterns have a shallow retracement on the handle (not more than 1/3 of the cup).
Don’t make this common MISTAKE when trading the Cup and Handle pattern…
Here’s the thing:
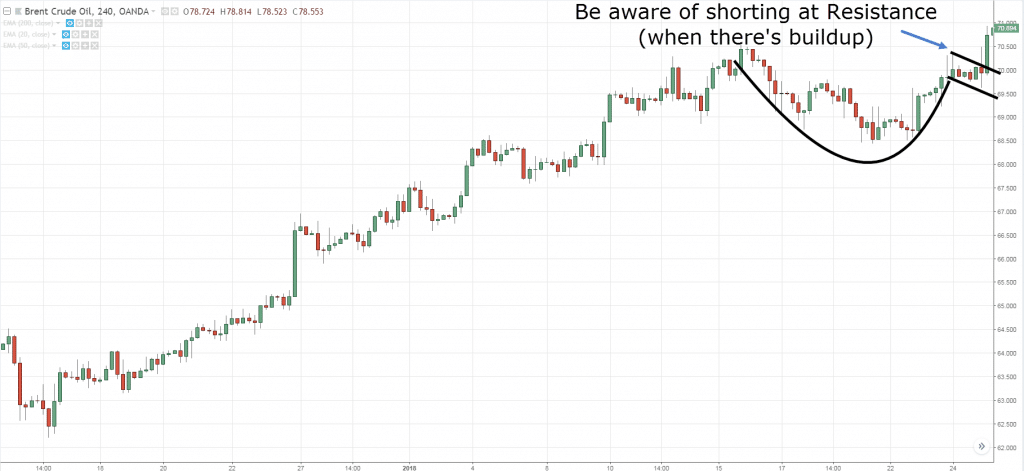
To form the handle, the price must approach Resistance and form a tight consolidation (otherwise known as buildup).
At this point, many traders would think to themselves…
“The price is at Resistance, time for me to go short.”
Now, that’s fine if the price made a strong momentum move into Resistance and it gets rejected strongly.
But, if the price approaches Resistance and forms a buildup, or it made higher lows into Resistance, then you want to be careful.
Because this is a sign of strength telling you there are buyers willing to buy at these higher prices.
The last thing you want to do is short the market because it’s likely to breakout higher.
Here’s an example:
This is a universal concept, and it doesn’t just apply to Cup and Handle pattern.
So whenever you see a buildup of higher lows into resistance, it’s a sign of strength.
Cup and Handle chart pattern: Where do you enter your trade?
The Cup and Handle pattern confirmation comes when the price breaks above the “handle” — and that’s where you can enter a trade.
While a Cup and Handle invalidation comes when the price breaks below the “handle.”
Still, there are 2 things to consider:
- Do you want for a close?
- Do you place a buy stop order?
Let me explain the pros and cons of both approaches…
Do you wait for the candle to close before entry?
The good thing about waiting for the close is it’s less prone to false breakout.
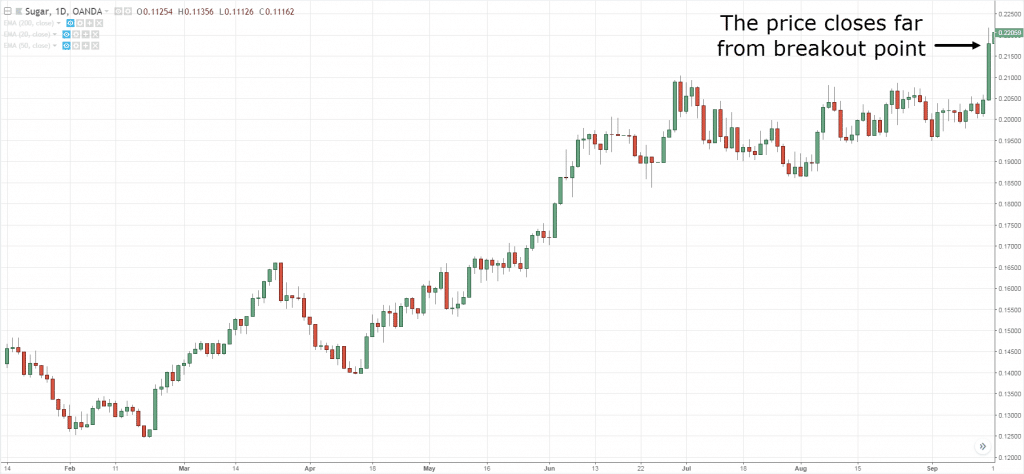
However, sometimes, the market closes much higher and you get a poor cup and handle pattern target entry point. This results in a wide stop loss and a smaller position size on your trade.
An example:
Do you place a buy stop order?
The good thing with a buy stop order is your entry will just be above the highs of the “handle”, and if the breakout is real, that’s one of the best prices to get in.
However, the market could do a False Breakout and you are long the highs.
Now you might be wondering:
“Which approach is best?”
Well, there’s no best approach.
You should go with the one you’re most comfortable executing — this results in less error and more consistency in the long run.
Cup and Handle chart pattern: Where do you place your stop loss?
Now whenever I place a stop loss, it always follows this rule:
“Your stop loss should be placed at a level where if the market reaches it, your trading setup is invalidated”.
This means when you put on a trade, it’s based on a trading setup (or chart pattern).
And when the trading setup is “destroyed”, the reason to stay in the trade is no more.
So, the question is…
Where will the Cup and Handle pattern be “destroyed”?
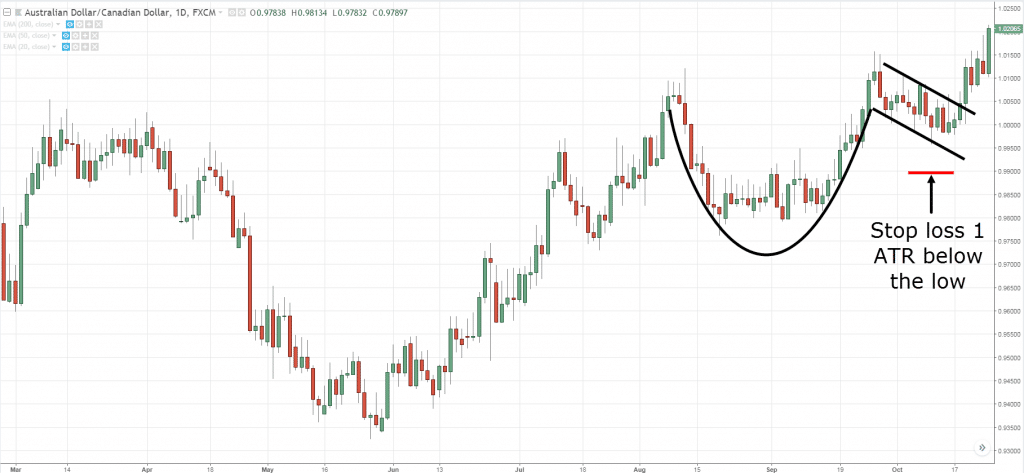
If you ask me, it’s when the price breaks below the low of the handle, thereby invalidating the Cup and Handle pattern.
Now, you don’t want to put your stop loss at the exact low of the handle because the market could trade into that area of value and reverse higher.
Instead, give it some buffer below the handle like 1 ATR below it.
Here’s an example of where to set your cup and handle pattern target stop loss:
Does it make sense?
Great!
Then let’s move on…
Cup and Handle chart pattern: How to exit your winners and ride big trends
As you know:
The Cup and Handle is a bullish reversal chart pattern.
This means it could be the start of a NEW uptrend and the last thing you want to do is cut your profit short.
So what am I suggesting?
Ride the trend!
And here are 2 common techniques you can use:
Here’s how it works…
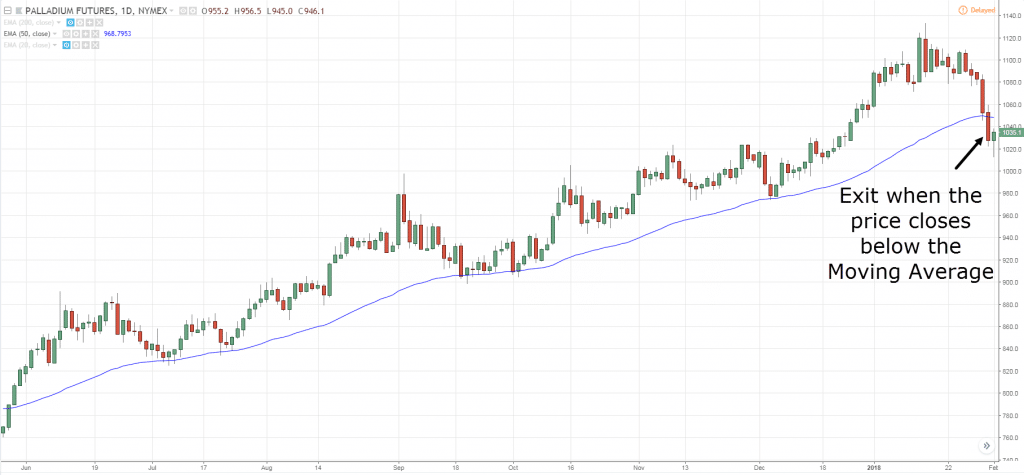
1. How to use Moving Average and ride big trends
Here’s how…
In a trending market, the price can remain above a Moving Average for a long period of time.
So, what you’ll do is trail your stop loss as the price remains above the Moving Average — and exit when the price closes BELOW the Moving Average.
Here’s an example:
You’re probably wondering:
“Which period do I use?”
The general guideline is this…
20-period Moving Average to ride the short-term trend.
100-period Moving Average to ride the medium-term trend.
200-period Moving Average to ride the long-term trend.
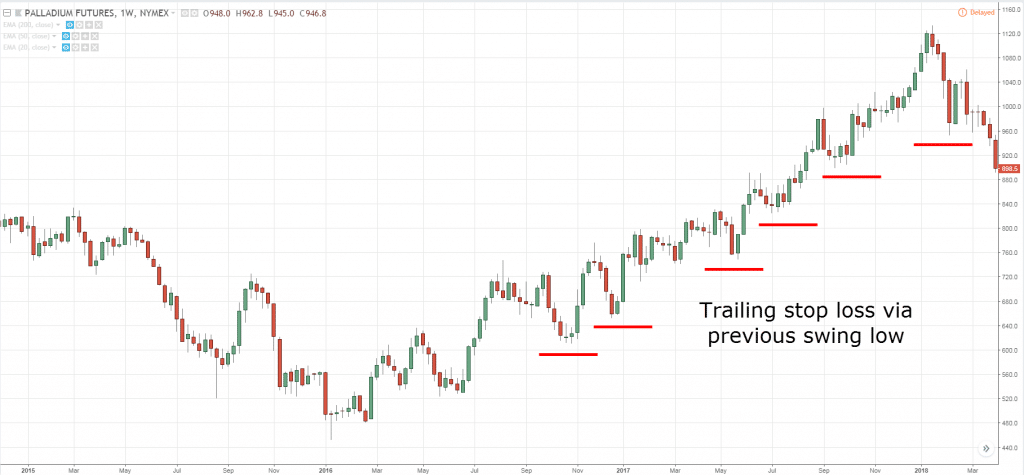
2. How to use Structure and ride massive trends
Here’s the thing:
For a trend to continue higher, it MUST make higher highs and lows.
If it doesn’t, then chances are it’s in a range or about to reverse lower.
With this in mind, you can trail your stop loss on the previous swing low because if the market wants to continue higher, the previous swing low shouldn’t be “broken”.
Also, give your stop loss some buffer below the swing low as you don’t want the price to breach the lows, and only to reverse higher.
Here’s what I mean:
Next…
Cup and Handle chart pattern: How to capture a swing for consistent profits
Now, if riding trend is not your thing, then you can capture a swing.
If you don’t know what a swing is, it means capturing “one move” in the market, and that’s it.
And usually, you exit your trades just before the opposing pressure steps in.
So for example:
If you’re long, you want to exit your trades before the swing high or Resistance.
If you’re short, you want to exit your trades before swing low or Support.
If you trade chart patterns, you want to exit your trade when the pattern is completed.
So, how do you know a chart pattern is completed?
By using the price projection technique.
Here’s how it works for the Cup and Handle chart pattern:
- Identify the distance from the high to the low of the cup
- Project the distance from the breakout level and that’s your cup and handle pattern target profit
An example…
Price projection on XAG/USD Daily:
Great!
I’ve got one last trick for you…
Advanced trading technique: How to enter the breakout BEFORE the breakout
So…
The idea behind the Cup and Handle pattern is to trade the breakout when the price breaks above the “handle”.
But imagine this:
What if you can go long before the price breaks out higher, how much more profitable would it be for you?
And is it possible?
Heck yes!
That’s why I want to introduce to you this advanced technique: The Pre Breakout.
Here’s how it works:
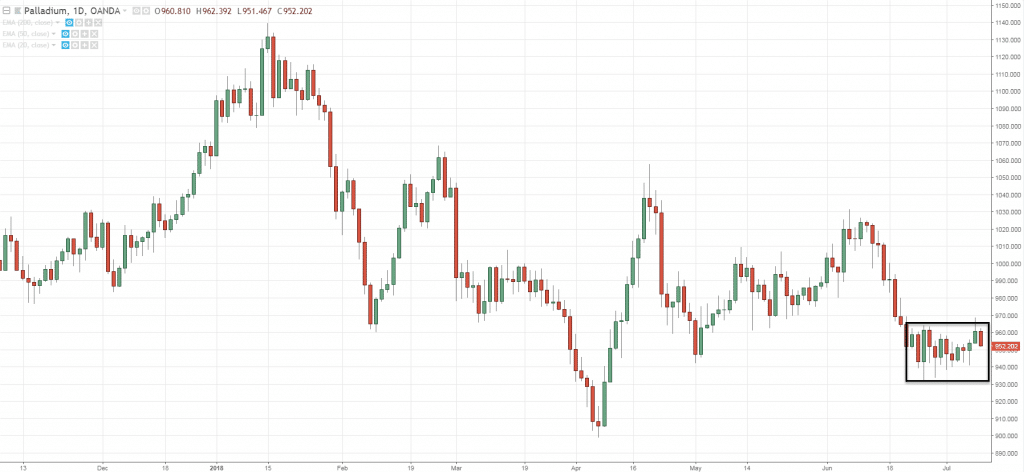
- Pay attention when the handle is being formed (the tighter the volatility contraction, the better)
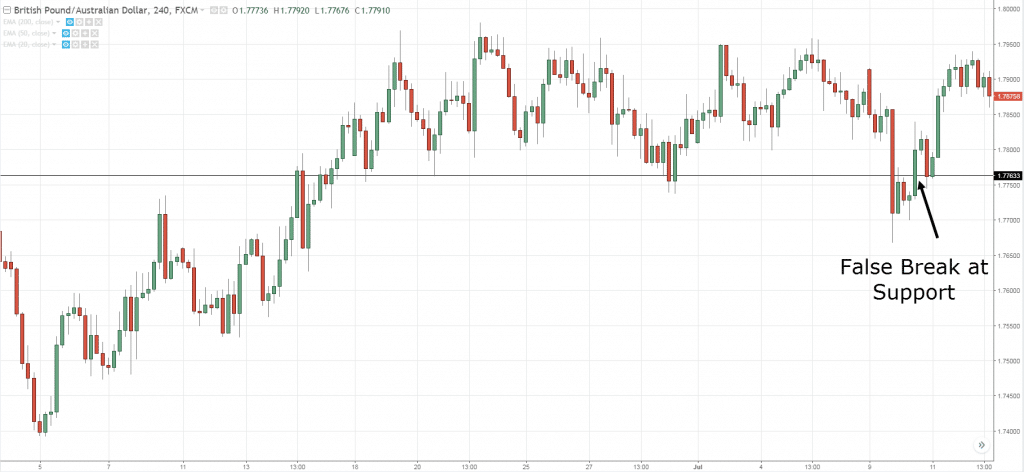
- Go down to a lower timeframe (a factor of 4 to 6) and look for a False Break at Support
- If there’s a False Break at Support, go long with a stop loss 1 ATR below the lows
Here’s an example: A volatility contraction on the higher timeframe
And on the lower timeframe, there’s a False Break at Support which offers a long entry…
If you want to learn more, go check out this training below…
https://www.youtube.com/watch?v=cEjpVThpfcw
Frequently asked questions
#1: Is the cup and handle pattern more of a continuation pattern or a reversal pattern?
In my opinion, the cup and handle pattern can be both a continuation pattern and a reversal pattern.
But in the context of a reversal, I’ll like the duration of the candles to be 80 candles or more.
#2: Can you explain more on what you mean by “a factor of 4 to 6” for multiple timeframes?
For example:
If you’re entering on the 5-minute timeframe, then a factor of 6 would be, 5 multiply by 6, which gives you the 30-minute timeframe. That’s what I mean by a factor of 4 to 6. That’s useful to define your higher timeframe.
Another example:
If you’re entering on the 4-hour timeframe, then a factor of 6 would be, 4 multiply by 6, which gives you 24 hours, and that’s the daily timeframe.
#3: Does the cup and handle pattern appear on most of the timeframes?
Its concept can be applied across markets which are liquid and across timeframes when the market is liquid as well.
Conclusion
So here’s what you’ve learned in this Cup and Handle trading strategy guide:
- The Cup and Handle is a bullish reversal chart pattern which can signify the start of a new uptrend
- A common entry technique is to trade the break of the handle and go long
- You can set your stop loss 1 ATR below the handle so you don’t get stopped out prematurely
- I suggest trailing your stop loss as the price moves in your favor so you can ride the move higher
- The Pre Breakout technique allows you to go long before the breakout occurs. This is done by identifying a False Break on the lower timeframe
Now here’s my question to you…
What do you think of the Cup and Handle chart pattern?
Leave a comment and share your thoughts with me below.



It’s really helpful sir, thanks
You’re welcome!
Interesting & helpful.thanx Ryner.
My pleasure!
very interesting
cheers
Clear explanation..thanks Reyner.
You’re welcome!
Very nice and we’ll explained by u
You cleared all my doubt in this pattern
Now I will more eager to trade in cup and handle pattern
Thank you ryner . U r inspirational
Am getting more confident by learning from you
#inspiratonalteo
Awesome to hear that!
Dear Rayner, Thanks a lot for your sharing. Precise and clear. I agree with Sanjay, it add-on to my confidence level to really study the chart pattern trading technic. TQ Rayner
This is a good thing to apply. Thanks for the information. Very usefull.
My pleasure 🙂
I’ve just come across your work – since last week’s online trading summit – and it’s outstanding. This piece is no exception.
Just one minor point. Is it fair to say that C & H is more often a continuation pattern rather than a reversal pattern?
It can be both. For trend reversal, the duration of the cup would be longer.
Factor 4 or 6:
You mean to say factor of higher time frame. (Like 4 or 6 hrs lower time frame for analysing 1 Day time frame.)
Example, if 15mins timeframe.
A factor of 4 will be 1 hour (15mins * 4).
hey hey my friend! this is awesome thanks
cheers
thank you for awesome trick, but where is the entry point?
on Monthly chart can I consider daily as a lower time frame?
The weekly might be more appropriate.
You can wait for the close or enter with a buy stop order above the handle.
Thank you for reply, entry above the handle is after breakout, where we can entry in pre-break out.
what level to entry on pre breakout and stop level.
appreciate your support.
You can watch the video on the pre-breakout as I believe it’ll answer your question.
Thank you very much Rayner for sharing adv technique
Hi Rayner,
Useful guide, it’s definitely a pattern to always be watching for.
Although I do think this type of pattern will almost always appear on longer term (weekly/monthly) charts vs 1min/15min and because of this can often signal longer lasting moves. Has your experience been the same?
It appears across most timeframes but the higher timeframe one lasts longer.
Hey.. Amazing as usual.. Clear and comprehensive.. Thanks mate
You’re welcome, Rajesh!
Excellent article and superbly put together. No one can explain how to trade cup and handle pattern better that way you have explained in this short article. A complete strategy. Entry Exit and stop loss. Awesome. Thanks.
You’re welcome!
Thanks rayner great work . But i have a question you say before if you are trading on the x time frame you shouldn’t change it and now you say that we have to move to lower timeframe to see if the breakout is real or not
You can go down to the lower timeframe and analyze but it may or may not increase the odds of a breakout working out.
It’s best to have a fixed set of rules to trade breakout and then just trade it when it happens.
Over analyzing usually complicates things.
Rayner is one of the best teacher in Forex Training. Thank for your knowledge.
Thank you for your kind words!
good,❤❤❤.very heplful,thank you very much
My pleasure!
Your thoughts are so helpful…my firsr time to know about this cup and handle pattern…so easy to follow with the support of your examples..thanks Rayner
You’re welcome!
How do I get rid of the spin to win?
I have been really trying to understand this chart pattern and feels great to have that aha” moment because of your simplicity thank you Rayner
Awesome to hear that!
@Rayner I received so much enlightenment on this video
1 Cup and chats patterns is the starting of new uptrend (point number one)
2 one there is lost of memento on the down trend ,I will keep watching if cup and handle will form,
Wow,wow
Cheers and glad to help!
Thanks man , one of the best articles on trading the cupnhandle pattern. If you guys wanna see some cups getting completed right now, go open the bitcoin ethereum and xrp charts.
Once again thanks Rayner!
You’re welcome, Flv!
if wekkly& Daily trend(price is above 20& 50 MA but below 200MA) is down ,but Cup & Handle formed in Daily chart ,will it become valid??
Rayner your knowledge has helped me in finding Trends & how to trade charts. I am so thankful to you.
Hey Ram,
I’m so glad to hear that!
Thanks for sharing this trading startegy. It follows with the price action trading technique taught.
I don’t get how you can use previous lows as a trailing stop loss if you are going long.
I can understand using the LAST low for a stop loss.