The secret to reading candlestick chart is…
Candlestick pattern.
You’re thinking:
“Rayner, is this some kind of lame joke?”
Nope.
I’ll explain…
When you learn a new language, what do you start with?
The words, right?
Because you can’t form a sentence without understanding the words.
And it’s the same for trading!
You can’t read a candlestick chart without understanding candlestick pattern.
So, the first thing you’ll learn is how to read candlestick patterns like a professional trader — even if you have zero trading experience.
(Or if you prefer, you can watch this candlestick chart tutorial training below…)
What is a candlestick pattern and how does it work?
Here’s the thing:
A series of candlestick patterns form a candlestick chart.
So, before I dive deep into this candlestick chart tutorial, you must first know the basics of a candlestick pattern.
Let’s get started…
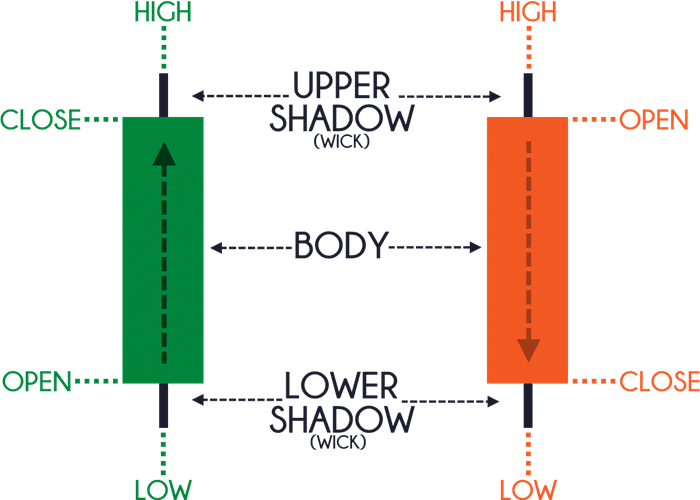
A candlestick pattern has 4 data points:
Open – The opening price
High – The highest price over a fixed time period
Low – The lowest price over a fixed time period
Close – The closing price
Here’s what I mean:
Remember…
For a Bullish candle, the open is always BELOW the close.
For a Bearish candle, the open is always ABOVE the close.
That information is the main foundation for reading candlestick chart patterns.
Candlestick analysis: How to read candlestick chart and understand any candlestick pattern without memorizing a single one
Here’s the deal:
There are hundreds of candlestick patterns out there.
And it’s silly to memorize every single candlestick pattern because you’ll “burn” yourself out.
Instead, I’ll teach you a trading hack that allows you to understand any candlestick pattern without memorizing a single one.
Sounds good?
Here’s how…
Every time you see a candlestick pattern, you want to ask yourself these 2 questions:
- Where did the price close relative to the range?
- What’s the size of the pattern relative to the other candlestick patterns?
These two questions are what makes complete candlestick patterns.
So let me explain…
1. Where did the price close relative to the range?
This question lets you know who’s in control momentarily.
Look at this candlestick pattern…
Let me ask you…
Who’s in control?
Well, the price closed the near highs of the range which tells you the buyers are in control.
Now, look at this candlestick pattern…
Who’s in control?
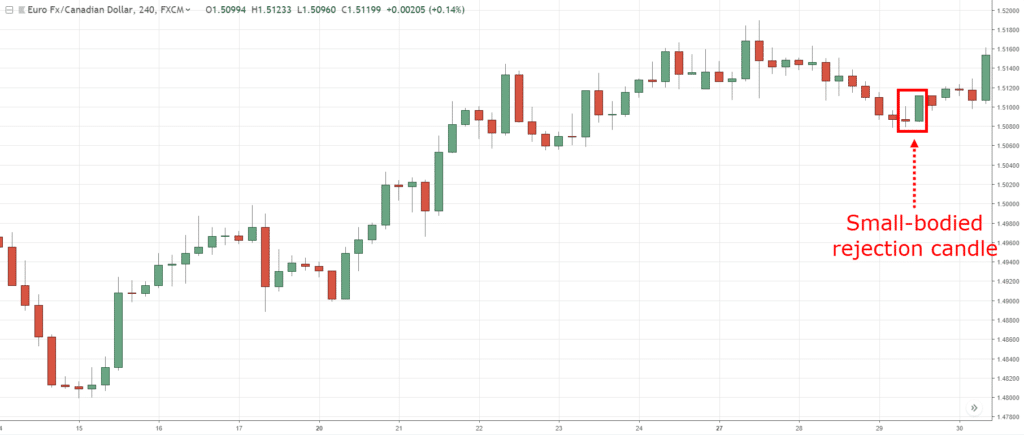
Although it’s a bullish candle the sellers are actually the ones in control.
Why?
Because the price closed near the lows of the range and it shows you rejection of higher prices.
So remember, if you want to know who’s in control, ask yourself…
Where did the price close relative to the range?
Once you get to know who’s in control, every candlestick chart patterns you see will be easier to spot and interpret.
Next…
2. What’s the size of the pattern relative to the other candlestick patterns?
This question lets you know if there’s any strength (or conviction) behind the move.
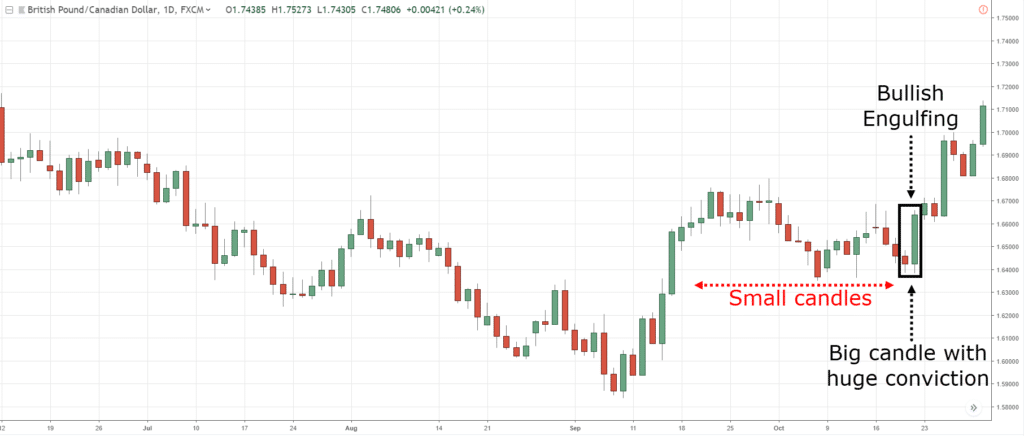
What you want to do is compare the size of the current candle to the earlier candles.
If the current candle is much larger (like 2 times or more), it tells you there’s strength behind the move.
Here’s an example…
And if there’s no strength behind the move, the size of the current candle is about the same size as the earlier ones.
An example…
This is powerful stuff, right?
This will pretty much let you know if it’s a complete candlestick patterns or not!
And we’re just getting warmed up.
Let’s move on…
How to analyse candlestick chart and read different market conditions (uptrend, downtrend, and range)
Recall:
A candlestick chart is simply a series of candlestick patterns.
But how do you read a candlestick chart?
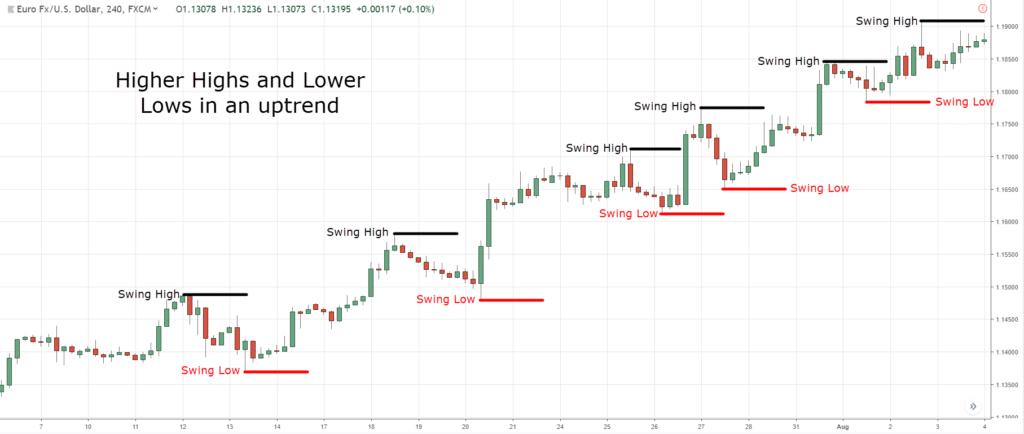
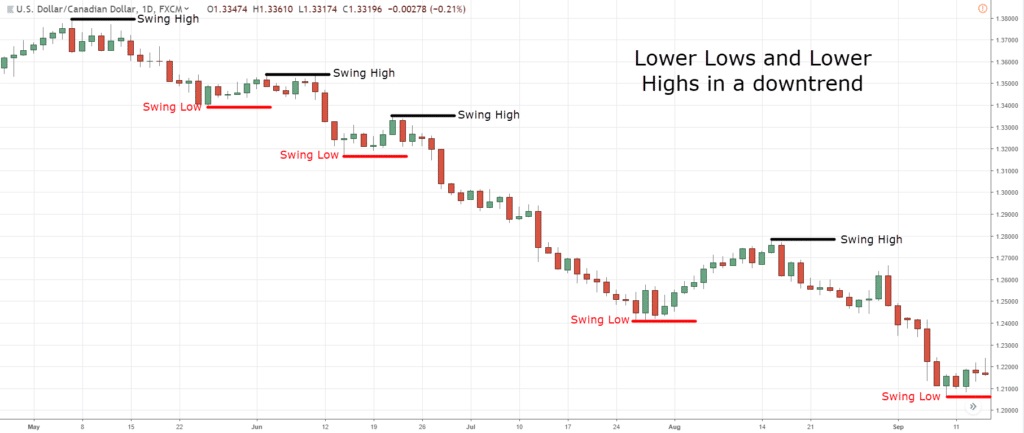
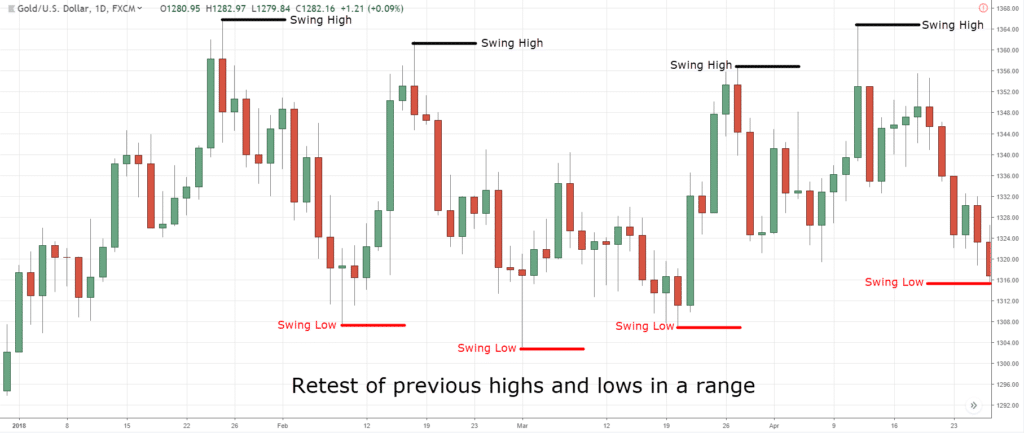
- Identify the major swing highs and lows on the chart.
- Then watch if the swing points are moving higher, lower, or at a similar level
And it’s likely to be in 1 of 3 situations:
- The swing highs and lows are moving higher, and an uptrend
- The swing highs and lows are moving lower, and a downtrend
- The swing highs and lows are of similar height, a range
Here’s an example…
An uptrend in EUR/USD 4-hour:
A downtrend in USD/CAD Daily:
A range in XAU/USD Daily:
That, my friend, is how to read candlestick charts.
Sounds good?
Pro Tip:
A major swing high/low will “stick out” in your face like a red bikini babe.
You’ll spot it easily.
If you’re struggling to find it, then it’s probably not a swing high/low (or you don’t like girls).
Candlestick chart analysis: How to identify strength and weakness in the markets so you don’t get caught on the wrong side of the move
Here’s the thing:
The market doesn’t move in one straight line.
Instead, it goes…
Up and down, up and down, up and down, right? (Something like that)
And you can classify this “up and down” pattern into:
- Trending move
- Retracement move
This is important, so let me explain…
Trending move
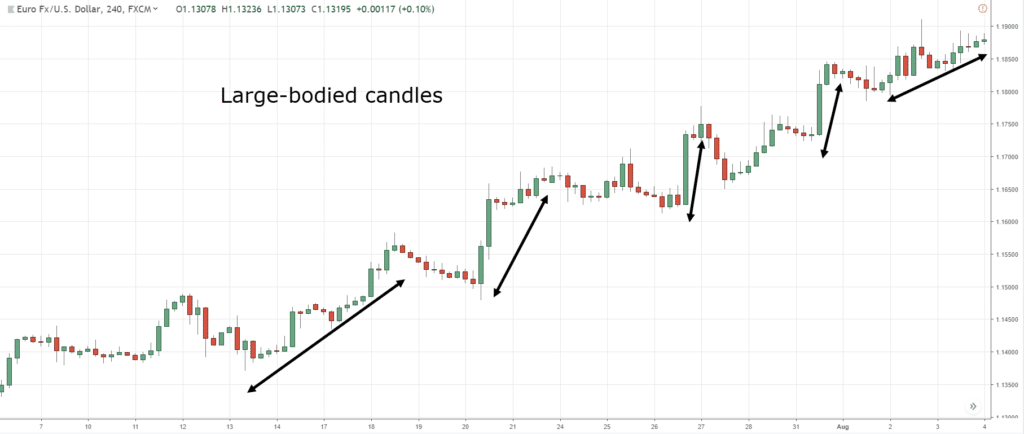
A trending move is the “stronger” leg of the trend.
You’ll notice larger bodied candles that move in the direction of the trend.
An example:
Retracement move
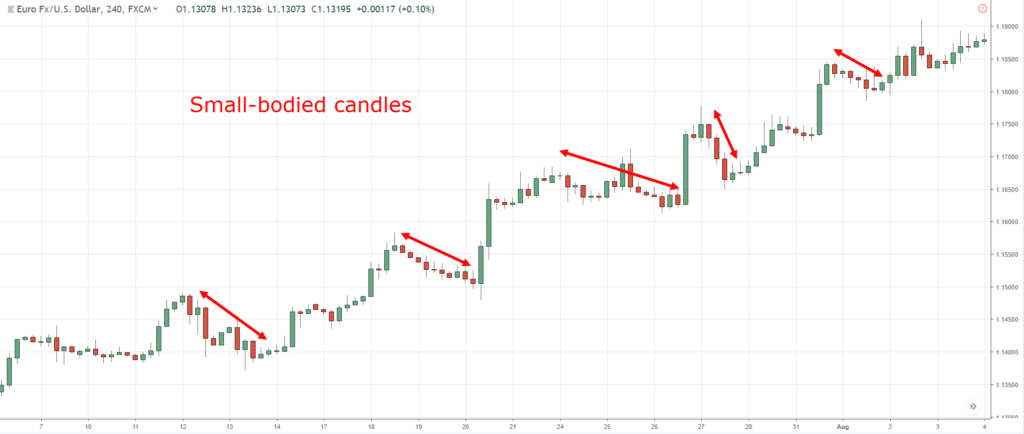
A retracement move is the “weaker leg of the trend.
You’ll notice small bodied candles that move against the trend (otherwise known as counter-trend).
An example:
You might be wondering:
“Why is this important?”
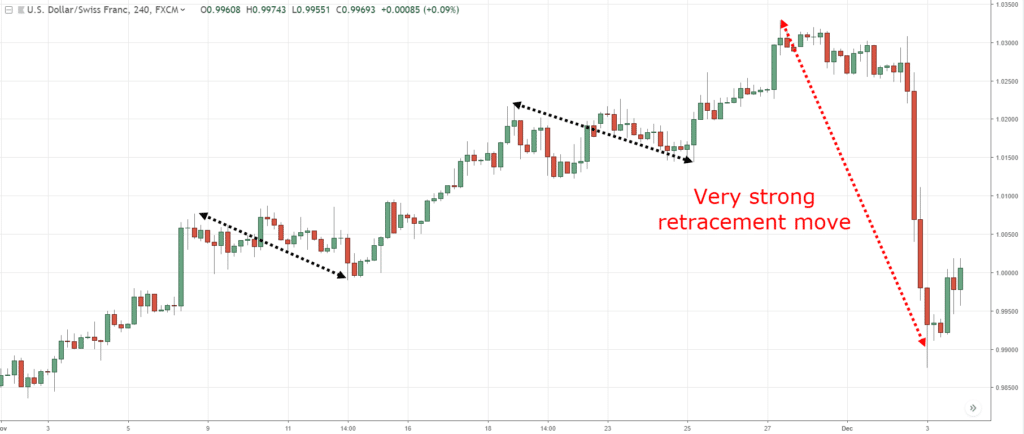
Because in a healthy trend, you’ll expect to see a trending move followed by a retracement move.
But when the trend is getting weak, the retracement move no longer has small bodied candles, but larger ones.
This tells you opposing pressure is stepping in.
Here’s what I mean…
And when you combine this with another technique I’m about to show you, you can pinpoint market turning points with deadly accuracy.
Read on, I’ll tell you more…
How to “predict” market turning points with deadly accuracy
Let me ask you…
Would you like to be able to “predict” market turning points — and spot trading opportunities with low risk and huge returns?
Well, nothing works all the time.
But the technique I’m about to show you works well for me.
Here’s how…
- Wait for the price to reach key market structure on the higher timeframe (like Support & Resistance, Trendline, etc.)
- Wait for the trending move to get “weak” by having smaller bodied candles
- Wait for the retracement move to get “strong” by having larger bodied candles
- Enter on the break of structure
Let me give you an example…
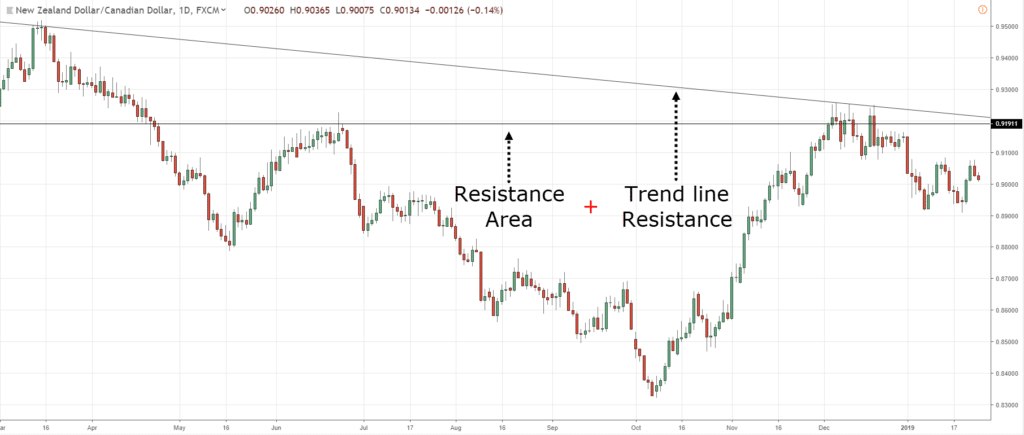
NZD/CAD Daily:
On the Daily timeframe, the price is at Resistance area and has a confluence of a downward Trendline.
The price could reverse lower so let’s look for a shorting opportunity on the lower timeframe.
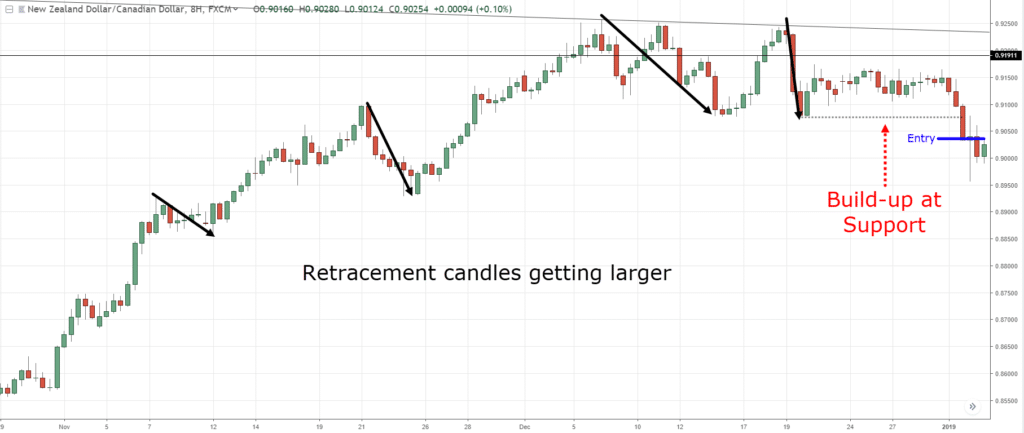
NZD/CAD 8-hour:
On the 8-hour timeframe, the selling pressure is coming in as you notice the candles of the retracement moves getting bigger (a sign of strength from the sellers).
Also, the buying pressure is getting weak as the candles of the trending move get smaller.
One possible entry technique is to go short when the price breaks and close below Support.
I know this can be complex for new traders, so here’s another example…
NZD/USD Daily:
On the Daily timeframe, the price is at previous Support turned Resistance.
The price could reverse lower so let’s look for a shorting opportunity on the lower timeframe.
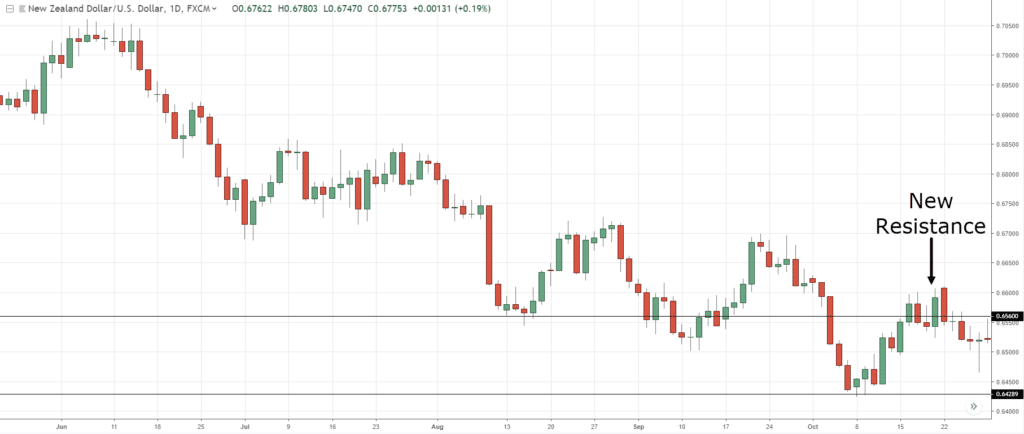
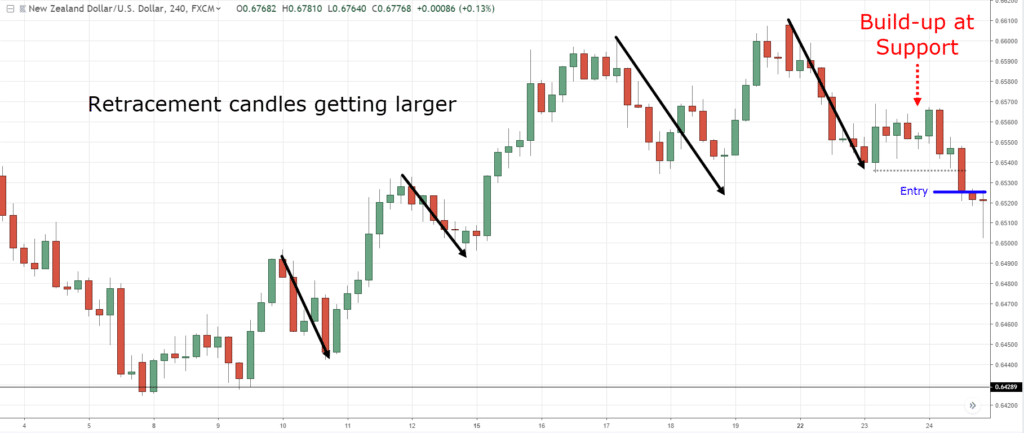
NZD/USD 4-hour:
On the 4-hour timeframe, the selling pressure is getting stronger as the candles of the retracement move get larger.
Also, the buying pressure is getting weak as the candles of the trending move get smaller.
If you want to trade this setup, you could go short on the break of Support.
This is powerful stuff, right?
Bonus: How to trade candlestick chart like a professional trader (3 powerful tips)
At this point:
You’ve got what it takes to trade candlestick chart like a professional trader.
But I’m not done yet.
Because here are 3 powerful tips to help you improve your candlestick chart reading skill, fast.
#1: Higher lows into Resistance is a sign of strength
Old Rayner: “Oh look! The price is coming to Resistance, time to short this market.”
New Rayner: “Not so fast…”
Here’s the thing:
You don’t go short just because the price is at Resistance.
Why?
Because how the price approaches Resistance matters a lot.
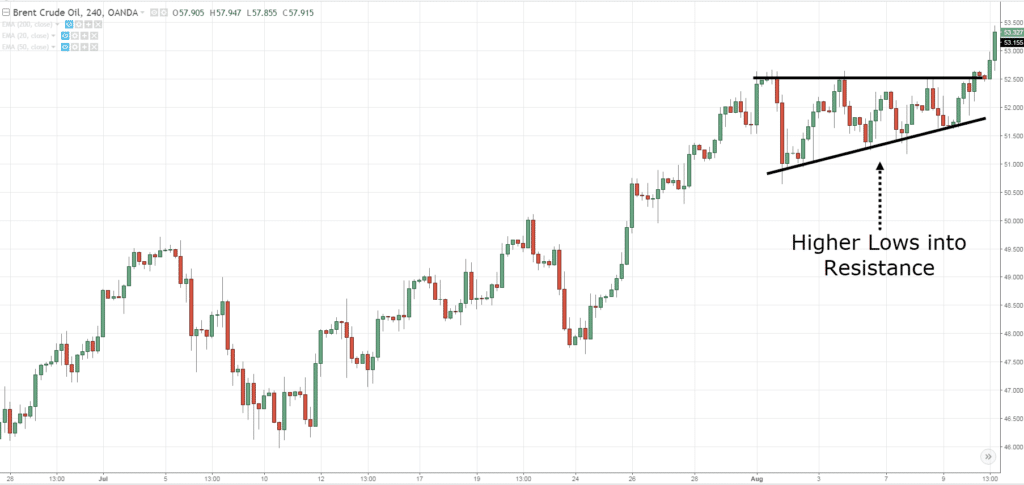
For example, if you see higher lows coming into Resistance, it’s a sign of strength.
It tells you the buyers are willing to buy at higher prices and the sellers are unable to push price lower (than it did previously).
And this looks like an Ascending Triangle on your chart:
Can you see the higher lows approaching Resistance?
That is a sign of strength.
And more often than not, the price breaks out higher.
Pro Tip:
And the opposite is true.
Lower highs into Support is a sign of weakness (and it looks like a Descending Triangle).
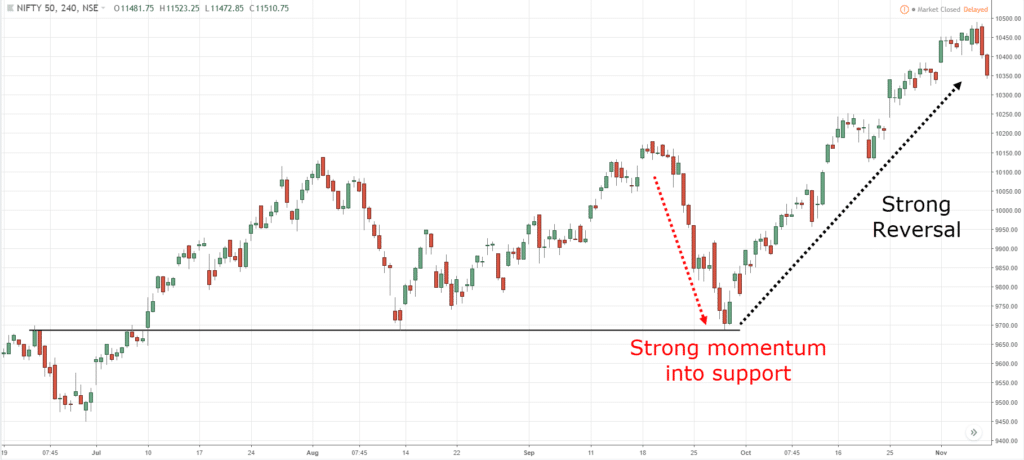
#2: If you see a strong momentum coming into a level, it’s better to trade the reversal
Here’s why…
When you get a strong momentum move lower, it’s because there isn’t enough buying pressure to hold up the prices — that’s why the price has to decline lower to attract buyers.
Now the entire “down move” is called a liquidity gap (a lack of interest) since not many transactions took place on the decline.
This means the market can easily reverse in the opposite direction due to a lack of interest around the price level.
That’s why you often see a strong move down into Support, and then BOOM, the price does a 180-degree reversal.
Here’s an example…
So remember, if you want to trade price reversals, always look for a strong momentum move into a level.
#3: Wait for the false break to profit from “trapped” traders
Has this ever happened to you?
You noticed the market broke out of the highs and you think to yourself…
“This breakout is real. Just look at the HUGE bullish green candle.”
So, you immediately go long… hoping to catch a BIG move.
But shortly after you entered the trade, the market reverses in the opposite direction!
And it doesn’t take long before you get stopped out of your trade.
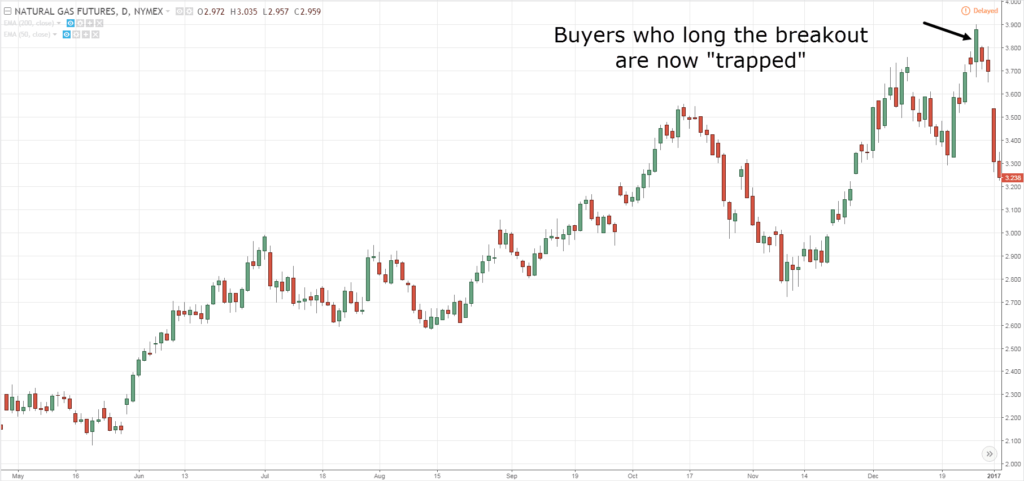
Here’s what I mean…
So, what just happened?
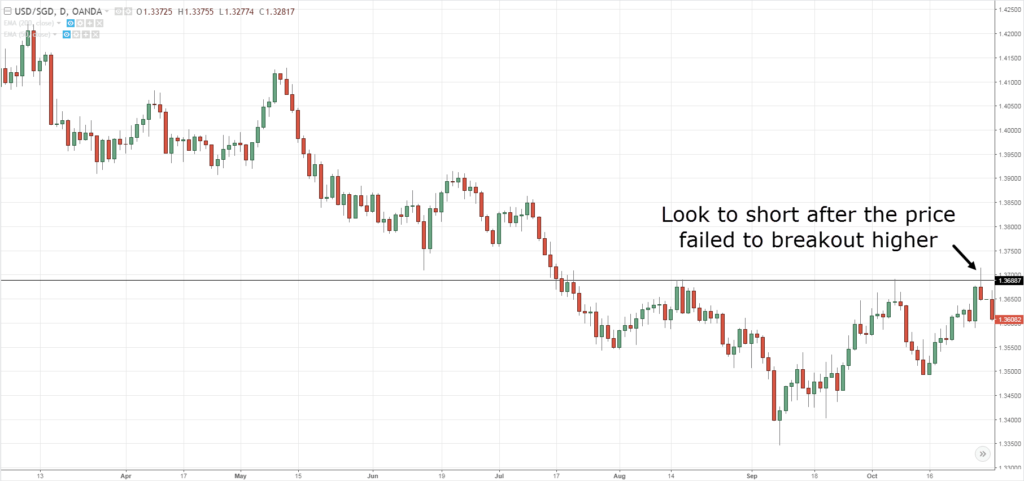
Well, I call this a False Breakout.
It’s when you trade a breakout only to get “trapped” and have the market reverse against you.
Now you’re probably wondering:
“How can I profit from the False Breakout?”
Here’s how:
Identify the key Support and Resistance where traders will look to trade the breakout
Wait for the breakout to fail when the price trades back into the range
Trade in the direction of the False Breakout
Let me show you an example:
This is powerful stuff, right?
Now if you want to discover more on how to profit from “trapped” traders, then check this out:
Frequently asked questions
#1: Can we apply all of these to other markets like bonds or cryptocurrencies?
Yes, you can apply these concepts to other markets like bonds or cryptocurrencies.
#2: Is there a way to know for sure that it will be a breakout instead of a false break?
There’s no way to know 100% that it will be a breakout instead of a false break.
But there are a few things to consider:
If the higher timeframe is in a downtrend and the breakout is to the upside, then chances are, the breakout will fail.
Alternatively, you want to see how the price approach a level. If it approaches a key support resistance with a huge momentum in a short period, then chances are, it’ll need to take a breather and the price would likely pullback (or reverse altogether).
Conclusion
So here’s what you’ve learned from the ultimate guide to candlestick chart patterns today:
- If you want to read a candlestick pattern, ask yourself: 1) Where did the price close relative to the range? 2) What’s the size of the pattern relative to the other candlestick patterns?
- Candlestick chart is made up of a series of candlestick patterns
- Identify the swing highs/lows on your chart. This tells you whether the market is in a trend or range
- A trending move is the “stronger” leg of the trend whereas the retracement move is the “weaker” leg of the trend
- If the trending move is getting smaller and the retracement move is getting larger, it’s a sign the trend is weak (and might even reverse)
Now it’s your turn…
How do you trade with a candlestick chart?
Leave a comment below and share your thoughts with me about this candlestick chart guide.




Hey man …!!!! You’re genius. I have learned a lot from your techniques. This article is so helpful. My experience is now more improved. Last day I failed in consecutive 4 trades opposite direction of the up trend which was a real breakout. Now I learned that why did that happened. Thank you for your article.
You’re welcome, Zia Khan!
It is a great lesson groups in one with good examples & explana tions. Now l have learnt a lot. Thanks Rayner. Pls keep them coming.
.
I didn’t know about the candlesticks and I was using the 1 minute timefrane which is not a true reflection of the trendline
Learned a lot from you and that you very much
Awesome, Ibrahim!
Hi do you send paid signals
Hi Sorab,
Rayner doesn’t offer signal services.
Cheers.
Am really really learning a lot from you Rayner, am a newbie, but the rate at which you’re cultivating trading skills within me is amazing!! I started making profits the first day I accessed your trading lectures!! Thanks a lot!!
This is awesome!
Keep it up, Peter!
Cheers.
Mr. Rayner thanks so much for this tutorial, it’s really mine.Last week I got caught up in a bad side I was trading gold while having a long position for three days and then a bearish engulfing came took over,it took all my profits.
You’re welcome, John!
This is comprehensively fantastic. Am in-depth lesson on candlestick formation and interpretation. Thanks a lot.
Cheers
Thanks boss, truly I wanted so much to learn from you, but am helpless to meet your price. All your free lesson is more enjoyable. I used to trade initial breakout and later stop out, seeing price dive 50pips opposite direction. And am used to short trade on resistance and long on support, but mostly stop out.
Glad to be of help!
Hey Rayner,
I always love your articles. Very simple, basic and straight to the point. VERY powerful stuff. What is interesting is that I trade options and using much shorter time frames and the concepts you teach work at any time frame. Even though I don’t follow you nearly as much, if I need a refresher, my first and only choice is you. Continue to share your knowledge to everyone and I’ll continue to share your name to anyone who is interested.
Thank you, Chris!
I appreciate it.
Excellent !
Cheers Vinod!
Nice article. Very well explained with charts. This can help many. Congrats.
I’m glad to be of help!
These is powerful work my friend.
I have leant a lot thanks very much.i now understand more about price action.
Awesome to hear that!
This trading technique is wonderful and the important of it is to know the 4 relating component, which is opening, high, low and close.
Cheers Sacky
How to get a book and how much
Which book?
After NZD almost blew my account and Rayner you just brought back hope, thanks
You’re welcome!
Am proud to be associated with you. I have learned so much from you. I pray that the creator should give you more ideas so I could learn more from you. thank you
I’m glad to be of help!
Hello Rayner, which broker do you use?
I don’t publicly discuss brokers because in this day and age, we have no idea what goes on behind the scenes.
If you want a recommendation, drop me an email me and we can discuss it.
Please help me as well with your trading wisdom Rayner.
Really good stuff. I can’t thank you enough.
You’re welcome!
Wow Rayner, you have provided me with so much info, I have got a lot of reading and understanding to do now which will take me quite a bit of time! Thanks so much for all this, fantastic to find someone such as yourself so enthusiastic to share great your knowledge. Thanks again.
My pleasure, A!
An amazing stuff keep it up brother
I will!
You look to see what was the closing price relative to the range , and look at other candel sticks relative to the candel still you want to get in on.
Thanks again as always…I’ll be reading every night in order to fully understand it
Awesome, cheers
Hi Rayner please share your thoughts about supply and demand zone…
I’ll look into it…
Thanks Rayner for improving my trades.. Can you tell me patterns that happen often and how to trade them successfully
Thank you for the knowledge I’m a new trader now trying to learn and I must say you are making it easy for me to learn GOD BLESS
And keep up the great work.
I will, cheers
Hey rayner I am Naseem from thanks u so much for sharing ur wonderful knowledge. With the help of ur strategy every one can learn more and more . Thanks u bro
My pleasure!
Great Explanation .
Thank you for making it easy to understand. I love your diagram and charts… Rayner…
I’m happy to hear that!
Nice stuff rayner am derick from Uganda I always put into place what I learn keep the good spirit
Cheers
Superb Rayner ! no one can beat your technique and the way of teach and every word. You are superb and thank you for your efforts. Great!!!!
Glad to be of help!
Sir Ur saviour a true mentor and guru
Cheers
It has been very useful reminder to me! Thanks a lot!
My pleasure!
Hi sir, can I download this in a pdf file? You’re one of the best.
it’s only available in Pro Traders Edge.
Thanks so much for this.
I’ve added more knowledge to my bank of strategies.
Awesome!
That’s a great lesson but I am a new baby in the trading system, and I am still confused about when and how to locate my 200MA in the candle sticks chart,,,please help out,,thanks once more for your great teaching May God continue to empower you with more wisdom.
Amazing, lessons so far. I really learnt a lot.
Awesome!
This Is really Helpful Man ..How Simply u make us understand Advance methods.
Awesome to hear that!
Very nice man! can we apply all of this with the cryptocurrencies pairs?
The principles work the same.
Thank you Rayner, I’ve learned alot from this info. Though, I’m still noobs on this but i would like to apply this method on my trading.
Awesome, let me know how it works out for you.
Completely el genio
It’s indeed a lot of counter intuitive stuff. That’s why most people fail at it.
Also, it’s always a probabilistic approach, so risk management is so important.
Thank you for sharing, Paulo!
Greetings your work is super great it’s helping me out with understanding how the market works thanks for helping others who has lost almost everything
My pleasure!
WOW..YOU ARE SO CLEAR IN YOUR EXPLANATIONS . AM NEW TO FOREX TRADING BUT AM REALLY LEARNING SO WELL FROM YOU RAYNER. PLEASE CONTINUE SENDING ME EMAILS ACCORDINGLY.
I will, cheers!
After studying your book for only two days, I started to see a change on my trading skills
Awesome stuff!
A very simple and straightforward guide. I’m highly profitable today thanks to your teaching. May God bless you.
I’m stoked to hear that!
Hi!
How many position do you enter for a single trade? and why?
Thank you for this wonderful Guides..I believe my trading approach will change now.
that was a superb…
i was learning from ur pre videos…but after reading this ,i got clear all my doubts..
thank you so much
Awesome to hear that!
Great info man! Thanks a lot
Anytime!
Thank you for cheering more light into candlestick chart.It is very helpful.
Glad to help out!
Thank you so much.
My pleasure!
If I am to be a successful trader then it would have been because of you Rayner
Thank you for your kind words!
Thanks a lot sir we do appreciate
Hi Wetaka,
You are most welcome!
Lovely start
Keep on going!
It as been a nice time being hear, I have lean so mush with you Rayner. Thanks to you.
My pleasure!
Thanks man God will continue to give wisdom and blessings….. I guess I learn a lot
please how can I identify support and resistance from chart .
Thank you so much Rayner.
This has been very enlightening and I will study this and try to put it to practice.
Awesome, let me know how it works out for you.
Thank you. This is very helpful. Continue helping the beginners like me, I really appreciate it.
You’re most welcome!
Thank you for the tutorial. It is a good learning experience for me.
Awesome to hear that!
I am very inspired by you. Thank you.
You’re most welcome!
you just opened my mind to a totally different way of seeing the market. Thank you so much for this knowledge you are extremely generous! God bless you
You’re most welcome!
You’re really amazing man, I am few months old with forex, I have been really learning blindly but with the ideas I have learned from your PDF and articles, I was able to follow the rules and read market closely. I just made up to $13 after a huge previous misunderstanding of how the market works.
Awesome stuff!
Hey Rayner, I am learning a lot from your blog man, It really is so much informative, Keep up the good work.
Thank you, Mayur!
Thanks Rayner a lot I used to think that I know candlestick but I knew nothing but after reading the article I think I’m somewhere hoping to be like you may God bless you
Cheers Beryl!
hey my friend, im very pleased of how generous you are to me/us. i hope you dont get tired giving your wisdom. thanks
Thanks Rayner for the “learning forex made easy” pattern of impacting trading knowledge to us newbie.
You’re most welcome!
Hi, I am beginner. I have difficulties to understand the pattern. What will be the easiest pattern to understand for beginner like me?
I feel, there is no other easy way to understand the pattern than the one explained by Mr.Rayner. I suggest you to revise again and again by revisiting this video, when automatically you will understand the pattern.
Thanks Mr.Tony. Take these words as motivation and do not get your feelings hurt.
Fantasic nearly one hour lecture. Each and every word of your lecture has a strong strength and worth the time to hear the lecture. I never felt bored and was eagerly waiting for the next move and enjoyed. Of course, to have 100% clarity I need to revisit this as many times as possible. Thanks forff your eorts Mr.Rayner. For your information, I am a senior citizen (age:63 years) and from Bangalore, India.
Date:13-04-2020
You’re most welcome, Raja!
Hey Rayner what’s up my friend, I feel very grateful to you .
The complete guide to candlestick chart has really opened my eyes. I can see the light through the tunnel. Thank you very much Sir Rayner.
Hey Albert,
You are most welcome.
Very informative, detailed and useful article, great.
Hey Willaim,
Thank you!
Where could I get this article in the form of a book?
Superb helpful bro, thank you lot
Hey there,
You are welcome!
Rayner I absolutely love your teaching. I can see why my trading buddy/mentor suggested I check you out. I learned a lot from this lesson. It will take a little while for it to sink in and be able to apply it, but it is a start. Thank you so much and good luck to you.
Hey Alan,
You are most welcome!
Rayner, am big fan of your teaching methodology, Am newbie in this market but your lessons are helping me a lot.. thanks a lot
Hey Rashmi,
You are most welcome!
This article is so helpful! After reading this article, as well as watching all your videos on YouTube, and applying it, I feel like I have become a much better trader. Thanks Rayner!
Hey Ivan,
You are most welcome!
One needs to understand candlestick pattern to be able to read candlestick charts
Hi Fikile,
I’m glad to hear that!
First af all, thank you Rayner for your professional skill in forex. I’m happy to know you as a mentor, is nice following your classes. As for me, I enter the market when I got to know the trend at D1then fine my entry at H1. Most especially when the trend is at the support or resistance zone or level at the early stage of a new candlesticks formation with stop loss and take profits. I am correct on this?
Hi Eze,
I’m glad to know that you trade with the trend.
Cheers.
Thanks a lot Sir Rayner.
Your daily writings and articles has been so helpful to me in my journey as a trader.
Hey Vincent,
You are most welcome!
You’re a fantastic teacher!!!
The way you teach makes learning trading easier than i thought.
Thank you very much!!!
Hi Taiwo,
Thank you!
Cheers…
great read and thank you for your support
Hi Shuaib,
You are most welcome!
Wow, so great you have truly thought me, never had this Kind of explanation before on trade.
Thank you Rayner, will love to get much stuffs like this because am a beginner in trade
Hi Kingsley,
You are most welcome.
Just follow the blog…
https://www.tradingwithrayner.com/category/blog/
Thank you am new to trading am just learning. I like your explanation. Can I continue to learn from you
Hi Mubangizi,
You are most welcome!
Feel free to check out the trading academy…
https://www.tradingwithrayner.com/academy/
Hello Rayner sir…its very helpful blog for me.. i am feeling lucky to find you and reading your blog..keep posting more information. you have no idea how its help me. love from India.
Hi Saber,
I’m glad to hear that!
i have learned a lot from your teaching. i use to read candles alone without considering the trend and not putting up stop loss and this have cast me a lot and blew up my account about three times. i will continue reading your strategies cos i believe that one day i will become a successful trader.
Hi Jonas,
I’m so glad to hear that!
Thank you for the tips ans the lesson. Looking forward to practising it on the charts
Hi Shy,
You are most welcome!
One of the young leader of market, had lots of materials to read published by you , genuis brother !!!
Hi Manik,
Thank you!
Cheers…
Morning wish indicator must I use in a 5minuto time frame
Hi Thomas,
Check this post out…
https://www.tradingwithrayner.com/trading-multiple-timeframes/
Thanks a lot, Rayner. I have feeling after reading your many of the posts that I can become a successful full time trader.
HI Tamil,
You can Tamil, successful traders are made not born…
Cheers!
Thank you so much Rayner for providing such insightful treasures.
I am regular viewer and admirer of your Youtube videos. You explain everything with such ease. Only one word describes you “Awesome”.
Hi Ravi,
You are most welcome!
Cheers…
really love your tips.. so easy t understand for newbie like me
Hi Ninie,
I’m glad to hear that!
Thanks alot,i have really learned alot from you.Hoping to use these tips in my trading strategy.Thanks again
Hi George,
I’m glad to hear that!
Cheers.
Bro this stuff is golden.. I have been trading for years now and applied the same rules in my trading strategies. Brilliant stuff and keep up the good work.
Hi Muhammed,
Thank you!
Cheers.
I eagerly wait do your emails rayner & these are so very helpful for lay man who is inclined towards technical analysis . Thank you for sharing this info with all . This is truly gold .
Hi Shino,
Thank you!
Cheers.
Hello Rayner, thanks for the tips on the candlestick. I remembered the first time I looked at the chart it was quite scary, but you simplified the process so well. The only thing I wasn’t clear on was the 200MA. Can you clarify.
Hi Gwyneth,
You are most welcome.
Check out this post.
https://www.tradingwithrayner.com/200-day-moving-average/
I have randomly searching for best study material and on a sudden click google took me up here, and honestly It was quite impressed and relevant material to read, well explained with an examples for even new comers to understand such a complex subject.
I woukd give a big Thanks to the writer and his excellent depth knowledge that he would tried to make understand who just shown his interest to understand supply and demand concept and techniques and charts will help a lot to get rewarded in your investment.
Thanks a ton
Hi Praveen,
You are most welcome!
Cheers.
Hey rayner. I like the way u teach and ur method is very easy to understand for new traders like me. Can i buy your Price Action Trading Secret Books in pdf version(ebook)?
Hi Aizzat,
You are most welcome!
The PATS is free. You pay just for the shipping.
You can have the PDF once you pay for the shipping.
Cheers.
Great stuff from South Africa but i wanna learn more about financial market
Hi Sandile,
Thank you!.
Stay tuned.
Hi Rayner, do you have any teachings on the RSI and Stochastic RSI?
Hi Gypseygirl,
Check out this post.
https://www.tradingwithrayner.com/forex-indicators/
Cheers.
Mr Rayner, wow, what a tutorial. I’m so impressed. Thanks a lot
Hi Bakare,
You are most welcome!
Great stuff..equivalent to Pro-stuff
You are welcome, Manoj!
Good stuff Rayner, very simple and informative
Thank you, Kamran!
Hey Rayner. Thanks for this. I understand your explanation except with why buyer’s are in control with green candles and seller’s are in control when red candles. Is this same case with forex Or with stocks also? I’m not much familiar yet. Thank you
You are my GURU…You are my MENTOR….I am always learning great things from u…..You are the best….
You are welcome. Rajesh!
Hi Rayner, thank you for your email. Please can you offer some guidance on keeping a position in regard to timeframe. I use the daily to identify support and resistance and then use the 4H chart to plan my entry. But what I seem to find is that I hardly ever hold a position more than 8 hours if I’m lucky. Am I letting my emotions get the better of me, or is my approach wrong. I want to be able to gain from the trends over a decent period of time.
Im a newbie in trading and have done a whole lot of research and encountered with several articles of yours, but you tend to be the only genuine and most honest mentor have ever come across, it’s obvious that your purpose is to help every other traders to become profitable and you’ve encouraged me and so many young traders in such a way you never imagined. I’m now your biggest fan.
May God bless you in all ramifications.
ola. did read all and i found really useful i am a complete beginner still not sure which is the support and resistance line on charts, tips on that?
You really need to study more
I trade candle stick charts based on support and resistance considering the momentum of the candle sticks and the confirmed levels.
Hi Rayner,
I can’t thant you enough for the value you have added to me in terms of trading, is only God the creator that can reward you
abundantly for the knowledge you are passing to others freely. Your great books, Price action trading secret and Candlestick chart has impacted positively into my trading acknowledge. THANKS RAYNER TEO.
Hey Rayner. Greetings from Romania. Great stuff you posted here. I started to trade with an account of just 250 EURO a few days ago and using what I learn from you on youtube and your website I`ve double it. 🙂 Thanks my friend and keep up the good work.
Awesome, Antonio!
You are a rockstart… Thanks a lot..
You are welcome, Sameer!
I got the book Brother!!!!
I’m the Arizona Ari dude….
Book arrived a week ago.
Going to start reading it.
Glad to hear that, Ari!
Hi Rayner, your article is really great. I learned a little about Price Action and I want to learn more from other sources. I traded in Binary Option using a 1-minute time frame, and I’ll try this technique if it works. I want to buy your “Price Action Trading Secrets” ebook, but please let me know if it can help me too in Binary Option trading. Thank you very much in advance.
You are just great
God bless you
Thank you, Mknz!
I am inspired and hope to correct my earlier trading style. I am sure, it will help me to improve my trading. Basically, I am a day trader and wish to get a better results.
Awesome, Dilip!
Thank you very much for your lessons. I’m following you and I learned many things.
Damn! This was awesome! I was having tremendous trouble reading a price chart on how to determine its direction and what the candles were telling me and what it was saying as price reached my key levels! You calmed my heart with this information..your knowledge is wonderful..
Thank you so much, Mars!
Hi…Rayner.. Gaining Greater knowledge from your sharing.. All your videos are simple and direct to the point..step by step guidance..very powerful. Thank you Rayner.
Thank you, Selva!
Thanks alot, this Book has improved me.
Awesome, Destiny!
Hey Rayner
With your articles and certain that we are heading somewhere, thank you very much for your help. Am a beginner in this but am sure with your help I will prosper in this journey. Well explained notes, straight to the point. Salute
Thank you, Jack!
A good lesson indeed! I now have the ability to review this week’s trades in a ‘where I traded’ vs ‘where should I have traded?’
Thank you, I will try this strategy. 🙂
Glad to hear that, Lani!
Waw! Rayner thank you very much for this platform. Please keep them coming. If only I had met you all these times, I would have been better than I am
Thank you, Daniel!
Thank you Rayner for summarizing what took you years to learn and puting it in a box for a beginner like myself.
I appreciate!! Thanks alot.
You are most welcome, Marylands!
I’m gonna get rich from your techniques and then I’ll buy you a lambo!!
Haha. Awesome, Danimal!
Thanks for making me better
I’m glad it helped, Ifeanyi!
Thank you for this information. It has given me a better understanding of how the candlestick patterns work. Excellent
I’m glad to hear that, Yvonne!
I have learned a lot from you. You’re the Best!
We’re happy you learned from it!
Cheers!
Am Shamusi, Thanks Rayner,this was quit well explained for me to understand the candlestick pattern. Be blessed big man.
Hey there!
Jarin here from TradingwithRayner Support Team.
I am glad you find it informative. If you are new to trading, you might wanna check our Academy. This will also help you big time! Here is the link:
https://www.tradingwithrayner.com/academy/
Cheers!
This is an ever green lecture
It improve my tactic. Keep it up.
That is good to hear, Olaifa!
Thanks
Sure thing, Dzikamai!