Three Black Crows Candlestick: What is it and how does it work?
According to most trading books, the Three Black Crows is a bearish trend reversal Candlestick Pattern.
However, that’s the wrong way to look at it (and I’ll explain why shortly).
But first, here’s how to recognize the Three Black Crows pattern:
- 3 consecutive candles with a lower close
- Little to no lower wicks
An example of the Three Black Crows candlestick pattern:
(And the opposite is called Three White Soldiers, I’m serious.)
Now, you might be thinking:
“This looks like a bearish Candlestick Pattern. And it’s better to short the markets.”
Nope and here’s why…
Why the Three Black Crows pattern has fooled many traders
Here’s the thing:
The 3 Black Crows’ meaning or significance is just a small part of your trading analysis.
Just because the market has closed lower 3 days in a row doesn’t mean the uptrend will reverse.
Because the context of the market is more important than any Candlestick Patterns you’ll come across.
So, what do I mean by the context of the markets?
It means to look at the Market Structure, is it in an uptrend, range, or downtrend?
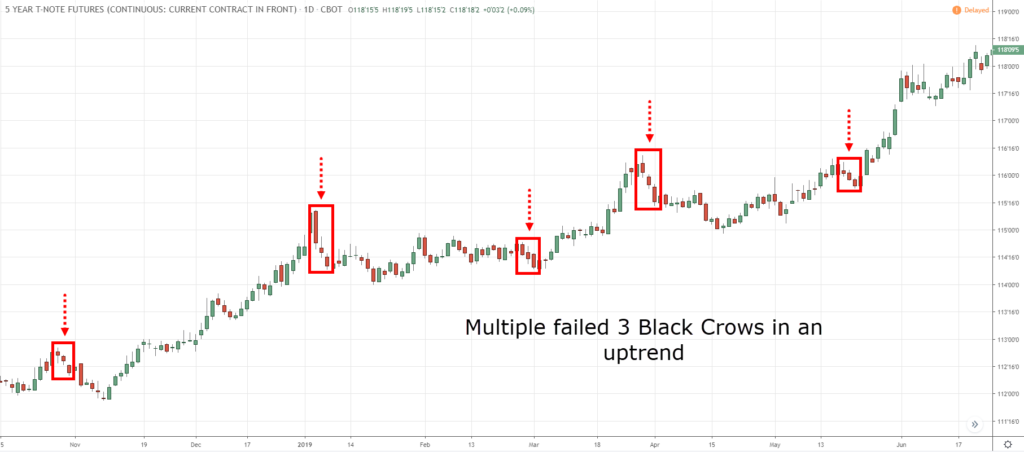
Here’s an example of a Market Structure in an uptrend…
As you can see, there are numerous Three Black Crows formed — and all these patterns failed. Why?
Because market structure triumphs any candlestick patterns — and it doesn’t matter if the name is Three Black Crows, Knight in Shining Armor, or whatever.
Now you might be thinking…
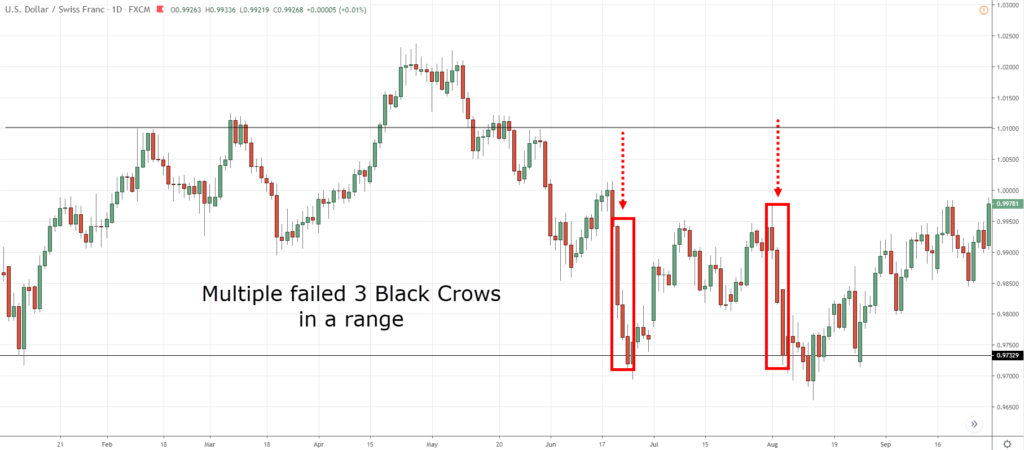
“But what about range markets?”
It’s a horrible idea to sell after a Three Black Crows pattern has formed (even in a range market).
Here’s why…
After a Three Black Crows pattern has formed in a range market, the price is likely near the lows of Support (and far away from an area of value).
Let me ask you…
Do you want to sell into Support after spotting the Three Black Crows candlestick pattern?
I hope not because Support is an area where potential buying pressure could come in.
Why sell into Support?
You’re better off shorting at Resistance. But, that’s never possible if you’re using the Three Black Crows to time your entry.
Now, does it mean the Three Black Crows pattern is useless?
Not quite.
Because if you do the opposite of what’s being taught, it might yield some interesting results.
Read on…
The Three Black Crows is a losing pattern, here’s the proof…
Now, rather than selling when you spot a Three Black Crows pattern, look to buy instead.
Here’s a simple backtest to verify whether it works, or not.
Markets traded:
S&P 500 stocks
Trading rules:
If the price is above the 200MA, then look to buy only (or else remain in cash)
If the price forms a Three Black Crows pattern, go long on next candle’s open
Exit when 2-period RSI crosses above 60, or after 10 trading days
Maximum of 10 stocks with 10% of capital allocated to each stock
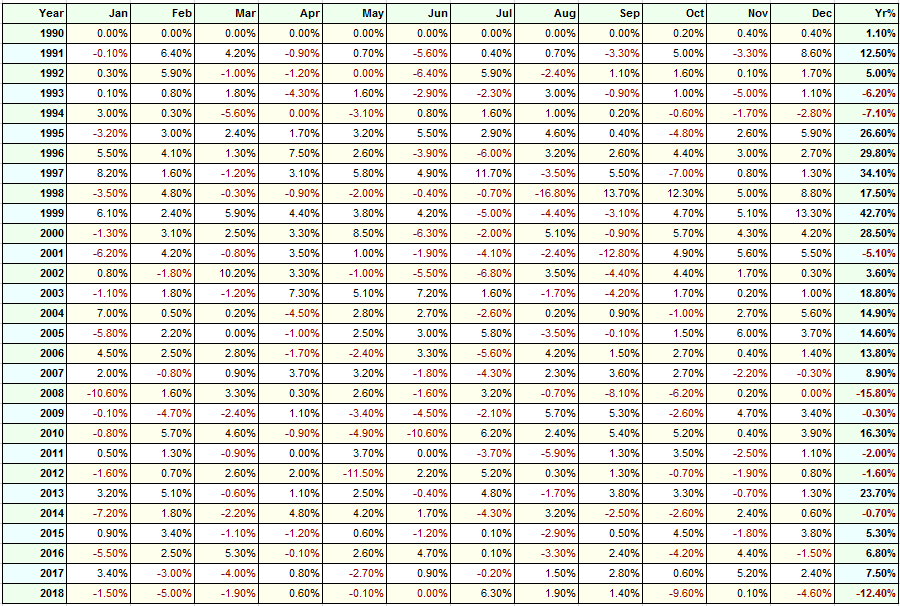
The backtest results:
Number of trades: 13522 trades
Winning rate: 63.76%
Annual return: 8.79%
Maximum drawdown: 34.14%
Clearly, by going against what the textbook teaches, this “system” actually generates a positive expectancy.
Also, I’ve tested this in Gold and Bond ETFs and the data shows the Three Black Crows is a losing pattern if you follow what the textbook says. But if you do the opposite and buy, it yields a positive result.
(Note: I can’t say the same for every market, that’s something you’ll have to verify yourself.)
Moving on…
How to trade the Three Black Crows pattern (hint: you do the opposite)
You want to go against the herd.
So what’s the 3 Black Crows’ meaning here?
This means you treat the Three Black Crows Pattern as a bullish signal — alerting you of potential buying opportunities.
Here’s how to trade it…
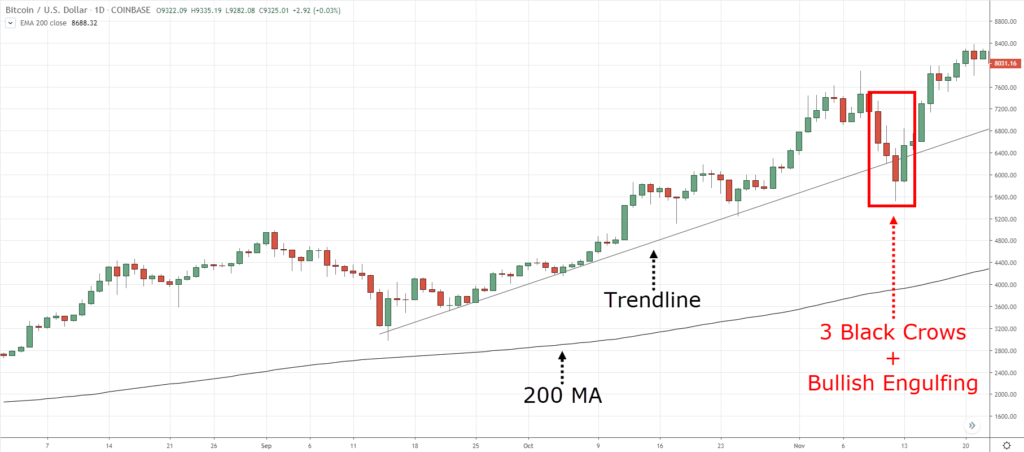
- If the price is above the 200MA, then look for buying opportunities (no shorting)
- Wait for a Three Black Crows pattern to come into an area of value (like Support, Trendline, etc.)
- Go long when the market shows rejection of lower prices (like Hammer, Bullish Engulfing, etc.)
Here’s an example:
Moving on…
The Three Black Crows is not useful to identify trend reversal, so what now?
Earlier I said, Market Structure triumphs any Candlestick Patterns.
So now the question is…
How do you use Market Structure to identify trend reversals?
Here’s what to look for…
- Break of the prior swing low
- A lower high and low
1. Break of the prior swing low
Here’s the thing:
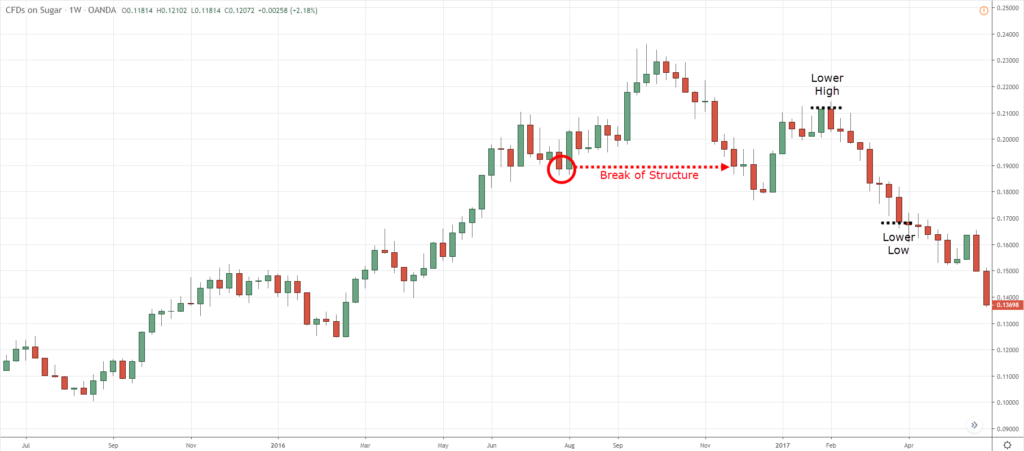
You know an uptrend consists of higher highs and lows. So, when the price breaks below the prior swing low, it’s a sign the uptrend is getting weak.
Now, this doesn’t mean the uptrend is over because it could be a false breakdown and the market continues higher.
That’s why you want to pay attention to the next point…
2. A lower high and low
After the price breaks below the swing low, you want to know if the buyers are losing strength.
The easiest way to tell is when you see the price fail to re-test the highs but instead, makes a lower high and low.
Here’s an example…
Pro Tip:
You can use the higher timeframe Market Structure as confluence. This means if the price is at a higher timeframe Resistance — the chance of reversal is higher.
Conclusion
So here’s what you’ve learned today:
- The Three Black Crows pattern occurred after the price has fallen 3 days in a row (with little to no lower wicks)
- Unlike what most textbooks teach, the Three Black Crows pattern is not a bearish signal — instead, it’s more profitable to use it for buying opportunities
- If you want to identify trend reversal, then read Market Structure — not Candlestick Patterns
Now here’s what I’d like to know…
How do you interpret the Three Black Crows pattern?
Leave a comment below and share your thoughts with me.


Three bearish candles with no to little tails. Price above 200 MA, making new highs and lows, looking to buy against the herd with a hammer or Bullish engulfing candlestick & enter trade.
Thanks for sharing!
Rayner, you are the best trader that share your skill free!!!
Glad to help out, Omale!
Absolutely correct
I am agree with Omar Sunday. You are awesome sharing your experience free to those with no knowledge and hunger to learn . Thank you
Thank you bud!
Peoples are charging huges for mentoring who can’t even teach in detail as you do. And you are sharing all these to help retailer. I have no words, what to say about you. You are everything I have. Live long
Thank you, Tayab!
Very interesting I was under the assumption this was a Bearish move only. Can this apply to day trading as well? Cheers Rayner you are such a boss!
That largely depends on whether the market you’re trading is a mean-reverting or trending market.
you are such an awesome super human, than you Rayner for this imformation God bless you.
Cheers
Wow thanks a lot Rayner,this strategy is really helping grow my account
Awesome to hear that!
Thanks Ray for the insights
Anytime!
I appreciate brother
this is gold given for free! Big thanks Rayner! Avid follower here =)
My pleasure, Jaymar!
Rayner thanks for sharing this, can I apply it if see
“Three Black Crows” on a shorter time frame?
This is Natalie from Hong Kong. I am new to trading and just discovered your YT channel and thus this blog. They are really useful thank you so much for your generous sharing!
You’re welcome, Nat!
im a new in trading and just studying the process. is it the right place? thank you very for this information
Francise
your information is very useful for me. Thanks so much. Rayner.
You’re welcome!
Good analysis and useful strategy. Any special advice if the 3 black crows are observed during an uptrend or after a consolidation ?
How do I read MA on a chart? Example, 20MA,50 MA,200MA Etc?
Hey Ester,
Make time to go through the post below.
https://www.tradingwithrayner.com/moving-average-indicator-trading-strategy/
https://www.tradingwithrayner.com/200-day-moving-average/
https://www.tradingwithrayner.com/50-day-moving-average/
Cheers.
After this session, I will treat 3 black crows pattern as buying oppurtunity. Tq Rayner!!
you are the one in this world best thoughts regarding stock market , many knowledge buildup after read your blog thanks for give us your expriance
Jarin here from TradingwithRayner Support Team.
Thank you for your kind words, Nakul Vijay!
Rayner is really happy to help other traders.
Cheers!